AUDUSD is trading at 0.6715; the instrument is moving below Ichimoku Cloud, thus indicating a descending tendency. The markets could indicate that the price may test the cloud’s downside border at 0.6750 and then resume moving downwards to reach 0.6515. Another signal to confirm further descending movement is the price’s rebounding from the descending channel’s upside border. However, the scenario that implies further decline may be canceled if the price breaks the cloud’s upside border and fixes above 0.6815. In this case, the pair may continue growing towards 0.6895.
NZDUSD, “New Zealand Dollar vs US Dollar”
NZDUSD is trading at 0.6466; the instrument is moving below Ichimoku Cloud, thus indicating a descending tendency. The markets could indicate that the price may test the cloud’s downside border at 0.6500 and then resume moving downwards to reach 0.6305. Another signal to confirm further descending movement is the price’s rebounding from the resistance level. However, the scenario that implies further decline may be canceled if the price breaks the cloud’s upside border and fixes above 0.6565. In this case, the pair may continue growing towards 0.6655.
USDCAD, “US Dollar vs Canadian Dollar”
USDCAD is trading at 1.3290; the instrument is moving above Ichimoku Cloud, thus indicating an ascending tendency. The markets could indicate that the price may test the cloud’s upside border at 1.3215 and then resume moving upwards to reach 1.3425. Another signal to confirm further ascending movement is the price’s rebounding from the support level. However, the scenario that implies further growth may be canceled if the price breaks the cloud’s downside border and fixes below 1.3155. In this case, the pair may continue falling towards 1.3055 and form Inverted Head & Shoulders reversal pattern.
Attention! Forecasts presented in this section only reflect the author’s private opinion and should not be considered as guidance for trading. RoboForex LP bears no responsibility for trading results based on trading recommendations described in these analytical reviews.
The US dollar has been growing against a basket of major currencies. Yesterday, the dollar index (#DX) closed in the green zone (+0.49%). Positive economic data from the US supported the American currency. So, ISM manufacturing PMI counted to 50.9 and was better than the forecasted value of 48.5.
The situation with coronavirus is still unresolved. The death toll from coronavirus in China rose to 425 as of Monday evening, and the number of infected exceeded 20,000. China continues to expand protective measures: in addition to Wuhan, Huanggang and Ezhou have already been closed. Perhaps quarantine will be introduced in other cities as needed.
Sterling was under pressure after comments by Boris Johnson. The Prime Minister said that Great Britain did not intend to adhere to EU trade standards after Brexit. Today, the Reserve Bank of Australia has decided on the interest rate during the Asian trading session. So, the regulator left the indicator unchanged at 0.75%. The central bank also kept forecasts of economic growth at current levels.
The “black gold” prices are recovering after a protracted fall. Currently, futures for the WTI crude oil are testing the $50.85 mark per barrel.
Market Indicators
Yesterday, there was the bullish sentiment in the US stock market: #SPY (+0.74%), #DIA (+0.55%), #QQQ (+1.51%).
The 10-year US government bonds yield has been growing. At the moment, the indicator is at the level of 1.57-1.58%.
The Economic News Feed for 04.02.2020:
– Construction PMI in the UK at 11:30 (GMT+2:00);
– Factory orders in the US at 17:00 (GMT+2:00);
– New Zealand labor market report at 23:45 (GMT+2:00).
The EUR/USD currency pair retreated from local highs after a sharp rally last week. The demand for greenback resumed after the release of optimistic statistics on business activity in the US manufacturing sector. At the moment the technical picture is ambiguous. The trading instrument is consolidating in the range of 1.10400-1.10650. Financial markets participants are waiting for additional drivers. It is recommended to open positions from key levels.
Today the news background is quite calm. At 17:00 (GMT+2:00) a report on industrial orders volume in the USA will be published.
Indicators do not give accurate signals: the price has crossed 50 MA.
MACD histogram is near the 0 mark.
The Stochastic Oscillator is located in the neutral zone, the %K line has crossed the %D line. There are no signals at the moment.
Trading recommendations
Support levels: 1.10400, 1.10200, 1.10000
Resistance levels: 1.10650, 1.10950, 1.11100
If the price fixes above 1.10650, expect the quotes to rise toward 1.10900-1.11200.
Alternatively, the quotes could descend toward 1.10200-1.10000.
The GBP/USD currency pair
Technical indicators of the currency pair:
Prev Open: 1.31703
Open: 1.29894
% chg. over the last day: -1.40
Day’s range: 1.29812 – 1.30238
52 wk range: 1.1959 – 1.3516
Aggressive sales dominate GBP/USD currency pair. During yesterday’s trading the drop exceeded 180 points. Sterling was under pressure after Boris Johnson’s comments. The Prime Minister said that Great Britain is not going to adhere to the EU trade standards after Brexit. At the moment GBP/USD quotes are consolidating in the range 1.29800-1.30250. The trading instrument has a potential for further decline. Positions need to be opened from key levels.
The Economic News Feed for 04.02.2020:
– UK Construction Business Index – 11:30 (GMT+2:00);
The indicators signal the sellers’ strength: the price has fixed below 100 MA.
The MACD histogram is in the negative zone, but above the signal line, which gives a weak signal to sell GBP/USD.
The Stochastic Oscillatoris in the neutral zone, the %K line is below the %D line, which indicates a bearish mood
Trading recommendations
Support levels: 1.29800, 1.29400
Resistance levels: 1.30250, 1.30650, 1.30850
If the price fixes below 1.29800, GBP/USD quotes are expected to fall further to 1.29400-1.29200.
Alternatively, they could grow to 1.30500-1.30800.
The USD/CAD currency pair
Technical indicators of the currency pair:
Prev Open: 1.32360
Open: 1.32869
% chg. over the last day: +0.41
Day’s range: 1.32867 – 1.33019
52 wk range: 1.2949 – 1.3566
USD/CAD quotes continue to show a stable upward trend. The trading instrument reached the round level of 1.33000. The mark 1.32500 is already a mirror support. The CAD is under pressure from aggressive sales in the oil market. However, the technical correction of the USD/CAD currency pair after the prolonged rally is not ruled out in the nearest future. Positions should be opened from key levels.
The Economic News Feed for 04.02.2020 is calm.
The indicators signal the strength of buyers: the price has fixed above 50 MA and 100 MA.
MACD histogram is in the positive zone, which indicates a bullish sentiment.
The Stochastic Oscillator is located near the oversold area, the %K line is below the %D line, which gives a weak signal to sell USD/CAD.
Trading recommendations
Support levels: 1.32500, 1.32200, 1.31900
Resistance levels: 1.33000, 1.33400
If the price fixes above 1.33000, expect further growth toward 1.33300-1.33500.
Alternatively, the quotes could correct toward 1.32200-1.31900.
The USD/JPY currency pair
Technical indicators of the currency pair:
Prev Open: 108.450
Open: 108.687
% chg. over the last day: +0.21
Day’s range: 108.548 – 108.934
52 wk range: 104.45 – 113.53
The USD/JPY currency pair has an ambiguous technical picture. At the moment the trading instrument is in sideways movement. Local support and resistance levels are at 108.600 and 108.950, respectively. USD/JPY quotes have a potential for recovery. We recommend you to pay attention to the US government securities yield dynamics. Positions should be opened from key levels.
The Economic News Feed for 04.02.2020 is calm.
Indicators do not give accurate signals: the price has crossed 50 MA and 100 MA.
Histogram of MACD has crossed to the positive zone, which indicates the development of bullish sentiments.
The Stochastic Oscillator is located in the overbought zone, the %K line has crossed the %D line. No signals at the moment.
Trading recommendations
Support levels: 108.600, 108.300, 108.000
Resistance levels: 108.950, 109.250, 109.450
If the price fixes above 108.950, expect the quotes to rise toward 109.250-109.450.
Alternatively, the quotes could descend toward 108.350-108.000.
On Monday, February 3, the euro was down at the end of trading. EUR and GBP both strengthened against the US dollar on Friday, before the value of all three currencies fell on Monday.
The coronavirus situation in China remains tense, with the number of patients and deaths continuing to grow. Nevertheless, stock markets stabilised after the fall of Chinese stock indices came to an end. Protective assets have fallen in price, and yields on 10-year bonds rose from 1.5034 to 1.5755.
The USD continued to rise against the yen after the publication of a report by the Institute for Supply Management (ISM), which showed that manufacturing activity in the US unexpectedly increased in January. The PMI rose to 50.9 in January, after falling to a revised level of 47.8 in December.
Today’s events (GMT+3):
12:30 UK: Markit Construction PMI (Jan).
13:00 Eurozone: Producer Price Index (MoM) (Dec).
18:00 USA: Factory Orders (MoM) (Dec).
Current situation:
Yesterday’s expectations came true. On Friday, the euro rose in price amid the exodus of investors in US bonds and their lower yields. The downwards correction was 76.4% of the growth from 1.1017 to 1.1095. En route to their target, bears will meet resistance at 1.1045, which is likely to be passed. Since the 45th degree is found at 1.1042, we are expecting a correction from it and a drop to 1.1014 in the American session. There is no important news on the calendar, which can majorly influence the euro.
Asian equities marched higher with US futures in the green, while China’s stocks stabilised on Tuesday morning despite coronavirus cases topping 20,000 with 425 confirmed deaths.
The recovery in risk sentiment may be based around official efforts to calm virus fears, China’s central bank pumping 1.2 trillion yuan into the economy and the unexpected rebound in US manufacturing overnight. With China also welcoming assistance from the United States to fight the virus outbreak, this could sweeten appetite towards stock markets in the near term. However, rising fears around the virus spreading further and destabilising the global economy will most likely create obstacles for equity bulls down the road. When risk aversion makes an unwelcome return, market players are poised to rush towards safe-haven assets like the Dollar and Gold.
Rough and rocky path ahead for Sterling
There was tension in the air on Monday as the European Union and Britain clashed over a post-Brexit deal.
EU chief negotiator Michel Barnier said in Brussels that a “highly ambitious” trade deal is on offer for the United Kingdom, but only if London agrees to its rules. However, this was rejected by Boris Johnson with the Prime Minister threatening to walk away from talks with the European Union without a deal. Johnson has called for a Canada-style free trade deal which will result in the elimination of import tariffs on most goods between the two countries, but the key question is will the EU listen to the Prime Minister’s demands? With both sides already clashing and disagreeing before official talks commence in March, the path ahead for the Pound will be uncertain and potentially volatile.
Sterling has weakened against every single G10 currency this morning and is currently 0.3% lower against the Dollar. The technical picture for GBPUSD is turning bearish with prices trading below 1.2960 as of writing. Sustained weakness below the 1.3000 psychological level should encourage a decline towards 1.2830.
Commodity spotlight – Gold
Gold has struggled to shine since the start of the week, despite coronavirus fears fostering caution and unease. The precious metal has shed 0.15% over the past two days and could extend losses in the short term as investors direct their focus back towards economic data. Nevertheless, Gold bulls still remain in a position of dominance in the medium to longer term due to the coronavirus outbreak and the negative impact it may have on the global economy.
Focusing on the technical picture, Gold could descend back towards $1565 before bulls look to re-enter the market. If this level proves to be reliable support, prices could rebound back towards $1580. However, a breakdown below $1565 should open the doors towards $1555.
Disclaimer: The content in this article comprises personal opinions and should not be construed as containing personal and/or other investment advice and/or an offer of and/or solicitation for any transactions in financial instruments and/or a guarantee and/or prediction of future performance. ForexTime (FXTM), its affiliates, agents, directors, officers or employees do not guarantee the accuracy, validity, timeliness or completeness, of any information or data made available and assume no liability as to any loss arising from any investment based on the same.
US stock market rebounded on Monday as positive data buoyed investors optimism undermined by worries about the impact of coronavirus infection in China. The S&P 500 gained 0.7% to 3248.92. Dow Jones industrial added 0.5% to 28399.80. The Nasdaq rose 1.3% to 9273.40. The dollar strengthening resumed as the Institute for Supply Management reported its purchasing manager’s index rose to a six-month high of 50.9% in January: the live dollar index data show the ICE US Dollar index, a measure of the dollar’s strength against a basket of six rival currencies, rose 0.5% to 97.82 and is higher currently. Futures on stock indexes point to higher openings today.
FTSE 100 led European indexes rebound
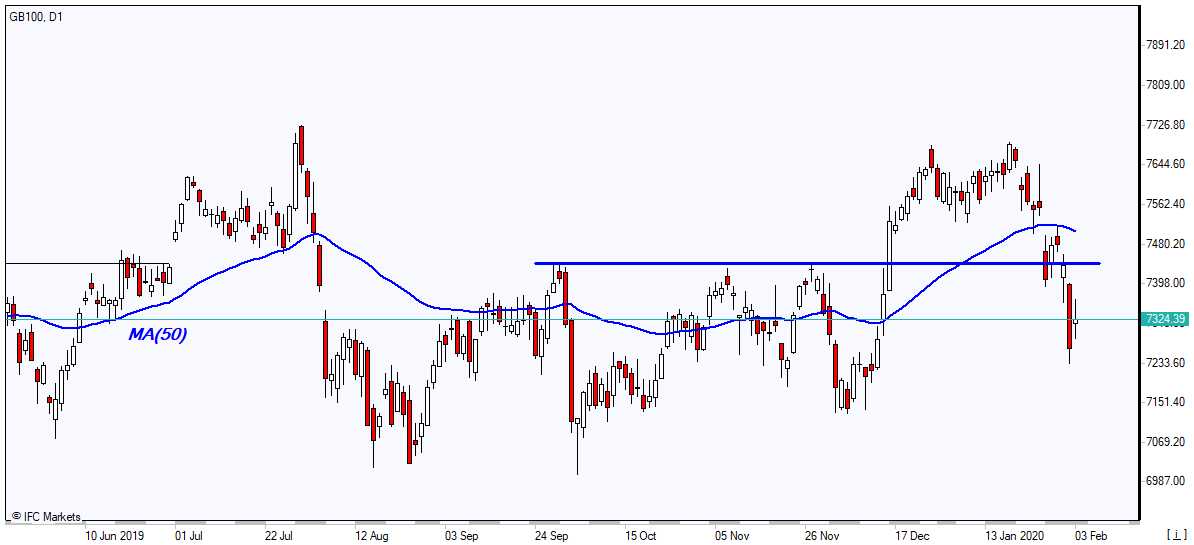
European stocks recovered some of previous session loss on Monday despite weak data. Both the EUR/USD and GBP/USD reversed their climbing yesterday with both pairs higher currently. The Stoxx Europe 600 index added 0.3% led by technology shares despite report euro zone manufacturing PMI (Purchasing Managers’ Index) readings came in at 47.9, again below the 50 level that separates contraction from growth. The DAX 30 gained 0.49% to 13045.19. France’s CAC 40 added 0.45% while UK’s FTSE 100 rose 0.55% to 7326.31.
Shanghai Composite Index leads Asian indexes rebound
Asian stock indices are rebounding today. Nikkei recovered 0.5% to 23084.59 as yen slide against the dollar continued. Markets in China are rising after People’s Bank of China statement Sunday it would inject about $174 billion into the economy to support the economy: the Shanghai Composite Index is up 1 % and Hong Kong’s Hang Seng Index is 0.9% higher despite report of first coronavirus death. Australia’s All Ordinaries Index recovered 0.4% despite continued Australian dollar climbing against the greenback.
Aramco plans joint venture in India ase Brent recovers
Brent futures prices are recovering today. Prices ended sharply lower yesterday: April Brent crude closed 3.8% lower at $54.45 a barrel on Monday. Saudi Aramco ‘s shares continue trading on the country’s Tadawul exchange. Aramco and Abu Dhabi National Oil Company (Adnoc) plan to joint venture with Indian Oil Corp (IOCL), Bharat Petroleum Corp (BPCL) and Hindustan Petroleum Corp (HPCL) in the $70 billion Ratnagiri Refinery and Petrochemicals Ltd project. Ratnagiri project has a capacity to process 1.2 million barrels of crude and produce 18 million tons of petrochemicals annually. Aramco and Adnoc are expected to jointly own 50% of the refinery, with the remainder split between the three Indian oil companies.
Gold slide continues
Gold prices are edging lower today. April gold slid 0.4% ending at 1582.50 an ounce on Monday.
Note: This overview has an informative and tutorial character and is published for free. All the data, included in the overview, are received from public sources, recognized as more or less reliable. Moreover, there is no guarantee that the indicated information is full and precise. Overviews are not updated. The whole information in each overview, including opinion, indicators, charts and anything else, is provided only for familiarization purposes and is not financial advice or а recommendation. The whole text and its any part, as well as the charts cannot be considered as an offer to make a deal with any asset. IFC Markets and its employees under any circumstances are not liable for any action taken by someone else during or after reading the overview.
Bob Moriarty of 321gold discusses a junior explorer that has taken on two major gold properties in Nevada.
In every precious metals cycle there comes a time where a company has good assets but for one reason or another has failed to garner traction and has to pretty much give away projects. That point came for Canarc (CCM-V) last year. They pretty much gave away a high-grade gold project with over a million ounces of gold in a current 43-101 to a junior that was little more than a shell at the time.
In October Canarc announced a binding agreement with Getchell Gold Corp. (GTCH:CSE) for an option on two major gold properties in Nevada. The Fondaway Canyon project is the subject of a 2017 43-101 report by Canarc showing a indicated resource of 6.18 g/t gold for 409,000 ounces as well as an inferred resource of 660,000 ounces at 6.4 g/t Au.
Getchell Gold is paying $4 million in cash and shares over a four year period to get 100% ownership with a small, 2% NSR over the two projects. The 2nd project is called the Dixie Comstock project and shows signs of having some mining activity but there are no reports of production. There was a minor historic resource from a prior owner of the property dating back to 1991 of 146,000 ounces.
There is a $1.45 million work commitment over the same four year period. The company has just completed a $1.65 million financing and is well cashed up. The financing was especially attractive from an investor point of view with the shares at $0.10 with a full warrant at $0.14 that can be accelerated if the shares close above $0.25 for a ten day period. That would bring in an additional $2.3 million to advance the two projects.
At this point the company is a work in progress. It has no skeletons hidden in the closet, the company is too young for that. Management has negotiated an especially attractive deal on a solid pair of projects in one of the most mining friendly jurisdictions in the world. Investors are getting ounces of relatively high-grade gold in Nevada for about $10 an ounce after Getchell has paid for the 100% ownership.
The company is so young that literally now they need to sit down and figure out how to spend the money wisely. Obviously they need to do things that will catch the eye of investors but with a market cap under $7 million CAD, they are pretty cheap. Management has the tools to make this a success, now it’s up to them to deliver.
One of the biggest problems is visibility. The shares pretty much trade by appointment. There is neither pressure to buy nor pressure to sell. The stock is liquid, the company just needs to attract more attention.
I was a shareholder before they did this deal. I participated in the private placement and the company is an advertiser. Do your own due diligence.
The company has done an excellent job of doing a presentation and interested investors should take a gander at it.
Bob Moriarty founded 321gold.com, with his late wife, Barbara Moriarty, more than 16 years ago. They later added 321energy.com to cover oil, natural gas, gasoline, coal, solar, wind and nuclear energy. Both sites feature articles, editorial opinions, pricing figures and updates on current events affecting both sectors. Previously, Moriarty was a Marine F-4B and O-1 pilot with more than 832 missions in Vietnam. He holds 14 international aviation records.
Disclosure: 1) Bob Moriarty: I, or members of my immediate household or family, own shares of the following companies mentioned in this article: Getchell Gold. My company has a financial relationship with the following companies mentioned in this article: Getchell is an advertiser on 321 Gold. I determined which companies would be included in this article based on my research and understanding of the sector. 2) The following companies mentioned are billboard sponsors of Streetwise Reports: None. Click here for important disclosures about sponsor fees. 3) Statements and opinions expressed are the opinions of the author and not of Streetwise Reports or its officers. The author is wholly responsible for the validity of the statements. The author was not paid by Streetwise Reports for this article. Streetwise Reports was not paid by the author to publish or syndicate this article. The information provided above is for informational purposes only and is not a recommendation to buy or sell any security. Streetwise Reports requires contributing authors to disclose any shareholdings in, or economic relationships with, companies that they write about. Streetwise Reports relies upon the authors to accurately provide this information and Streetwise Reports has no means of verifying its accuracy. 4) The article does not constitute investment advice. Each reader is encouraged to consult with his or her individual financial professional and any action a reader takes as a result of information presented here is his or her own responsibility. By opening this page, each reader accepts and agrees to Streetwise Reports’ terms of use and full legal disclaimer. This article is not a solicitation for investment. Streetwise Reports does not render general or specific investment advice and the information on Streetwise Reports should not be considered a recommendation to buy or sell any security. Streetwise Reports does not endorse or recommend the business, products, services or securities of any company mentioned on Streetwise Reports. 5) From time to time, Streetwise Reports LLC and its directors, officers, employees or members of their families, as well as persons interviewed for articles and interviews on the site, may have a long or short position in securities mentioned. Directors, officers, employees or members of their immediate families are prohibited from making purchases and/or sales of those securities in the open market or otherwise from the time of the interview or the decision to write an article until three business days after the publication of the interview or article. The foregoing prohibition does not apply to articles that in substance only restate previously published company releases. As of the date of this article, officers and/or employees of Streetwise Reports LLC (including members of their household) own securities of Getchell Gold, a company mentioned in this article.
The emerging coronavirus pandemic is already crimping global commerce. In response, the S&P 500 has thus far put in two weeks’ worth of declines (the index fell 2.1% last week) since making new highs to start the year.
Even though the U.S. stock market hasn’t even entered a true “correction” phase yet, Wall Street is already clamoring for more Fed stimulus.
Mainstream stock market mavens figure the central bank will step in to limit downside – and they are probably right.
Following the Federal Open Market Committee’s decision on Wednesday to keep rates unchanged, Fed Chairman Jerome Powell said he is “carefully monitoring the situation” with regard to the Chinese virus.
It is hitting inflation-sensitive commodities copper and crude oil especially hard. Oil prices dipped 5% last week while copper plunged more than 6%.
Powell is vowing to push the inflation up to a “symmetric” target of 2% – which in practice means pushing it above 2% for a sustained period to counteract the prolonged period of sub-2% inflation (at least officially).
Last Friday’s U.S. inflation data showed the central bank’s preferred “core” rate running at 1.6% as of December.
The Fed now appears likely to re-embark on a rate-cutting campaign in the months ahead. Meanwhile, it continues to pump liquidity into the Treasury bill and repo markets.
Last week, the Federal Reserve Bank of New York pushed another $83 billion into short-term lending facilities.
In China, central bankers are hitting the panic button and pulling out their monetary bazookas.
As the Associated Pressreported on Sunday, “China’s central bank announced plans Sunday to inject 1.2 trillion yuan ($173 billion) into the economy to cushion the shock to financial markets from the outbreak of a new virus when trading resumes on Monday.”
It added, “Chinese authorities have massive resources for intervening to staunch panic selling of shares and have deployed them in past times of crisis.”
The same could be said of U.S. authorities. Treasury Secretary Steven Mnuchin convened the “Plunge Protection Team” during Christmas week 2018 to stop the bleeding in the stock market. It has been upward and onward since… owing also to more recent support from the Fed’s rate cuts and balance sheet expansion programs.
Ongoing official back-stopping has made investors more complacent than ever. But the interventions haven’t stopped gold from rising.
Last week, gold quietly posted its highest closing price since 2013. Yes, gold is in a bull market even though virtually nobody in the mainstream financial media is talking about it.
The media will take notice when gold makes a new all-time record high – which could come later this year it keeps up its current rate of ascent.
The biggest beneficiary of that attention could be silver – the poor man’s gold, the metal the masses will turn to as they seek inflation protection.
The silver market is like a coiled spring. It has been depressed for many years. When it finally does break out, it is poised to jump in a very big way.
The Money Metals News Service provides market news and crisp commentary for investors following the precious metals markets.
An operations update on one of the company’s projects is provided in an Echelon Wealth Partners report.
In a Jan. 28 research note, analyst Ryan Walker reported that Echelon Wealth Partners raised its target price on Pure Gold Mining Inc. (PGM:TSX.V; PUR:LSE) to CA$1.35 per share from CA$1 after updating gold price and forex assumptions in its model on the company. The company’s shares are currently trading at around CA$0.82 per share.
Walker discussed Pure Gold’s latest news, which were announcements regarding new drill results and underground development, both at its Red Lake mine in Ontario.
Drill results from infill and stepout drilling near the development and ore zones expected to provide initial mill feed in 2020 were “positive” and indicated “strong mine continuity and the potential for mining stope expansion,” Walker noted. Because holes PG19-714, PG19-716, PG19-717 and PG19-722 were stepouts of 418 meters from existing mining shapes, they represent potential new zones of mineralization for integration into the mine plan in the near term.
As for specific assays, hole PG19-714 returned 2 meters (2m) of 6.1 grams per ton (6.1 g/t) gold, 1m at 7 g/t gold and 1.5m at 5.6 g/t gold. Hole PG19-716 demonstrated 1m of 10.6 g/t gold. Hole PG19-717 showed 2m at 8.9 g/t gold and 0.9m of 8.2 g/t gold. Hole PG19-722 intersected 1m of 13.2 g/t gold.
Other new drill results could be added to the mine plan, Ryan stated. They include those from PG19-719, which yielded 79.4 g/t gold over 1.4m and suggested the presence of a new Hanging Wall zone. PG19-735 returned 6.3m of 13.2g/t gold at just over 50m away from the current mine plan.
As for the underground development at the Red Lake mine, Pure Gold started it early, it is progressing well and is about four months ahead of the feasibility study schedule, Ryan stated. The company started acquiring and installing major infrastructure for mine operations, including new compressors and ventilation systems. About $6.1 million worth of purchased equipment is now at the property. Mine de-watering, which is in progress, already lowered the water level to about 240m below surface. Also underway is the hauling of stockpiled test mining material to surface. First gold pour is slated for Q4/20.
Walker commented, “We continue to highlight the mine’s high-grade nature, potential for solid near-term, high-margin production and substantial exploration potential, all situated in a prolific Canadian mining camp (recently part of ongoing sector mergers and acquisitions activity Evolution Mining’s acquisition of the nearby Red Lake Mine).”
Disclosure: 1) Doresa Banning compiled this article for Streetwise Reports LLC and provides services to Streetwise Reports as an independent contractor. She or members of her household own securities of the following companies mentioned in the article: None. She or members of her household are paid by the following companies mentioned in this article: None. 2) The following companies mentioned in this article are billboard sponsors of Streetwise Reports: None. Click here for important disclosures about sponsor fees. 3) Comments and opinions expressed are those of the specific experts and not of Streetwise Reports or its officers. The information provided above is for informational purposes only and is not a recommendation to buy or sell any security. 4) The article does not constitute investment advice. Each reader is encouraged to consult with his or her individual financial professional and any action a reader takes as a result of information presented here is his or her own responsibility. By opening this page, each reader accepts and agrees to Streetwise Reports’ terms of use and full legal disclaimer. This article is not a solicitation for investment. Streetwise Reports does not render general or specific investment advice and the information on Streetwise Reports should not be considered a recommendation to buy or sell any security. Streetwise Reports does not endorse or recommend the business, products, services or securities of any company mentioned on Streetwise Reports. 5) From time to time, Streetwise Reports LLC and its directors, officers, employees or members of their families, as well as persons interviewed for articles and interviews on the site, may have a long or short position in securities mentioned. Directors, officers, employees or members of their immediate families are prohibited from making purchases and/or sales of those securities in the open market or otherwise from the time of the interview or the decision to write an article until three business days after the publication of the interview or article. The foregoing prohibition does not apply to articles that in substance only restate previously published company releases.
Disclosures from Echelon Wealth Partners, Pure Gold Mining Inc., January 28, 2020
Echelon Wealth Partners compensates its Research Analysts from a variety of sources. The Research Department is a cost centre and is funded by the business activities of Echelon Wealth Partners including, Institutional Equity Sales and Trading, Retail Sales and Corporate and Investment Banking.
I, Ryan Walker, hereby certify that the views expressed in this report accurately reflect my personal views about the subject securities or issuers. I also certify that I have not, am not, and will not receive, directly or indirectly, compensation in exchange for expressing the specific recommendations or views in this report.
Important Disclosures: Is this an issuer related or industry related publication? Issuer.
Does the Analyst or any member of the Analysts household have a financial interest in the securities of the subject issuer? No
The name of any partner, director, officer, employee or agent of the Dealer Member who is an officer, director or employee of the issuer, or who serves in any advisory capacity to the issuer. No
Does Echelon Wealth Partners Inc. or the Analyst have any actual material conflicts of interest with the issuer? No
Does Echelon Wealth Partners Inc. and/or one or more entities affiliated with Echelon Wealth Partners Inc. beneficially own common shares (or any other class of common equity securities) of this issuer which constitutes more than 1% of the presently issued and outstanding shares of the issuer? No
During the last 12 months, has Echelon Wealth Partners Inc. provided financial advice to and/or, either on its own or as a syndicate member, participated in a public offering, or private placement of securities of this issuer? No
During the last 12 months, has Echelon Wealth Partners Inc. received compensation for having provided investment banking or related services to this Issuer? No
Has the Analyst had an onsite visit with the Issuer within the last 12 months? No
Has the Analyst or any Partner, Director or Officer been compensated for travel expenses incurred as a result of an onsite visit with the Issuer within the last 12 months? No
Has the Analyst received any compensation from the subject company in the past 12 months? No
Is Echelon Wealth Partners Inc. a market maker in the issuers securities at the date of this report? No
So far this year, the AUD has been on the backfoot, retreating compared to most other currencies.
There are several reasons, as usual. Some of them are completely unexpected (coronavirus) while others were projected ahead of the last RBA meeting. Now the question is how far that trend will continue.
The next step is coming up tomorrow. The RBA is meeting for the first time this year to set its monetary policy.
A rate cut would likely continue that descending trend, on the back of disappointing economic performance and worries that what green shoots there are, won’t last. But, what are the chances of that happening?
What We Are Expecting
The latest survey of international economists shows that three-quarters of them are expecting the RBA to hold rates. That’s a pretty strong consensus! But, when only Australian economists are polled, the confidence goes up to 87%.
In fact, the market has been pricing in a rate hold all last week. The balance is showing just a 14% chance of a rate cut as we emerge from the weekend. The rationale is that the central bank is happy with the latest employment data, and doesn’t want to rock the boat yet.
With the markets pricing in the RBA keeping everything on hold, the rate decision itself is likely to not move the market much. That is, of course, unless there is a surprise.
Apparently, that would also surprise Governor Lowe, since no post-policy-change press release is scheduled.
All Hail the Rhetoric
What’s likely to influence the market the most is the rate statement that comes out at the same time as the decision.
Traders are going to want to know if there are any changes in outlook. The market is likely to be reassured if the statement repeats three important ideas:
That interest rates will stay low for an “extremely long time”
That unconventional measures are not necessary, and traditional policy is “working”
That the RBA is “assessing growth momentum”
It’s not likely the first will change, but potential changes in wording that might move the markets include that:
Conventional measures are being considered or might be necessary
The RBA is considering policy changes, instead of simply assessing momentum, or potentially giving a parameter for what they consider sufficient growth
The markets would likely interpret both of those changes as dovish. And this would likely weaken the AUD.
On the other hand, if everything remains the same, it puts off for a month the potential of RBA-driven weakness in the AUD and could provide some support.
Going Forward
Analyst evaluations remain the same. They conclude that a rate cut by the RBA is likely in the first quarter of the year, but that it won’t happen until the next meeting at the earliest.
In that respect, Thursday’s Retail Sales might have more weight on the direction of the currency, since the market is likely waiting until after the meeting to price in the expectations for that data.