5 Things The Headlines Won’t Tell You About Coronavirus

By Orbex

The outbreak of the novel coronavirus has dominated the headlines so far this year.

Every day, we seem to be waking up to a rising number of reported cases, a climbing death toll, and a new global health authority declaring a state of emergency.

However, it’s very important that we don’t get lost in buzzwords and statistics and that we read between the headlines to approach the issue with logic, responsibility, and most importantly, compassion.

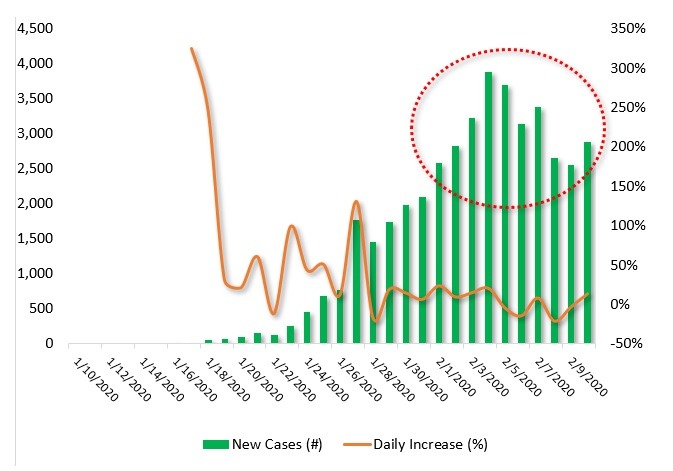
As of writing, there have been 43,090 cases reported worldwide, with the death toll at 1,016 in mainland China, and 1 death each in Hong Kong and the Philippines. Nearly 4,000 patients have been cured and discharged in China.

So, with that in mind, here are the 5 main things you need to remember when talking about the coronavirus.

1. Coronavirus symptoms vary from mild to severe

While the virus has tragically claimed the lives of a significant amount of people, symptoms can vary from patient to patient. Contracting the illness does not necessarily mean that it is terminal.

Symptoms can resemble those of the common cold, including fever, cough and difficulty breathing, and range to more serious symptoms such as pneumonia, severe acute respiratory syndrome and kidney failure.

2. A global health emergency is typically declared to help protect us

The WHO has indeed declared a public health emergency due to the coronavirus, as it has previously done for the Swine Flu in 2009, Polio in 2014, Zika in 2016, and Ebola in 2014 and 2019.

However, the word “emergency” shouldn’t scare you.

All it means is that a procedure is being implemented in order to open communication lines between countries and make available the funds needed to tackle the situation.

This is to ensure that the proper measures are being taken to contain the disease and that all the relevant medical, travel and public authorities are working together to achieve that goal.

This is also done to protect countries that are less equipped to handle a potential viral outbreak.

3. Take precautions, but don’t panic

We can’t control how viruses come about, nor how they spread. But what we can do is follow the basic hygiene steps recommended by the WHO and the CDC to protect ourselves from potential illness.

These include regularly washing and disinfecting your hands, covering your mouth and nose when sneezing or coughing, thoroughly cooking your meat and eggs and avoiding close contact with anyone showing symptoms.

4. Get your information exclusively from reputable sources

Even as you read this article now, remember that the only reliable pieces of information regarding this virus come from the globally recognized agencies and authorities specialized in world public health.

So, for your research and reference, please consult the World Health Organization and the Centers for Disease Control to get accurate and up to date information.

5. Remember the people

It’s easy to forget that there are human lives behind the statistics.

It’s not just those who have contracted the virus, it’s their families; it’s the healthcare professionals who are putting themselves at risk; the millions of people on lockdown to ensure the containment of the virus, and the medical staff who are tirelessly working on a cure.

So, while you should keep your distance from those showing symptoms, please remember to treat people with the compassion and respect they deserve, and to keep in your heart those who have fallen victim to the virus.

By Orbex


UK Data Beat Boosts GBP

By Orbex

USD Rally Capped For Now

The US dollar has softened a little over early trading on Tuesday as the rally in equities has taken some of the steam out of the greenback’s recent rally. The US data sheet remains quiet until Thursday and Friday when we get CPI and Retail Sales respectively. If these readings continue the recent strength in US indicators, this could fuel fresh buying in USD. The index trades 98.71 last.

Fresh EU Fears For EUR

EURUSD has been a little firmer today with the Euro benefiting from weakness in USD. However, the move is very shallow and the outlook remains bearish for EUR. The results of the 2020 Irish general election have raised fears of further fracturing of the EU given the win for Irish unity party Sinn Fein. EURUSD trades 1.0912 last.

GBP Rallies in Better Data

GBPUSD has been higher today with price rallying to 1.2931 last on the back of stronger than expected UK data this morning. UK GDP was seen rising 0.3% over last month, beating expectations of a 0.2% reading and marking a firm recovery from the prior month’s -0.3% reading.

Risk Markets Soften Following Earlier Rally

Risk assets have softened a little over the European morning though remain supported on the back of yesterday’s rally. A stronger than expected Chinese CPI reading has helped lift risk sentiment some, though uncertainty over the ongoing coronavirus is limiting gains. The SPX500 is now retesting the 3358.86 level, which is holding as support for now.

Mixed Day For JPY & Gold

Safe havens have had a mixed start to the day on Tuesday with the Japanese Yen rising against USD while gold falls back. Yesterday’s rally in equities has seen a weaker flow of safe-haven buying, despite the ongoing risks from coronavirus. USDJPY trades 109.85 last, with price sitting just off the week’s 110 highs. XAUUSD trades 1569.35 last, as price continues to recover off the 1555.38 level support.

Crude Rallying Again

Oil prices are rallying so far today with crude benefiting from slightly better risk appetite over the last 24 hours. If equities prices can find their feet again today and continue the rally, crude is likely to recover further. Later today, the API crude report will be the key data focus ahead of tomorrow’s EIA release. Crude trades 50.48 last.

Loonie Capped By 1.33

USDCAD has been a little firmer today though price remains back below the 1.33 level, having broken above the level earlier in the week before reversing. The rally in crude prices has helped CAD recover over recent sessions, though broad USD strength has stemmed the declines. USDCAD trades 1.3297 last.

Aussie Holding Above .6709

AUDUSD has been a little lower today also, correcting in line with this morning’s weakness in risk markets. However, if equities can start to rally again today, AUD could continue to build above the .6682 level support. AUDUSD trades .6709 last.

By Orbex


2020 – A Close Look At What To Expect

By TheTechnicalTraders.com

Quite a bit has changed in the global markets and future expectations over the past 4+ weeks.  Q4 2019 ended with a bang.  US/China Trade Deal, US signing the USMCA Continental Free Trade Agreement, BREXIT and now the Wuhan Virus.  On top of all of that, we’ve learned that Germany and Japan have entered a technical recession.  As Q4-2019 earnings continue to push the US stock market higher – what should traders expect going forward in 2020?

Volatility, Sector Rotation, and Continued US Stock Market Strength.

Our researchers have been pouring over our charts and predictive modeling tools to attempt to identify any signs of weakness or major price rotation.  There are early warning signs that the US Stock Market may be setting up for a moderate downside price rotation within the first 6 months of 2020, but we believe the continued Capital Shift that has been taking place over the past 24+ months will continue to drive foreign investment into the US and North American stock markets for quite a while in 2020 and 2021.

The interesting component to all of this, which should keep investor’s attention and really get them excited, is the chance that some type of foreign market disruption may take place in 2020 and 2021.  There are a number of things that could potentially disrupt foreign market expectations.

First on the list is this virus event in China (that seems to be spreading rapidly).  Second would be the news that Japan and Germany have entered a recession.  Further down the list is the very real possibility that many Asian and foreign nations could see a dramatic decrease in GDP and economic activity throughout much of 2020 and 2021.

It is far too early to make any real predictions, but traders need to be aware of the longer-term consequences of global markets entering a contraction phase related to a confluence of events that prompts central bank intervention while consumers, financial sectors and manufacturing and industrial sectors are pummeled.  Imagine what the global markets would look like if 25% to 55% of Asia, Europe, and Africa see a dramatic decrease in economic output, GDP and financial sector activities (on top of the potential for massive loan defaults).  It may spark another Credit Crisis Event – this time throughout the Emerging and Foreign markets.

A massive surge in US stock market valuation has taken place since the start of 2020.  It is very likely that foreign capital poured into the US stock market expecting continued price advancement and very strong earnings from Q4 2019.  This valuation appreciation really started to take place in early 2019 and continued throughout the past 14+ months.  We believe this valuation appreciation is foreign capital dumping into the US markets to chasing the strong US economic expectations.

We believe this surge into the US stock markets will continue until something changes future expectations.  The US Presidential election cycle would usually be enough to cause some sideways trading in the US stock market – maybe not this time.

The fact that Japan and Germany, as well as China very soon, have entered an economic recession would usually be enough to cause some sideways price rotation in the US stock market – maybe not this time.  The potential wide-spread economic contraction related to the Wuhan virus would normally be enough to cause some contraction or sideways trading in the US stock market – maybe not this time.

There is still a risk that price could revert to middle or lower price channel levels at any time in the future.  We’ve highlighted these levels on the charts below.  Yet, we have to caution traders that the foreign markets may be setting up for one of the largest capital shift events in recent history.  If any of these contagion events roil the foreign markets while the US economic activity and data continue to perform well, then we could be setting up for a massive shift away from risky foreign markets/emerging markets and watch global capital pour into Safe-Havens (metals/miners) and pour into the US stock market (US, Canada, Mexico).

We’ve authored numerous articles about how the foreign markets gorged themselves on debt after 2009 while easy money policies allowed them to borrow US dollars very cheaply.  We’ve highlighted how this debt is now hanging over these corporations, manufacturers and investors heads as a liability.  The recent REPO market activity suggests liquidity risks already exist in the global markets.  If these liquidity issues extend further, we could see a much broader market rotation within the US and foreign markets.

Dow Jones Industrial Average – Quarterly Chart

Currently, the US stock market appears to be near the upper range of a defined price channel.  Near these levels, it is not uncommon to see some downside price rotation to set up a new price advance within the price channels.  This INDU chart highlights the extended price channel trend, originating from 2008, and the more recent price channel (yellow) originating from 2015.  Any breakdown of these channels could prompt a much broader downside price move.

S&P 500 – Quarterly Chart

This SPY chart highlights the extended upside price trend in the US stock markets.  The SPY has recently breached the upper price channel level.  It may be setting up a new faster price channel, yet we believe this rally in early Q1 2020 is more of a reaction to the very strong 2019 US economic data and the continued capital shift pouring capital into the US markets.  A correction from these levels to near $275 would not be out of the question.

Transportation Sector – Quarterly Chart

This Transportation Index (TRAN) chart presents a very clear price channel and shows a moderate weakness recently in this sector.  The fact that the TRAN has consolidated into a middle range of the price channel while the other US stock market indexes continue to push higher suggests the valuation advance in the US stock market is mostly “capital chasing strength of the US economy” than a true economic expansion event.

2020 will likely continue to see more volatility, more price rotation, more US stock market strength and further risks of a reversion event.  We believe forward guidance for Q1 and Q2 will be revised lower as a result of these new global economic conditions originating from Asia, Europe, and Japan.

If the virus event spreads into Africa and the Middle East (think Belt-Road), then we could see a much broader correction event.  In the meantime, prepare for weaker future earnings related to the shut down of industry and consumer sectors throughout much of Asia.

If this “shut down” type of quarantining process extends throughout other areas of the world, then we need to start to expect a much broader economic contraction event.  Minor events can be absorbed by the broader markets.  Major events where global economies contract for many months or quarters can present a very dangerous event for investors.

Overall, we may see another 20 to 40+ days of “sliding higher” in the US stock market before we see any real risks become present for investors.  This means you should start preparing for any potential unknowns right now.  Plan accordingly as this event will likely result in a sudden and potentially violent change in price trend.

Join my Swing Trading ETF Wealth Building Newsletter if you like what you read here and ride my coattails as I navigate these financial markets and build wealth while others lose nearly everything they own.

Chris Vermeulen
TheTechnicalTraders.com

NOTICE: Our free research does not constitute a trade recommendation or solicitation for our readers to take any action regarding this research.  It is provided for educational purposes only.  Our research team produces these research articles to share information with our followers/readers in an effort to try to keep you well informed.  Visit our web site (www.thetechnicaltraders.com) to learn how to take advantage of our members-only research and trading signals.


China Inflation Rises On Coronavirus

By Orbex

The latest inflation report from China showed a strong gain in consumer prices. The gains were driven by demand on account of the coronavirus as well as the Chinese lunar new year.

China’s inflation rose 5.4% on the year in January 2020. This was the highest level in CPI, in over eight years, since October 2011.

Sentix Investor Confidence Slips in February

The eurozone’s investor confidence, as measured by Sentix, fell slightly from 7.6 to 5.2 in February. The declines came as investors fear the ramifications of the coronavirus outbreak.

Although the reported cases in Europe have been low, investors are weighing the larger impact in terms of trade with China. In a separate report, Italy’s industrial production was down 2.7% following a 0.1% increase previously.

No Respite for the EURUSD

The common currency continues its bearish trend with no signs of a respite. The EURUSD is posting fresh 2020 lows as it fails to beat a stronger dollar.

With the current trend, the common currency is on track to test the lower support at 1.0897. This marks a retest of the early October 2019 lows.

USD Strengthens Ahead of Powell Speech

The US dollar continues to maintain its grip strengthened by Friday’s payrolls report. Amid a quiet trading day, investors look to big events this week which include the Fed Chair’s testimony to Congress.

GBPUSD Attempts to Retrace Losses

Cable is posting a retracement following the declines from last week. However, price action looks bearish below the support/resistance level of 1.2960.

With the Stochastics slightly moving up from the oversold levels, a renewed selling pressure could push the GBP lower. The main downside target is at 1.2582.

Gold Prices Stall Following 3 Days of Gains

The precious metal was trading flat on Monday after posting three days of gains from the week before.

Gold traders are likely to stay on the sidelines, waiting for more fundamental cues. Later in the week, US inflation and retail sales numbers are due.

XAUUSD Holds Steady at Resistance

The precious metal made strong gains and held on to them on Monday. Price action is trading near the resistance level of the 1573 – 1569 region. This keeps the bias mixed.

An upside momentum could see gold retesting recent pivot highs of 1590. To the downside, a correction could push XAUUSD to the early February lows of 1548.50.

By Orbex


Ichimoku Cloud Analysis 11.02.2020 (AUDUSD, NZDUSD, USDCAD)

Article By RoboForex.com

AUDUSD, “Australian Dollar vs US Dollar”

AUDUSD is trading at 0.6716; the instrument is moving below Ichimoku Cloud, thus indicating a descending tendency. The markets could indicate that the price may test the cloud’s downside border at 0.6720 and then resume moving downwards to reach 0.6555. Another signal to confirm further descending movement is the price’s rebounding from the descending channel’s upside border. However, the scenario that implies further decline may be canceled if the price breaks the cloud’s upside border and fixes above 0.6775. In this case, the pair may continue growing towards 0.6845. After breaking the support area and fixing below 0.6655, the price may resume moving downwards. As we can see in the daily chart, the instrument is rebounding from this level for the fourth time.

AUDUSD
Risk Warning: the result of previous trading operations do not guarantee the same results in the future

NZDUSD, “New Zealand Dollar vs US Dollar”

NZDUSD is trading at 0.6394; the instrument is moving below Ichimoku Cloud, thus indicating a descending tendency. The markets could indicate that the price may test the cloud’s downside border at 0.6455 and then resume moving downwards to reach 0.6245. Another signal to confirm further descending movement is the price’s rebounding from the descending channel’s upside border. However, the scenario that implies further decline may be canceled if the price breaks the cloud’s upside border and fixes above 0.6520. In this case, the pair may continue growing towards 0.6605.

NZDUSD
Risk Warning: the result of previous trading operations do not guarantee the same results in the future

USDCAD, “US Dollar vs Canadian Dollar”

USDCAD is trading at 1.3296; the instrument is moving above Ichimoku Cloud, thus indicating an ascending tendency. The markets could indicate that the price may test the cloud’s downside border at 1.3255 and then resume moving upwards to reach 1.3445. Another signal to confirm further ascending movement is the price’s rebounding from the rising channel’s downside border. However, the scenario that implies further growth may be canceled if the price breaks the cloud’s downside border and fixes below 1.3195. In this case, the pair may continue falling towards 1.3105 and form Inverted Head & Shoulders pattern and completed its right Shoulder at 1.3050. Still, if the instrument breaks 1.3365, pattern will be no longer valid and the price may resume moving upwards.

USDCAD

Article By RoboForex.com

Attention!
Forecasts presented in this section only reflect the author’s private opinion and should not be considered as guidance for trading. RoboForex LP bears no responsibility for trading results based on trading recommendations described in these analytical reviews.

Toward Virus Crossroads?

By Dan Steinbock     

In the coming days, new confirmed cases of the virus outbreak will continue to rise. Nevertheless, there may be some possible signs of steadying in China.

With the new coronavirus – the 2019 novel coronavirus acute respiratory disease (2019-nCoV ARD) – there are now (8 pm Wuhan time, Feb 10) over 42,600 confirmed cases worldwide. If the current pace prevails, that figure will soon exceed 50,000.

And yet, there is something else going on behind the reported figures, something that may allow a sense of cautious optimism about the future.

Toward potential crossroads

Despite international concern and more sensational headlines, the number of the confirmed cases outside China has been relatively low, less than 500. So far there have been only two deaths outside China; one in Hong Kong and another in the Philippines. Both are associated with Wuhan, the epicenter of the outbreak.

While these numbers are likely to increase in the near future, the low starting-point suggests that China’s costly and draconian measures may have saved many lives within and outside China.

Moreover, the pace of the contagion may be changing. In the international media, the spotlight has been mainly on the absolute numbers of accumulated confirmed cases and accumulated deaths. Consequently, the relative increase of the cases has been on the sidelines.

Certainly, both sets of figures have a vital role. In absolute terms, accumulated cases reflect the human toll of the outbreak in which even a single number is a tragedy. Yet, relative terms are critical because they reflect the pace of the virus outbreak.

Although the absolute number of the confirmed cases and deaths is likely to climb for a while longer, the absolute number of the new cases and their daily increase may be decelerating.

In retrospect, the number of accumulated cases began to soar around the third week of January. In part, this can be attributed to the virus outbreak itself and in part to China’s stringent containment measures. On January 24, the confirmed cases exceeded 1,000; a week later, the figure jumped over 10,000; another week later, over 30,000. Unfortunately, the accumulated number will still continue to rise.

Nevertheless, the relative increase of these accumulated cases has progressively decreased ever since mid-January. Toward the end of the month, the rate accelerated briefly, perhaps as the result of the tough quarantine measures in China. While the pace peaked at almost 100% after mid-January, it has declined to zero, even negative (Figure 1).

Figure 1 Accumulated Confirmed Cases, Jan 10 to Feb 10, 2020

Source: DifferenceGroup. Data from China’s National Health Commission

Potential deceleration

Even more importantly, the relative daily increase of new cases, which have critical impact on the longer-term duration and severity of the outbreak, may be amid a crossroads.

The confirmed new cases increased steadily from mid-January soaring to almost 3,900 on February 4. Since then the numbers have fallen below 2,600. In relative terms, the change has been almost progressive, having plunged from almost 350% to negative (Figure 2).

Figure 2 Confirmed New Cases, Jan 10 to Feb 10, 2020

Source: DifferenceGroup. Data from China’s National Health Commission;

While the data could indicate a possible turnaround in the virus outbreak, there is no assurance that the deceleration will prevail. It is well known that virus trend lines can zigzag. Consequently, complacency in the struggle against the outbreak is no option.

There are other caveats as well. Right data is critical. The assumption is that the number of the confirmed cases is relatively realistic.  Furthermore, there is the risk of potential mutation. Current statistics are based on the assumption that the crisis will not result in adverse mutations that would drastically change the outcomes. Finally, the trend is predicated on the idea that containment will succeed outside China, where precautions have been lagging in many countries, including high-income nations.

As WHO chief Tedros Adhanom Ghebreyesus has warned, confirmed cases of coronavirus being transmitted by people who have never traveled to China could be the “tip of the iceberg.”

The big question is, will the deceleration trend remain and strengthen.

 About the Author:

Dr. Dan Steinbock is an internationally recognized strategist of the multipolar world and the founder of Difference Group. He has served at the India, China and America Institute (USA), Shanghai Institutes for International Studies (China) and the EU Center (Singapore). For more, see https://www.differencegroup.net

The original commentary was released by China Daily on Feb. 10, 2020. The data has been updated (Feb 11, 2020)


Japanese Candlesticks Analysis 11.02.2020 (GOLD, NZDUSD)

Article By RoboForex.com

XAUUSD, “Gold vs US Dollar”

As we can see in the H4 chart, the ascending tendency continues. By now, XAUUSD has completed several reversal patterns, such as Hammer, near the channel’s downside border. At the moment, the pair is still reversing. After finishing the correction, the price may resume growing to reach the upside target at 1588.00. However, one shouldn’t ignore another scenario, according to which the instrument may break the support level and continue falling towards 1555.00.

GOLD
Risk Warning: the result of previous trading operations do not guarantee the same results in the future

NZDUSD

As we can see in the H4 chart, the pair is still testing the support level, where it has formed several reversal patterns, including Hammer. At the moment, NZDUSD is expected to reverse; the closest upside target may be at 0.6455. After that, the market may resume its descending tendency. At the same time, one shouldn’t exclude an opposite scenario, according to which the instrument may fall to reach 0.6425 and continue forming the descending channel without reversing.

NZDUSD

Article By RoboForex.com

Attention!
Forecasts presented in this section only reflect the author’s private opinion and should not be considered as guidance for trading. RoboForex LP bears no responsibility for trading results based on trading recommendations described in these analytical reviews.

Technical and Market Analysis for CFD Traders

Arguably one of the trickiest elements to building and maintaining a profitable CFD trading account is generating fresh trading signals and opportunities in the markets. While finding profitable trades might not sound too difficult, it is in itself the single most time consuming element of financial trading, and one of the most crucial in ensuring traders are able to generate a return on their capital. In order to find viable opportunities, traders are required to research and read extensively to spot the metaphorical needle in the market haystack. One key element of researching opportunities effectively is technical and market analysis, which when accompanied by research and an understanding of market affairs gives traders the best insights into where profits can be found.

What Is Technical Analysis?

Technical analysis is the process of analysing market data, namely price movements and trends, in order to establish which positions present an opportunity for profit. Technical analysis is often conducted through charting tools and applications, which make it easier as a visual exercise to identify the data required to make trading decisions.

Traders are often put off by the apparent complexity of technical analysis as a process, and the presentation of graphs, charts and a lot of different coloured numbers can be understandably daunting. Fortunately a number of trading strategies rely heavily (or exclusively) on technical analysis, meaning those traders that expect to succeed will be confronted with the unavoidable need to consult technical data as part of implementing new trading techniques and strategies. So what is it about technical analysis that you should concern yourself with as a CFD trader, and what’s the importance and value in analysing market trading data?

What You’re Looking For

In a word, technical analysis is all about trends. Current trends, past trends, future trends – knowing which way market momentum is likely to shift is ultimately what analysing technical data is all about, and through charting applications which present this raw information in an effective, visual way, traders can gain invaluable insights into the mood of the markets in relation to the positions they intend or expect to trade. When analysing technical data, look for emerging trends, which may differ over different time frames, and examine the pricing levels in relation to identifiable positive and negative market forces. While this won’t usually be sign-posted, knowing what you’re looking for and taking the time to understand what it means is half the battle when it comes to generating new trading signals.

Why It’s Important?

Markets don’t quite operate in a vacuum, but they can and do have a mind of their own. News that one man might interpret as positive may be seen as unsettling to another, and there are simply so many different variables involved in markets making decisions about asset pricing that to trade without recourse to technical analysis is much more like guess-work. Technical analysis is an important means of validating external trading prompts, and identifying trends and trading opportunities that may not otherwise be obvious to the trader. Only by studying and interpreting this kind of data can traders hope to make the levels of decision-making required to be successful.

Technical analysis should be considered a friend rather than a foe, and getting to grips with how it works and what it can show is an important step in learning how to become successful with CFDs. While approaching technical and market analysis might seem daunting to the inexperienced, it performs an essential role in helping find market opportunities for traders to explore, and underpins most successful trading strategies in some way or another. As such, it’s recommended traders get up to speed with technical and chart analysis as soon as possible in order to leverage the most from market opportunities.

Article by Jim Moor

Fed Chairman Powell’s Speech Is in the Focus of Attention

Article By RoboForex.com

During yesterday’s trading, the US dollar strengthened slightly against a basket of major currencies. The dollar index (#DX) closed in the green zone (+0.18%). Today, investors will be focused on the report by the US Fed Chairman Jerome Powell in Congress.

The euro fell to key lows against the US dollar. The Eurozone economy, as well as the global economy as a whole, are under pressure due to the spread of coronavirus. Yesterday, the World Health Organization (WHO) warned that the spread of cases among people who were not in China could be a “spark that becomes a bigger fire.” According to recent data, the number of cases of the virus has already exceeded 42,500 people, 1,016 deaths.

The “black gold” prices have been growing. Currently, futures for the WTI crude oil are testing the $50.30 mark per barrel.

Market Indicators

Yesterday, there was the bullish sentiment in the US stock market: #SPY (+0.75%), #DIA (+0.60%), #QQQ (+1.21%).

The 10-year US government bonds yield increased slightly. At the moment, the indicator is at the level of 1.59-1.60%.

The Economic News Feed for 11.02.2020:
  • – UK GDP data at 11:30 (GMT+2:00);
  • – Manufacturing production in the UK at 11:30 (GMT+2:00);
  • – JOLTS job openings in the US at 17:00 (GMT+2:00).


We also recommend paying attention to the speech by Fed Chairman Powell.

Article By RoboForex.com

Attention!
Forecasts presented in this section only reflect the author’s private opinion and should not be considered as guidance for trading. RoboForex LP bears no responsibility for trading results based on trading recommendations described in these analytical reviews.

The Analytical Overview of the Main Currency Pairs on 2020.02.11

by JustForex

The EUR/USD currency pair

Technical indicators of the currency pair:
  • Prev Open: 1.09412
  • Open: 1.09107
  • % chg. over the last day: -0.36
  • Day’s range: 1.09080 – 1.09171
  • 52 wk range: 1.0879 – 1.1572

EUR/USD quotes continue to show negative dynamics. The single currency has set new local lows again. Demand for the U.S. dollar remains at a high level. At the moment, the trading instrument is consolidating. The key support and resistance levels are 1.09000 and 1.09400, respectively. Technical correction of the EUR/USD currency pair is not excluded in the nearest future. Positions should be opened from key levels.

Today we recommend paying attention to the speeches of the head of ECB and FOMC representatives.

EUR/USD

The indicators signal the sellers’ strength: the price has fixed below 50 MA and 100 MA.

MACD histogram is in the negative zone, but above the signal line, which gives a weak signal to sell EUR/USD.

The Stochastic Oscillator is in the neutral zone, the %K line is below the %D line, which indicates that the sentiment is bearish.

Trading recommendations
  • Support levels: 1.09000, 1.08700
  • Resistance levels: 1.09400, 1.09700, 1.09900

If the price fixes below the round level of 1.09000, expect a drop toward 1.08700-1.08600.

Alternatively, the quotes could grow toward 1.09700-1.09900.

The GBP/USD currency pair

Technical indicators of the currency pair:
  • Prev Open: 1.28839
  • Open: 1.29148
  • % chg. over the last day: +0.20
  • Day’s range: 1.29074 – 1.29217
  • 52 wk range: 1.1959 – 1.3516

The GBP/USD currency pair has stabilized. Sterling is consolidating at the moment. The key support and resistance levels are: 1.28750 and 1.29250, respectively. Technical correction of the trading instrument is not ruled out in the nearest future. The participants of financial markets took a waiting position before the release of important statistical data on the UK economy. Positions should be opened from key levels.

The Economic News Feed for 11.02.2020:

  • – UK GDP Report (GB) – 11:30 (GMT+2:00);
  • – UK manufacturing output (GB) – 11:30 (GMT+2:00);
GBP/USD

Indicators do not give accurate signals: the price has crossed 50 MA.

MACD histogram is near the 0 mark.

The Stochastic Oscillator is located in the neutral zone, the %K line has crossed the %D line. There are no signals at the moment.

Trading recommendations
  • Support levels: 1.28750, 1.28400
  • Resistance levels: 1.29250, 1.29600, 1.30100

If the price fixes below 1.28750, expect quotes to fall toward 1.28500-1.28300.

Alternatively, the quotes could grow toward 1.29600-1.30000.

The USD/CAD currency pair

Technical indicators of the currency pair:
  • Prev Open: 1.32999
  • Open: 1.33168
  • % chg. over the last day: +0.05
  • Day’s range: 1.32950 – 1.33199
  • 52 wk range: 1.2949 – 1.3566

The USD/CAD currency pair is in sideways movement. There is no defined trend. At the moment, the local support and resistance levels are at 1.32900 and 1.33250, respectively. Investors are waiting for additional drivers. Technical correction of USD/CAD quotes is not excluded in the nearest future. We recommend you to pay attention to the dynamics of black gold prices. Positions should be opened from key levels.

Publication of important economic releases from Canada is not planned.

USD/CAD

Indicators do not give accurate signals: the price has crossed 50 MA and 100 MA.

MACD histogram has gone down, which indicates a development of a correction movement.

The Stochastic Oscillator is located in the oversold area, the %K line has crossed the %D line. No signals at the moment.

Trading recommendations
  • Support levels: 1.32900, 1.32650, 1.32450
  • Resistance levels: 1.33250, 1.33500

If the price fixes above 1.33250, expect the quotes to grow toward 1.33500-1.33700.

Alternatively, the quotes could correct toward 1.32600-1.32400.

The USD/JPY currency pair

Technical indicators of the currency pair:
  • Prev Open: 109.678
  • Open: 109.746
  • % chg. over the last day: +0.14
  • Day’s range: 109.744 – 109.932
  • 52 wk range: 104.45 – 113.53

The USD/JPY currency pair keeps consolidating. The technical picture is ambiguous. At the moment local support and resistance levels are at 109.700 and 110.000, respectively. The correction of the trading instrument is not ruled out in the nearest future. Today we recommend you to pay attention to the statements of the FOMC representatives, as well as to the dynamics of the US government securities yield. Positions should be opened from key levels.

Financial markets in Japan are closed due to the holiday.

USD/JPY

Indicators do not give an accurate signal: 50 MA crossed 100 MA.

The MACD histogram has crossed the positive zone, indicating bullish sentiments.

The Stochastic Oscillator is located in the overbought zone, the %K line crossed the %D line. No signals at the moment.

Trading recommendations
  • Support levels: 109.700, 109.550, 109.300
  • Resistance levels: 110.000, 110.250

If the price fixes above 110.000, expect further growth of USD/JPY quotes towards 110.250-110.400.

Alternatively, the USD/JPY pair may decline to 109.400-109.200.

by JustForex