Japan’s Q4 GDP fell 6.3% over year in 2019, much sharper than expected, following an 1.6% upwardly revised growth in Q3. This is bearish for Japanese yen against the dollar.
After finishing the correction towards 1.0858, EURUSD has completed another descending wave at 1.0830. Possibly, today the pair may correct to reach 1.0845 and then start a new decline to break 1.0820. After that, the instrument may continue trading inside the downtrend with the target at 1.0800.
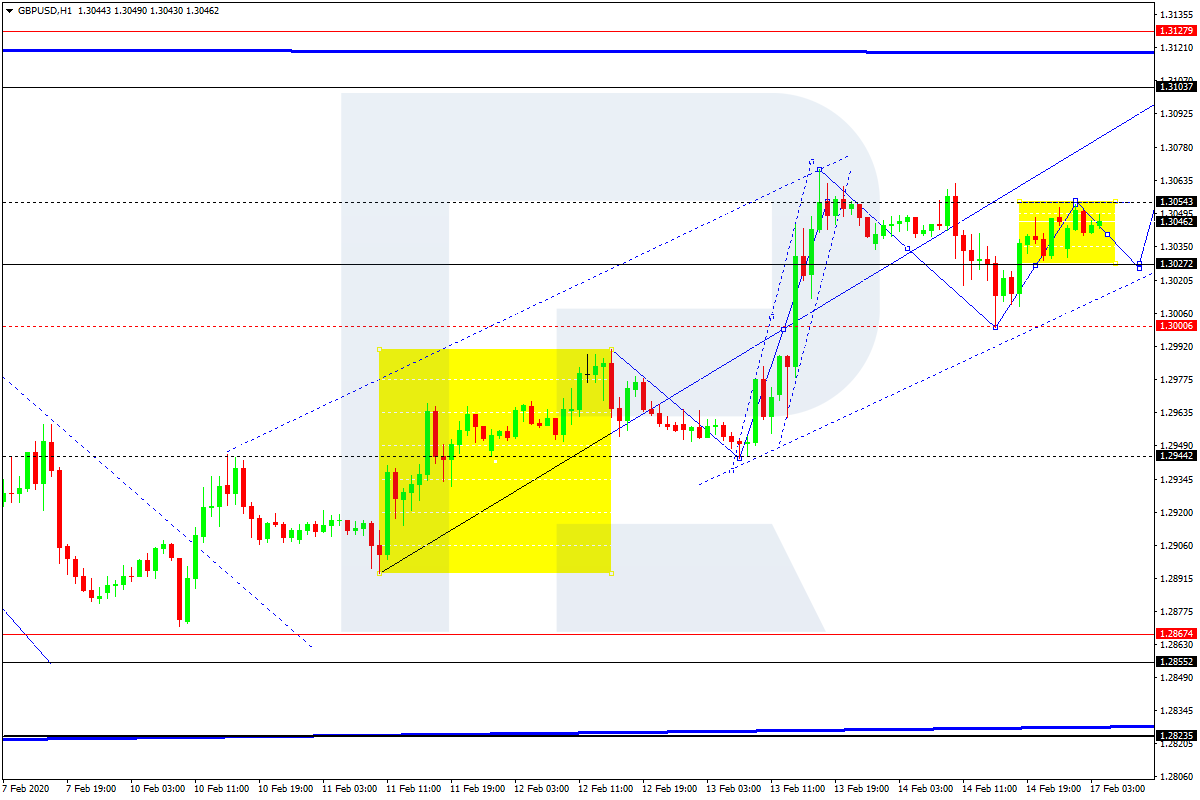
GBPUSD, “Great Britain Pound vs US Dollar”
GBPUSD has completed the correction at 1.3000; right now, it is moving upwards to reach 1.3054. Later, the market may start a new decline towards 1.3027 and then resume trading upwards with the target at 1.3070.
USDCHF, “US Dollar vs Swiss Franc”
USDCHF is moving upwards. The main scenario implies that the pair may reach 0.9826. After that, the instrument may start a new decline towards 0.9802 and then form one more ascending structure with the target at 0.9841.
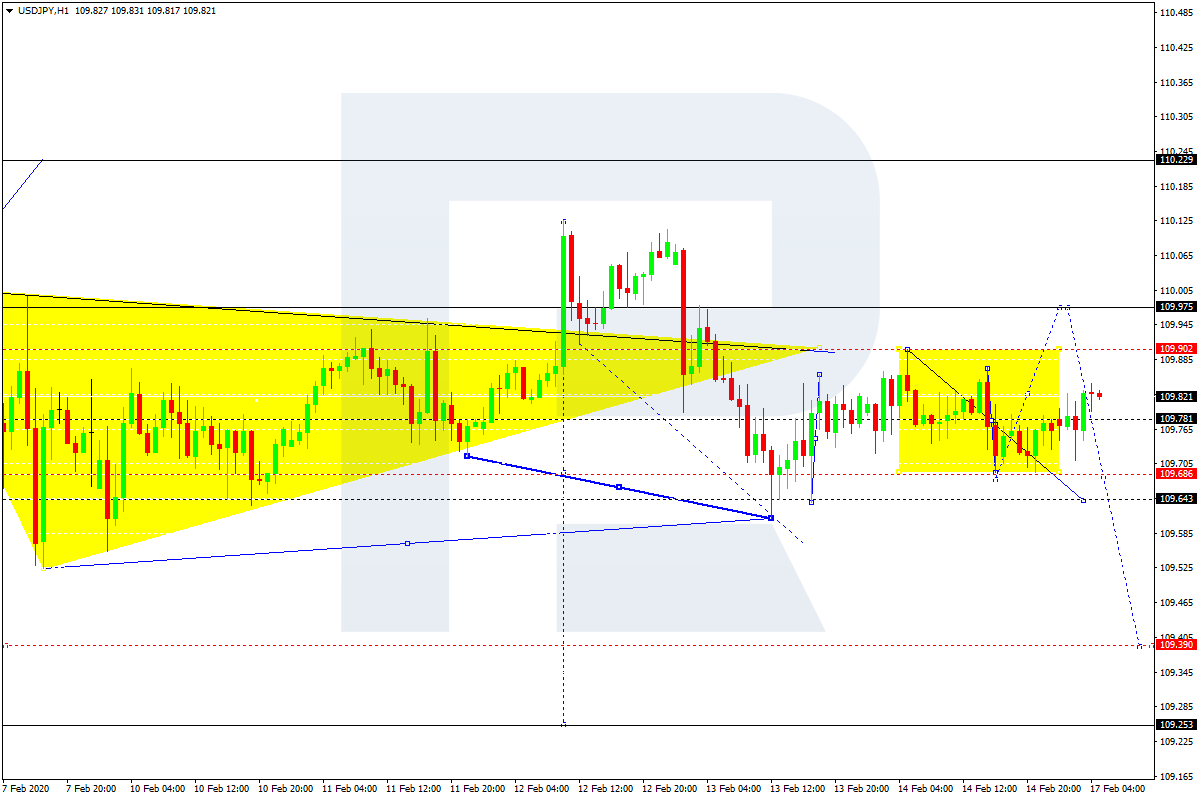
USDJPY, “US Dollar vs Japanese Yen”
USDJPY is consolidating around 109.78 without any particular direction. If later the price breaks this range to the downside, the instrument may start another decline towards 109.64; if to the upside – form one more ascending structure with the target at 109.97.
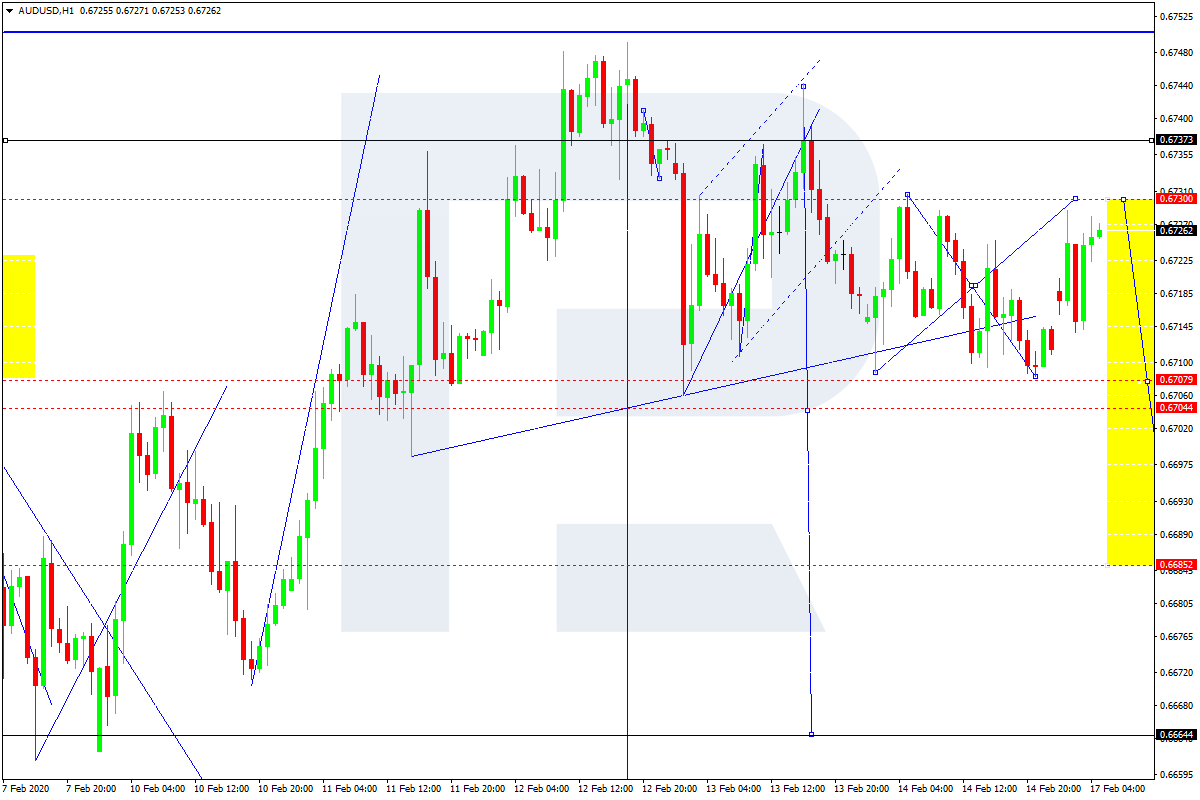
AUDUSD, “Australian Dollar vs US Dollar”
AUDUSD is consolidating around 0.6719. Possibly, the pair may trade upwards to reach 0.6730 and then resume falling to break 0.6700. Alter that, the instrument may continue moving downwards with the short-term target at 0.6685.
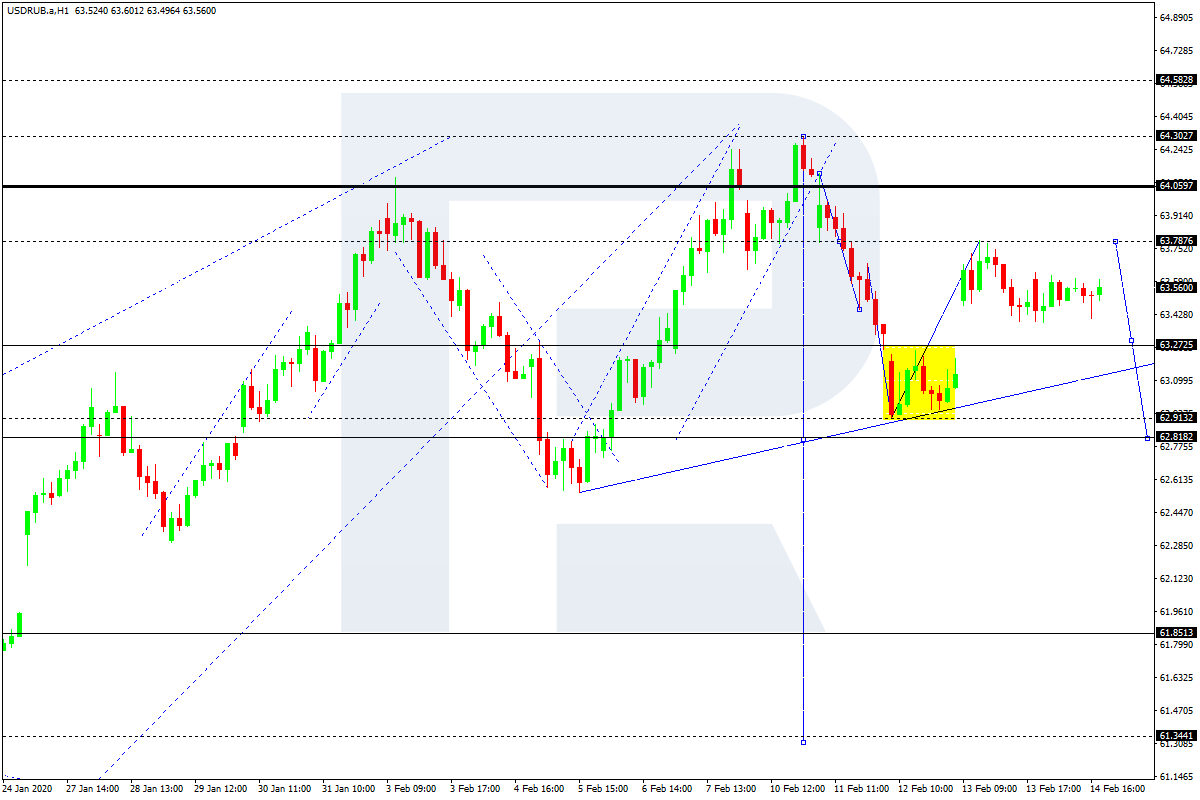
USDRUB, “US Dollar vs Russian Ruble”
USDRUB is consolidating above 63.33. Possibly, the pair may break the range t the downside and then continue trading inside the downtrend with the target at 62.81.
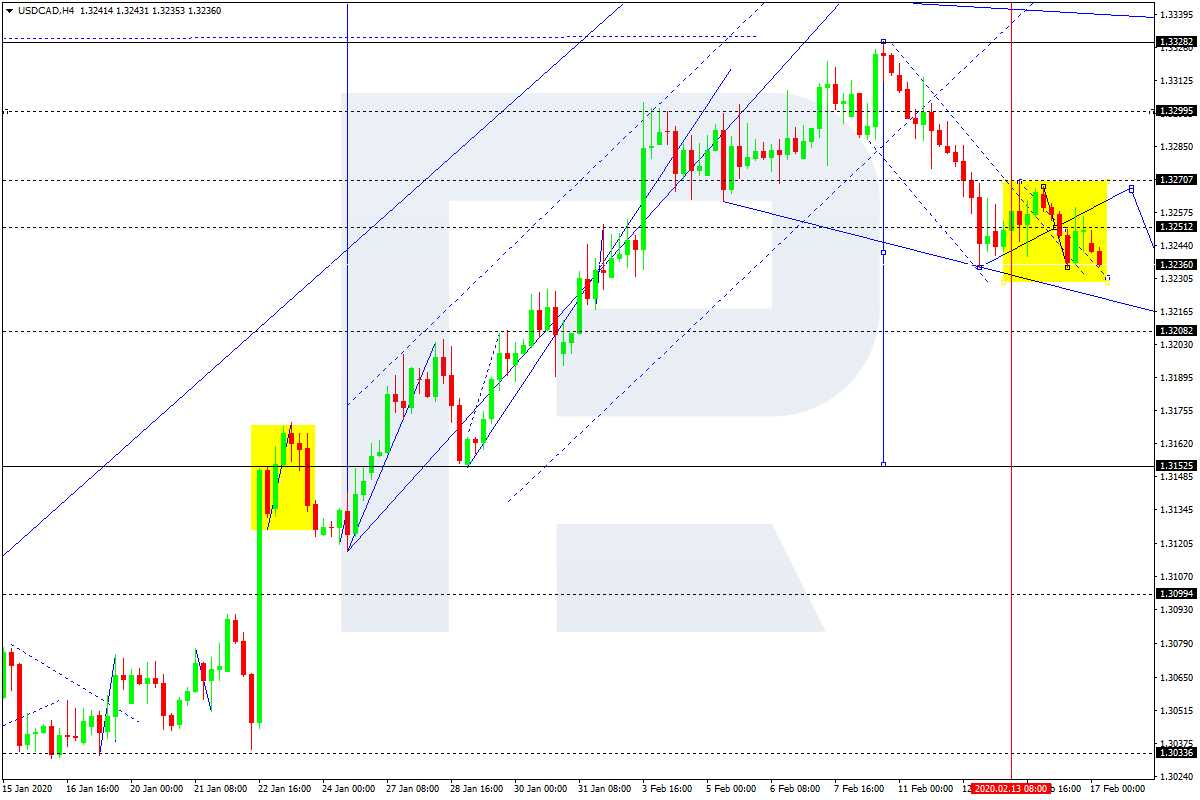
USDCAD, “US Dollar vs Canadian Dollar”
USDCAD is consolidating around 1.3251. Today, the pair may fall towards 1.3232 and then grow to reach 1.3252. Later, the market may form a new descending structure with the target at 1.3200.
XAUUSD, “Gold vs US Dollar”
After reaching the target at 1584.58, Gold is consolidating above 1579.95. Possibly, the pair may break this range to the downside and then start a new correction towards 1573.20.
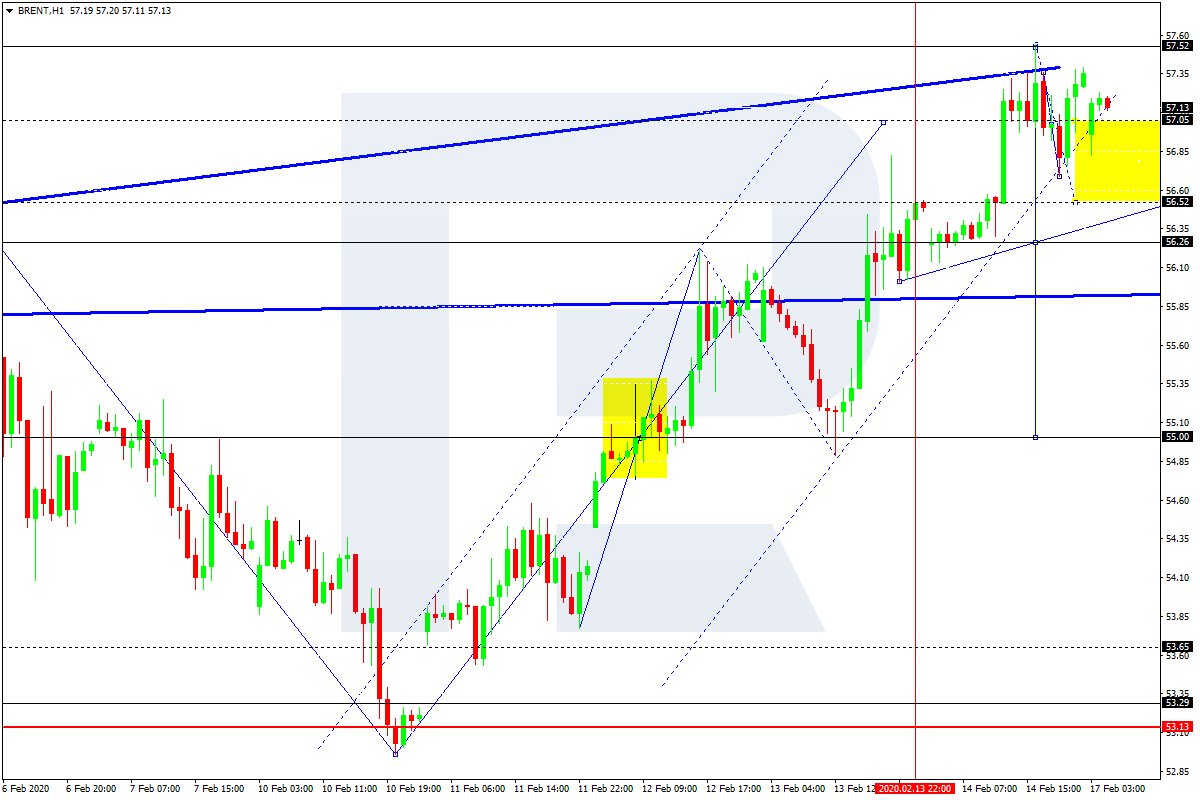
BRENT
Brent has reached its upside target at 57.50. Possibly, today the pair may correct with the first target at 56.52 and then form one more ascending structure towards 57.00. Later, the market may continue the correction with the target at 55.55.
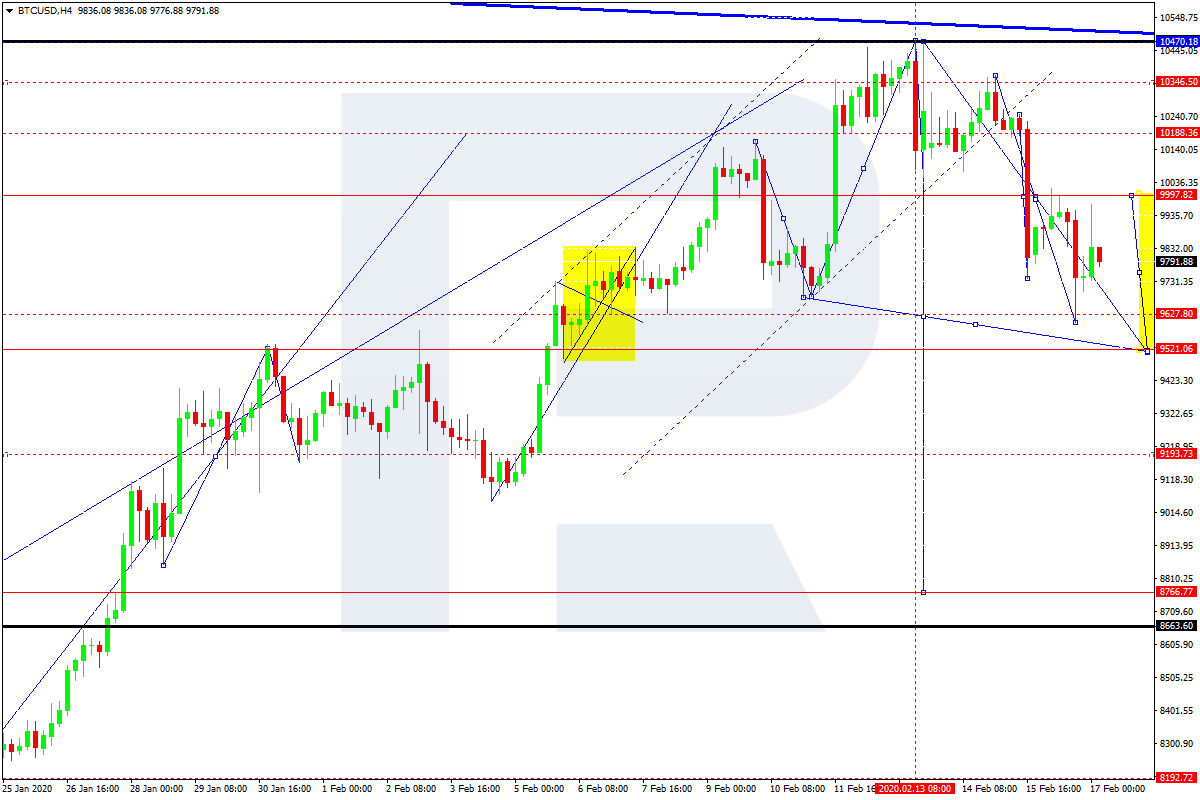
BTCUSD, “Bitcoin vs US Dollar”
BTCUSD is still correcting with the first target at 9500.00. After that, the instrument may start another growth towards 9900.00 and then continue the correction with the short-term target at 9200.00.
Attention! Forecasts presented in this section only reflect the author’s private opinion and should not be considered as guidance for trading. RoboForex LP bears no responsibility for trading results based on trading recommendations described in these analytical reviews.
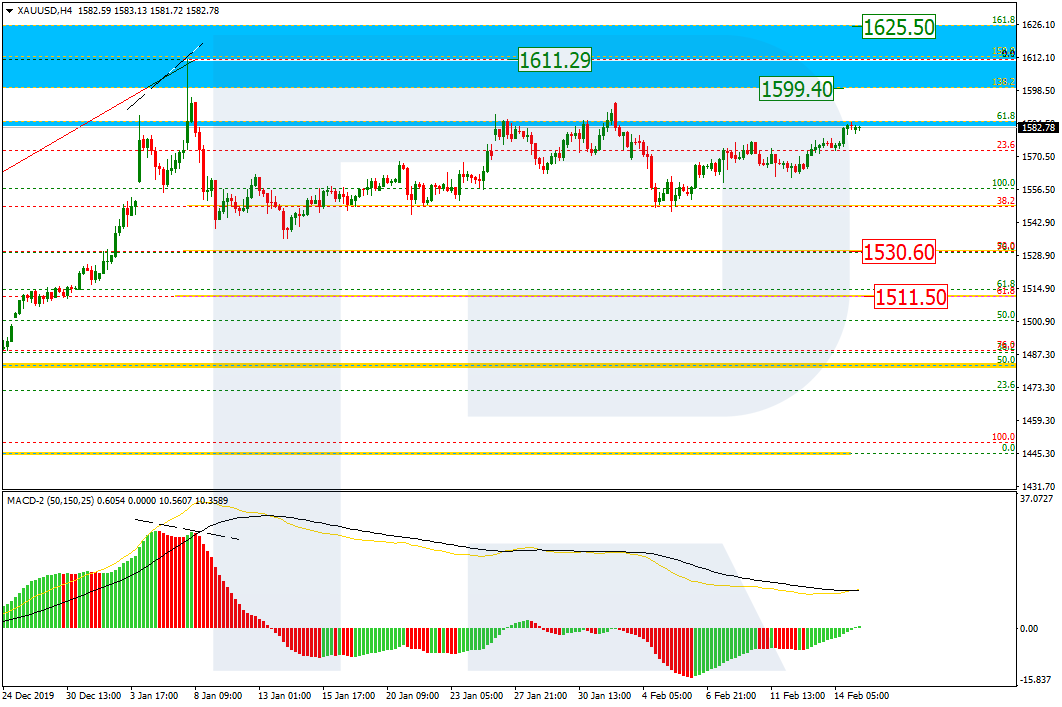
As we can see in the H4 chart, correctional waves that follow each other are forming a Triangle pattern. After re-testing 38.2% fibo, XAUUSD is forming another rising wave. The major scenario implies that the pair may break the current high at 1611.29 and reach the post-correctional extension area between 138.2 and 161.8% fibo at 1599.45 and 1625.70 respectively. However, another scenario suggests that the instrument may continue its decline towards 50.0% and 61.8% fibo at 1530.60 and 1511.50 respectively.
In the H1 chart, the uptrend has reached 61.8% fibo and may yet continue towards 76.0% fibo at 1593.20. However, there is a divergence on MACD, which may indicate a possible pullback soon; the target may be the support at 38.2% fibo (1564.67).
USDCHF, “US Dollar vs Swiss Franc”
As we can see in the H4 chart, the rising wave has already reached 50.0% fibo. The next upside target may be 61.8% fibo at 0.9867. At the same time, there is a divergence on MACD, which may force a pullback. The support is 38.2% fibo at 0.9613.
The H1 chart shows a more detailed structure of the current uptrend with a divergence on MACD. The pair has already reached 61.8% fibo and right now it testing it.
Attention! Forecasts presented in this section only reflect the author’s private opinion and should not be considered as guidance for trading. RoboForex LP bears no responsibility for trading results based on trading recommendations described in these analytical reviews.
Maurice Jackson of Proven and Probable talks with Rick Rule of Sprott USA and John-Mark Staude of Riverside Resources about the investment promise of project generators.
Maurice Jackson: Today we will highlight what may be the most overlooked value proposition in exploration, prospect generators. Joining us for a conversation is legendary investor Rick Rule of Sprott USA and Dr. John-Mark Staude of Riverside Resources Inc. (RRI:TSX.V; RVSDF:OTCQB).
Rick, you, along with Sprott USA, are the most trusted and respected names in the natural resource space. That reputation has been earned with a proven pedigree of personal and investment success for the clients of Sprott USA by identifying companies and sectors that are selling at deep discounts. I would like to begin by asking you a two-fold question. What is a prospect generator and why should someone reading strongly consider the value proposition they may present for one’s portfolio?
Rick Rule: A prospect generator, as I define it, Maurice, is an exploration company that uses the management’s technical expertise and commercial acumen to generate investment ideas and an investment thesis, stake those ideas, stake the physical terrain and then bring in other partners to share the financial riskoften to bear the financial riskin return for a carried interest in the property and or a royalty.
The idea is that the exploration business is very much like any other form of research and development business, and that the chief value is actually the intellectual capital of the management teamthe idea being, with an exploration company, that you share the financial risk of developing a project so that you don’t dilute the shares and you don’t, as an investor, dilute your interest in the intellectual capital, which is, in fact, the most valuable asset that many of these small companies have.
As to success, I’d like to answer the question statistically. When I was in university, I was taught that a mineralized anomaly had a 1 in 3,000 chance to become a mine. That means the value proposition offered up on Bay Street and Howe Street is that you have a 1 in 3,000 chance of a 10 to 1 returnvery poor math.
Now, the truth is that a reasonably intelligent speculator can reduce those odds somewhat by buying into companies that employ serially successful people or by confining one’s speculations to companies where they’ve already established the third dimension. That is where they have an ore body into a deposit, but still over 35 or 40 years of speculating in exploration.
I have invested in something over 65 public prospect generators. The truth is that my memory is now foggy enough that I can’t tell you how many, but I’ve participated in 22 or 23 economic discoveries and 20 takeovers, which means that I have been successful on, shall we say, 20 of 65 starts, versus the expected statistical average in junior mining of 1 in 3,000. We had a young intern here years ago who told me that my experience was three standard deviations better than the industry experience as a whole.
Now, that’s the type of arithmetic that somebody like me can’t help but pay attention to.
If you want a dramatic example, probably the most dramatic example for me [is] Arequipa Resources, where there was a superb geological team generating prospects in Peru right after the Shining Path had been kicked outin other words, after the flak jackets came on, but long before the currency was convertible. That company participated, if my memory serves me correctly, in 36 exploration campaigns, all of which were funded by other people’s money. Had the company diluted itself over 36 exploration campaigns, they wouldn’t have existed by the time that they made their final discovery, which was the Pierina discovery.
The upshot of that is that in the company’s sort of three years of existence, they went from a $0.35 per share initial public offering to a $30 per share takeout by Barrick Gold Corp. (ABX:TSX; GOLD:NYSE). [There was] very limited dilution along the way, because the heavy lifting of their explorationat least the financial heavy lifting of their explorationwas done with other people’s money.
Before I relinquish to my colleague, Dr. John-Mark Staude, I’d like to say one other thing that makes me feel comfortable about prospect generators. The truth is that I’ve spent hundreds of thousandsin fact, millionsof dollars on research over the last 35 yearsgeological research, engineering research, financial researchand I’ve paid consultants hundreds of thousands of dollars. In prospect generation the due diligence isn’t done by me, it’s done by major mining companies, by peers. And the people who are doing the due diligence don’t send me a bill. They send John-Mark a check.
Now, whether they’re right or not, the fact that they invest in the outcome of their due diligence gives me extraordinary comfort. The fact that BHP Billiton Ltd. (BHP:NYSE; BHPLF:OTCPK) or Rio Tinto Plc (RIO:NYSE; RIO:ASX; RIO:LSE; RTPPF:OTCPK) or Teck Resources Ltd. (TCK:TSX; TCK:NYSE) or Barrick is doing not just the heavy lifting of the check-writing, but also the heavy lifting of the due diligence, for me gives me special comfort.
Maurice Jackson: Quite a compelling value preposition. John-Mark, you’re the CEO of a successful prospect generator. Please introduce us to Riverside Resources (TSX.V: RRI | OTCQB: RVSDF) and the opportunity your company presents to the market.
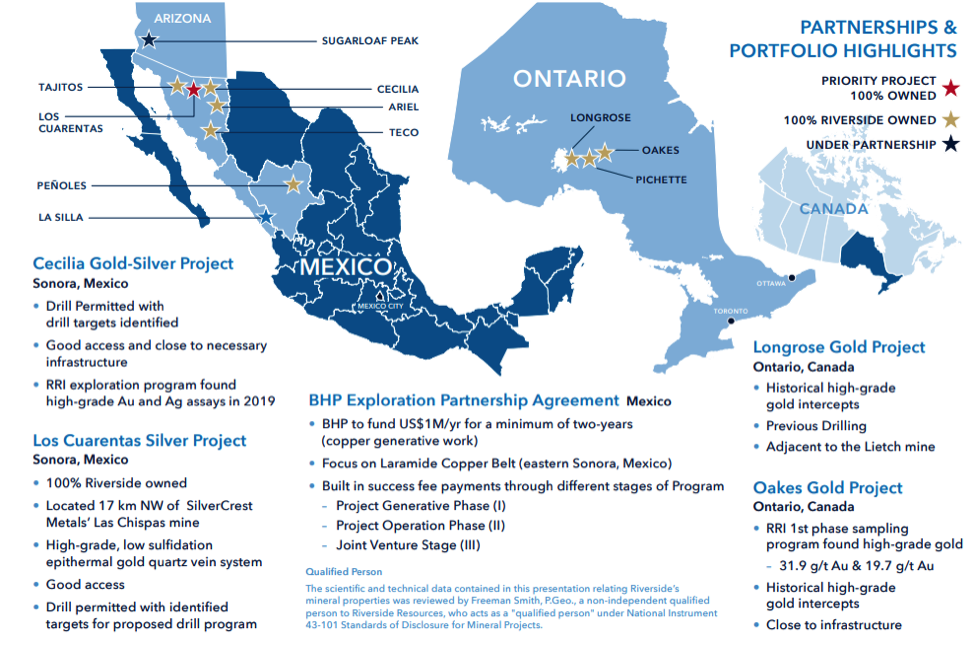
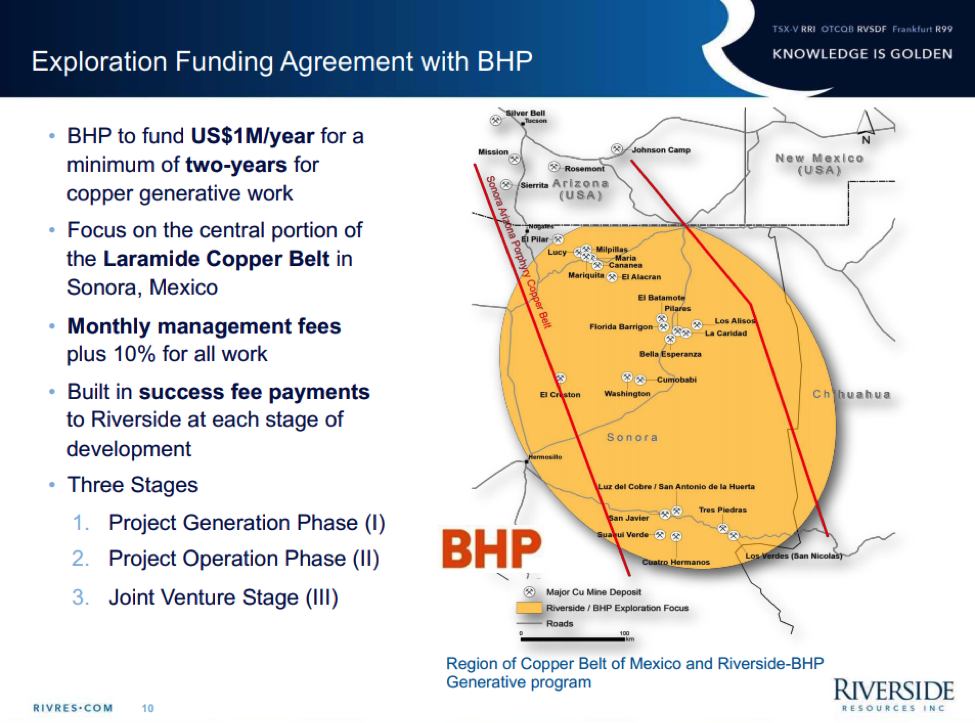
John-Mark Staude: Riverside is a well-funded, value-driven prospect generator advancing a strong portfolio of gold, silver and copper properties in North America. We leverage the company’s 75,000+ location database and experienced technical team to discover and acquire new exploration assets. A great example is our exploration funding agreement, announced last year, with world’s largest market-cap public mining company, BHP. In this program, BHP is fully funding the exploration work and Riverside is the boots on the ground, doing the technical work.
Our market is niche is that we generate projects. Recently we spun out one of our USA copper-gold projects, which is now moved ahead very successfully, and we profit near and long term from this. We carry a royalty in the Arizona asset and we get paid in over $3M worth of shares. Therefore, we don’t dilute our shareholder base. And we very proud of the fact that we keep a very tight share structure.
Maurice Jackson: And what type of resources is Riverside exploring for and where?
John-Mark Staude: We’ve largely focused in Mexico, as well as in Canada. We focus a lot on gold, but we also have silver and copper. Riverside really likes shallow, open-pit deposits. Theses deposits don’t take much capital to find, and when you find one, and show that it’s large, it creates the urgency for majors to look to acquire it.
Maurice Jackson: Does the Riverside property bank consists of greenfields or brownfields exploration plays or a combination of both?
John-Mark Staude: It’s interesting. We started off mainly with greenfields, but recently, as companies have left Mexico and we’ve been able to focus during the downturn, [we] have been aggressively upgrading our property bank to having brownfields exploration play around existing mines and neighboring some of the large discoveries, such as SilverCrest Metals Inc. (SIL:TSX.V) and Premier Gold Mines Ltd. (PG:TSX) in Mexico.
We are also in another high value region, as we’re next to Geraldton, Ontario, one of the large developing gold districts with excellent infrastructure and at feasibility stage for potential restart and expansion of the operations. Riverside went from greenfields to brownfields [around existing operations], where we know. . .we have good things that are of value.
Maurice Jackson: Rick, provide us with some background on your relationship with John-Mark and how long have you been an investor in Riverside?
Rick Rule: My first memory of meeting John-Mark was in an investment conference in Vancouver many, many years ago, when I was talking about prospect generation. And John-Mark came up afterward and introduced himself as business development for BHP. So, I immediately understood that he was ultimately a customer of mine and, of course, did my best to impress him. He moved on, if my memory serves me correctly, from BHP to Teck. At some point in time I tried to hire John-Mark. He had the very good sense to refuse me, but the consequence of that is that when he was starting his own company, Riverside. I was privileged to be one of the early investors and we’ve been shareholders and backers of Riverside, among others, ever since.
Maurice Jackson: Rick, you referenced these success ratios of prospect generators (PGs) versus traditional exploration companies and you’re one of the biggest advocates for PGs and, in particular, Riverside. Why has your level of commitment been so strong over the years and what gives you confidence in the future of Riverside?
Rick Rule: Well, the truth is that success in prospect generation has to do with the technical acumen of the management team and their commercial acumen. I was particularly attracted to the fact that John-Mark’s pedigree and the pedigrees of his team were particularly well suited to the task at hand. I’ve always been interested in Mexican exploration in particular and large copper gold systems. John-Mark, if my memory serves me well, went to the University of Arizona, which pioneered most of the modern exploration technology for those types of deposits.
And John-Mark, as a consequence of his Rolodex, has been able to assemble around him a very highly skilled team.
His particular advantage, though, was that he looks at deal structure from the customer’s point of view because John-Mark used to represent BHP in these negotiations and after that represented Teck’s interest in those negotiations. He understands something about, first of all, what the majors require in a joint venture and how to intelligently structure and price a joint venture so that it will be fair to the Riverside shareholders, but also in the interest of the customer. I think that commercial skill set is something that’s lacking in some of the prospect generators that solely have great technical skills.
Maurice Jackson: John-Mark, last year Riverside announced a new strategic partner in billion-dollar market-cap BHP. Why did BHP partner with Riverside and share some of the details of the partnership?
John-Mark Staude: Yeah, we were really lucky. It turns out BHP wanted to grow into Mexico and they knew that we had done these different types of partnerships for technical programs.
There were 12 companies reviewed that were operating in Mexico, and Riverside passed all of those and was selected as the operating group. BHP is 22,000 times bigger than us in market cap. So we’re really two different-size companies [with different] goals, and we showed them that we operate safely, efficiently, and can for them too. We’ve done strategic exploration alliances with Kinross Gold Corp. (K:TSX; KGC:NYSE), Cliffs Natural Resources Inc. (CLF:NYSE), Antofagasta Plc (ANTO:LSE), Hochschild Mining Plc (HOC:LSE), continually being able to develop portfolios for the major companies. We can do it safely and effectively, and that’s why BHP came in, and we’re really enjoying working with them. This program is a million dollars and we’ve already been able to have another 50% as a new additional budget into the program each year for just the greenfield starting in the programs.
It’s a $5 million spend for them to earn into the project. We like those types of situations where they put up all the money. We put up all the science and work, [and] we progress together to develop projects, as Rick says. This really can work for the discovery. Sometimes the discoveries are too small for the major, but they can still be big enough for us, and we can put together those portfolios and then spin them out or do other deals in the future. So we really like working with these major companies.
Maurice Jackson: Rick, what does that convey to the person listening, when two companies, Sprott USA and BHP, are committing capital into Riverside?
Rick Rule: Maurice, anytime that you want to mention Sprott in conjunction with BHP and expertise, you certainly have my permission to do that.
Our interests are different. I think in fairness, one of the things it says is the two different groups who benefit from prospect generationthat is to say, Sprott as a shareholder and BHP as somebody looking for exploration serviceshave narrowed the field to Riverside. One of the benefits that I think might be lost potentially on Riverside shareholders is the fact that BHP brings more than money.
What BHP might bring to me is due diligence, where they write a check as opposed to send me a bill. But after that, if you assume that John-Mark comes up with an interesting piece of terrain and an interesting exploration idea, BHP has literally hundreds of earth scientists in place. It’s almost impossible that there’s an assemblage of minerals somewhere in the world that somebody at BHP doesn’t have familiarity with. And the fact that they pay the costs and add intellectual capital after the fact is a wonderful benefit that shareholders like myself enjoy from a company like Riverside, [which is] able to joint venture with the largest and smartest mining companies in the world.
Maurice Jackson: Switching gears, John-Mark, what is the next unanswered question for Riverside? When can we expect an answer and what will determine success?
John-Mark Staude: One of them is with the spinning out of Capitan Mining. Riverside actually is able to progress for the shareholders, giving a share of this other company to our shareholders directly.
So the next unanswered question for Riverside? Is there a potential for a giant porphyry copper discovery there? We’ll be putting out news before the PDAC, which is in the beginning of March, about our exploration programs in Canada and Mexico.
Maurice Jackson: Please provide us with an update on the capital structure for Riverside.
John-Mark Staude: Riverside continues to have a tight share structure with 63 million shares, no debt, and we have over $3 million cash in the bank.
Maurice Jackson: Before we close, Dr. Staude, what did I forget to ask?
John-Mark Staude: I think one of the key things for Riverside is, when are we going to make those discoveries? That’s often asked and I think right now we have four different programs going in 2020 with partner funding, and work going on with them. We’re particularly, I think, interested in what can we do here in the first quarter so we’ll have news flow, and that’ll be a really great way for us to be able to put out those new discoveries that we’re making.
Maurice Jackson: Mr. Rule, what did I forget to as, sir?
Rick Rule: Well, I don’t think you forgot to ask much, Maurice. One thing that I would point out is that over the last 10 years, which have been very, very difficult years for companies in the minerals businessin the minerals exploration businessone of the beauties of the prospect generator model in general, and of Riverside in particular, is that they haven’t had to dilute existing shareholders out of existence.
When John-Mark talks about his very narrow share count, one thing he might mention is that the shares are fairly closely held by people who aren’t in the stock for a nickel gain. When I remember back to the last exploration bull market, which we enjoyed, which sadly was 20012002, one of the things that I noticed is that the prospect generators, when money came back into the sectors, literally had a melt-up because as buyers came into the market, there were no sellers to match them.
Now I’m not suggesting the past is prologue. What I am suggesting is that the tight share floatsclosely held companiesdo better in nascent bull markets than companies that have had to be very profligate, issuing shares to keep themselves alive during tough times. Another of the unstated perhaps advantages of prospect generators in general, and Riverside in particular.
Maurice Jackson: Rick, if someone listening wants to have their natural resource portfolio graded, can they contact you or someone at Sprott USA?
Rick Rule: Absolutely. I would love to offer readers, as I have in the past, the ability, with no obligation to have me grade their natural resource portfolios. All they need to do is e-mail me their natural resource portfolios at [email protected]. Maurice, it’s important that readers put both the names and the symbols of their companies in the text, not as an attachment that my security people won’t allow me to open. I will rank those companies one to ten, 1 being best, 10 worst, and comment on them where I think my comment is appropriate.
As an added inducement, I will also e-mail back a 40-year gold mining company index, which makes a spectacular case for investing in precious metals mining companies now, as well as a hundred-year commodity chart. So we’ll give you two charts, one about gold mining stocks, the others about commodities, and we will, probably more importantly, rate the companies in your portfolio and return them to you.
Maurice Jackson: And in the subject line, please put in Proven and Probable. John-Mark, please share the website address and ticker symbol for Riverside Resources.
John-Mark Staude: Riverside’s is www.rivres.com (TSX.V: RRI | OTCQB: RVSDF).
Maurice Jackson: Before you make your next bullion purchase, make sure you call me. I am a licensed representative for Miles Franklin Precious Metals Investments where we provide a number of options to expand your precious metals portfolio, from physical delivery, offshore depositories, precious metal IRAs and private blockchain distributed ledger technology. Call me directly at (855) 505-1900 or you may e-mail [email protected].
Riverside Resources is a sponsor of Proven and Probable and we are proud shareholders for the virtues conveyed in today’s message.
Gentlemen, thank you both for joining us today on Proven and Probable.
Maurice Jackson is the founder of Proven and Probable, a site that aims to enrich its subscribers through education in precious metals and junior mining companies that will enrich the world.
Disclosure: 1) Maurice Jackson: I, or members of my immediate household or family, own shares of the following companies mentioned in this article: Riverside Resources. I personally am, or members of my immediate household or family are, paid by the following companies mentioned in this article: None. My company has a financial relationship with the following companies mentioned in this article: Riverside Resources is a sponsor of Proven and Probable. Proven and Probable disclosures are listed below. 2) The following companies mentioned in this article are billboard sponsors of Streetwise Reports: None. Click here for important disclosures about sponsor fees. 3) Statements and opinions expressed are the opinions of the author and not of Streetwise Reports or its officers. The author is wholly responsible for the validity of the statements. The author was not paid by Streetwise Reports for this article. Streetwise Reports was not paid by the author to publish or syndicate this article. The information provided above is for informational purposes only and is not a recommendation to buy or sell any security. Streetwise Reports requires contributing authors to disclose any shareholdings in, or economic relationships with, companies that they write about. Streetwise Reports relies upon the authors to accurately provide this information and Streetwise Reports has no means of verifying its accuracy. 4) This article does not constitute investment advice. Each reader is encouraged to consult with his or her individual financial professional and any action a reader takes as a result of information presented here is his or her own responsibility. By opening this page, each reader accepts and agrees to Streetwise Reports’ terms of use and full legal disclaimer. This article is not a solicitation for investment. Streetwise Reports does not render general or specific investment advice and the information on Streetwise Reports should not be considered a recommendation to buy or sell any security. Streetwise Reports does not endorse or recommend the business, products, services or securities of any company mentioned on Streetwise Reports. 5) From time to time, Streetwise Reports LLC and its directors, officers, employees or members of their families, as well as persons interviewed for articles and interviews on the site, may have a long or short position in securities mentioned. Directors, officers, employees or members of their immediate families are prohibited from making purchases and/or sales of those securities in the open market or otherwise from the time of the interview or the decision to write an article until three business days after the publication of the interview or article. The foregoing prohibition does not apply to articles that in substance only restate previously published company releases. As of the date of this article, officers and/or employees of Streetwise Reports LLC (including members of their household) own shares of Riverside Resources, a company mentioned in this article.
Disclosures for Proven and Probable: Proven and Probable LLC receives financial compensation from its sponsors. The compensation is used is to fund both sponsor-specific activities and general report activities, website, and general and administrative costs. Sponsor-specific activities may include aggregating content and publishing that content on the Proven and Probable website, creating and maintaining company landing pages, interviewing key management, posting a banner/billboard, and/or issuing press releases. The fees also cover the costs for Proven and Probable to publish sector-specific information on our site, and also to create content by interviewing experts in the sector. Monthly sponsorship fees range from $1,000 to $4,000 per month. Proven and Probable LLC does accept stock for payment of sponsorship fees. Sponsor pages may be considered advertising for the purposes of 18 U.S.C. 1734.
The Information presented in Proven and Probable is provided for educational and informational purposes only, without any express or implied warranty of any kind, including warranties of accuracy, completeness, or fitness for any particular purpose. The Information contained in or provided from or through this forum is not intended to be and does not constitute financial advice, investment advice, trading advice or any other advice. The Information on this forum and provided from or through this forum is general in nature and is not specific to you the User or anyone else. You should not make any decision, financial, investments, trading or otherwise, based on any of the information presented on this forum without undertaking independent due diligence and consultation with a professional broker or competent financial advisor. You understand that you are using any and all Information available on or through this forum at your own risk.
On Monday, February 17th, USD/JPY is slowly growing and trading close to 109.84. The Yen has been weak for the second trading session in a row.
The statistics published today showed that the Japanese GDP lost 1.6% q/q in the fourth quarter of 2019 after adding 0.4% q/q in the previous quarter and against the expected reading of -1.0% q/q. On YoY, the indicator dropped 6.3%, although it was expected to expand by 3.7%.
The components of the report show that private consumption lost 2.9% against the expected decline by 2.0%. The private consumption covers almost 60% of the GDP, that’s why its decline has a negative influence on all other aspects.
The Japanese export lost 0.6%, while the import added 0.3%. Both readings are quite weak.
It looks like the current QE program supported by the Bank of Japan is no longer working as it should, as it obviously can’t provide enough support to the country’s economy. In some particular cases, it helps to keep the inflation rate in balance but nothing more. This might become a very serious problem for both the Bank of Japan and the government.
As we can see in the H4 chart, USD/JPY is consolidating around 109.78. If later the price breaks this range to the upside, the instrument may form one more ascending structure towards 110.15; if to the downside – start another correction with the target at 109.25 (an alternative scenario). From the technical point of view, the alternative scenario is confirmed by MACD Oscillator: its signal line is moving close to 0. After the line breaks 0, the price may boost its decline.
In the H1 chart, USD/JPY is moving upwards. Possibly, the pair may reach 109.90 and then form a new descending structure towards 109.78, thus forming another consolidation range. If later the price breaks this range to the upside, the instrument may resume growing towards 110.05; if to the downside – start another decline with the target at 109.50. From the technical point of view, this scenario is confirmed by Stochastic Oscillator: its signal line is moving above 80 and about to start falling. After breaking 80, the line may fall towards 50, thus indicating the price chart decline.
Disclaimer
Any predictions contained herein are based on the authors’ particular opinion. This analysis shall not be treated as trading advice. RoboForex shall not be held liable for the results of the trades arising from relying upon trading recommendations and reviews contained herein.
The EUR/USD currency pair has stabilized after a prolonged decline. At the moment the trading instrument is consolidating near the three-year lows. The local support and resistance levels are 1.08250 and 1.08650, respectively. Investors are concerned about the weakening of economic growth in Europe. The financial markets continue to be under pressure from the rapidly spreading coronavirus in China. Nevertheless, we do not rule out technical correction of EUR/USD quotes in the nearest future. We recommend opening positions from key levels.
No important economic releases are planned today. The US financial markets are closed due to the holiday.
The indicators signal the sellers’ strength: the price has fixed below 50 MA and 100 MA.
The MACD histogram is in the negative zone, which indicates a bearish sentiment.
The stochastic oscillator is in the neutral zone, the %K line has crossed the %D line. There are no signals at the moment.
Trading recommendations
Support levels: 1.08250, 1.08000
Resistance levels: 1.08650, 1.09000, 1.09400
If the price fixes below 1.08250, further decline of EUR/USD quotes is expected to 1.08000-1.07700.
Alternatively, the quotes could grow to 1.09000-1.09200.
The GBP/USD currency pair
Technical indicators of the currency pair:
Prev Open: 1.30422
Open: 1.30322
% chg. over the last day: -0.08
Day’s range: 1.30260 – 1.30536
52 wk range: 1.1959 – 1.3516
GBP/USD quotes are in a flat. There is no defined trend. Sterling is testing key support and resistance levels: 1.30100 and 1.30650, respectively. Financial markets participants are waiting for additional drivers. GBP/USD currency pair has potential for further growth. Positions should be opened from key levels.
The news background on the UK economy is calm.
The indicators point to the strength of buyers: the price has fixed above 50 MA and 100 MA.
The MACD histogram is in the positive zone but below the signal line, which gives a weak signal to buy GBP/USD.
The Stochastic Oscillator is in the neutral zone, the %K line is below the %D line, which indicates a bearish sentiment.
Trading recommendations
Support levels: 1.30100, 1.29850, 1.29400
Resistance levels: 1.30650, 1.31000, 1.31400
If the price fixes above 1.30650, expect the quotes to grow toward 1.31000-1.31200.
Alternatively, the quotes could descend toward 1.29700-1.29500.
The USD/CAD currency pair
Technical indicators of the currency pair:
Prev Open: 1.32665
Open: 1.32500
% chg. over the last day: -0.11
Day’s range: 1.32337 – 1.32508
52 wk range: 1.2949 – 1.3566
USD/CAD currency pair continues to trade in Flat. There is no defined trend. At the moment, local support and resistance levels are acting: 1.32350 and 1.32600, respectively. The trading instrument has a potential for further decline. We recommend you to pay attention to the oil price dynamics. Positions should be opened from key levels.
The Canadian financial markets are closed due to the holiday.
The indicators signal the sellers’ strength: the price has fixed below 50 MA and 100 MA.
The MACD histogram is in the negative zone, which indicates a bearish sentiment.
The Stochastic Oscillator is located in the oversold area, the %K line crossed the %D line. There are no signals at the moment.
Trading recommendations
Support levels: 1.32350, 1.32000
Resistance levels: 1.32600, 1.32800, 1.33000
If the price fixes below 1.32350, expect further correction toward 1.32000.
The Japanese yen continues to be traded in a long flat. The technical pattern is ambiguous. Currently, the following local support and resistance levels can be distinguished: 109.600 and 109.900, respectively. Investors are waiting for additional drivers. We recommend you to keep track of current information about the epidemic in China. Positions should be opened from key levels.
Yen is under pressure due to a weak report on Japanese GDP. According to preliminary data, in the fourth quarter growth slowed down by 1.6% (QoQ). Experts predicted a decline by 0.9%.
Indicators do not give an accurate signal: 50 MA crossed 100 MA.
MACD histogram is near the 0 mark. No signals at the moment.
The Stochastic Oscillator is located in the overbought area, the %K line is above the %D line, which gives a weak signal to buy USD/JPY.
Trading recommendations
Support levels: 109.600, 109.300, 109.100
Resistance levels: 109.900, 110.150
If the price fixes below 109.600, USD/JPY sales should be considered. Potential movement towards 109.300-109.100.
Alternatively, the quotes could grow of USD/JPY currency pair to 110.100-110.300.
On Friday, the US dollar strengthened slightly against a basket of major currencies. The US dollar index (#DX) closed in the green zone (+0.05%). The US has published a number of important economic releases. Thus, the underlying retail sales index rose by 0.3% in January; retail sales volume also rose by 0.3%, which coincided with the forecasts. There were also published indices of expectations and sentiment of consumers from the University of Michigan, which amounted to 92.6 and 100.9, respectively, and were better than predicted values.
Financial market sentiment improved slightly after the number of new cases of coronavirus in China declined, and a national health official said that efforts to stop its spread are beginning to yield first results. China registered 20,009 new infections on Sunday, down from 2,641 the day before, and 142 new deaths, down from 143 the day before. Outside China, about 500 cases and four deaths have been reported so far.
Today, weak economic data from Japan were published in the Asian trade session. Thus, GDP (QoQ) fell by 1.6% in Q4, while experts expected a decline by 0.9%. GDP (YoY) fell by 6.3% instead of 3.7%.
The prices of oil are rising. At the moment futures for WTI oil are testing the mark of $52.35 per barrel.
Market Indicators
On Friday, the US stock market showed mixed dynamics: #SPY (+0.16%), #DIA (-0.09%), #QQQ (+0.29%).
The yields on 10-year US government bonds are consolidated. Currently, the indicator is at the level of 1.58-1.59%.
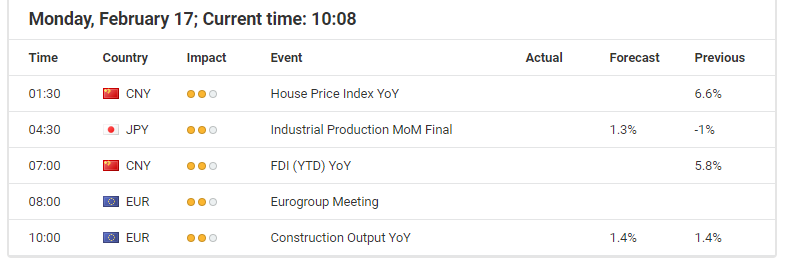
No important news is expected to be published today. The US financial markets are closed due to the President’s Day. Canadian financial markets are closed due to Family Day.
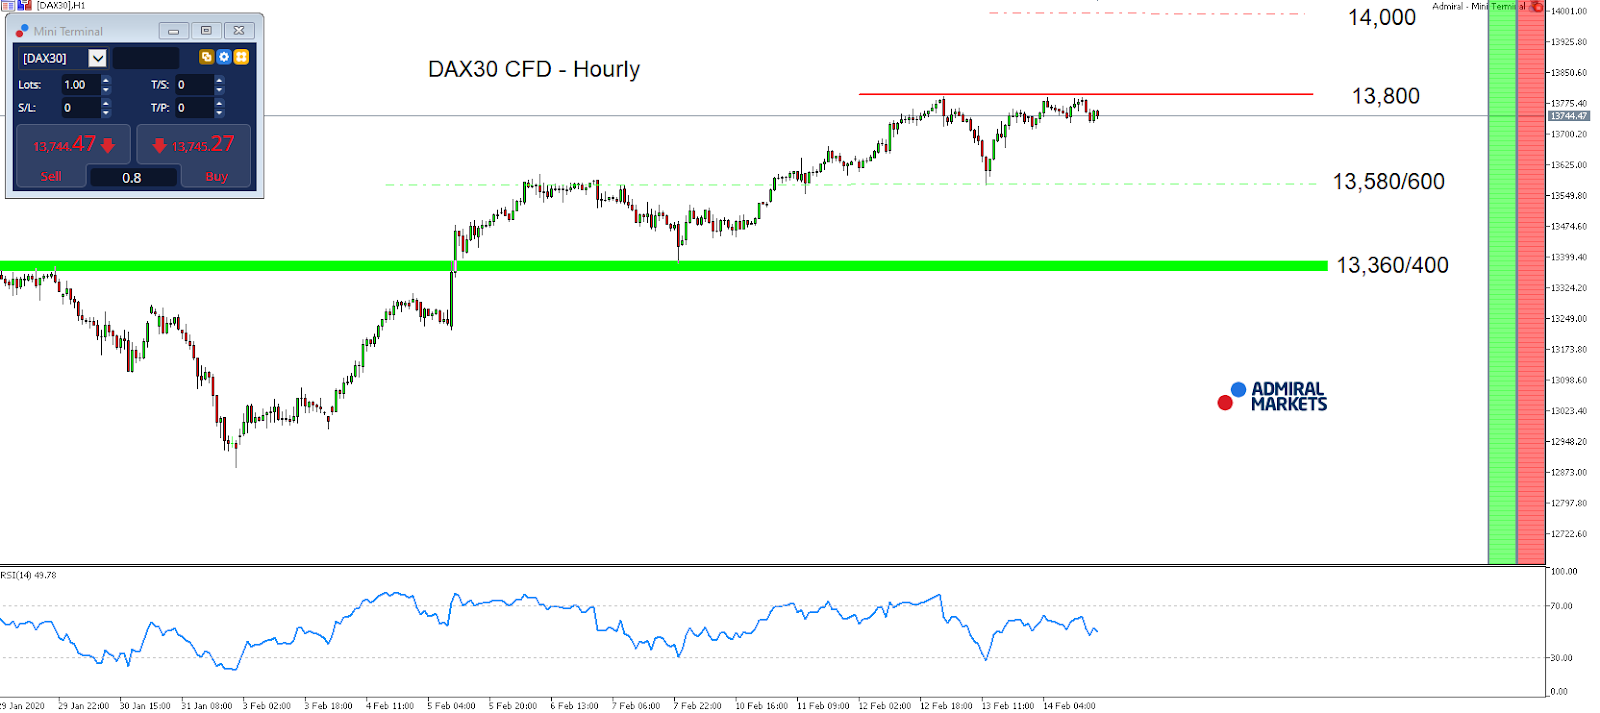
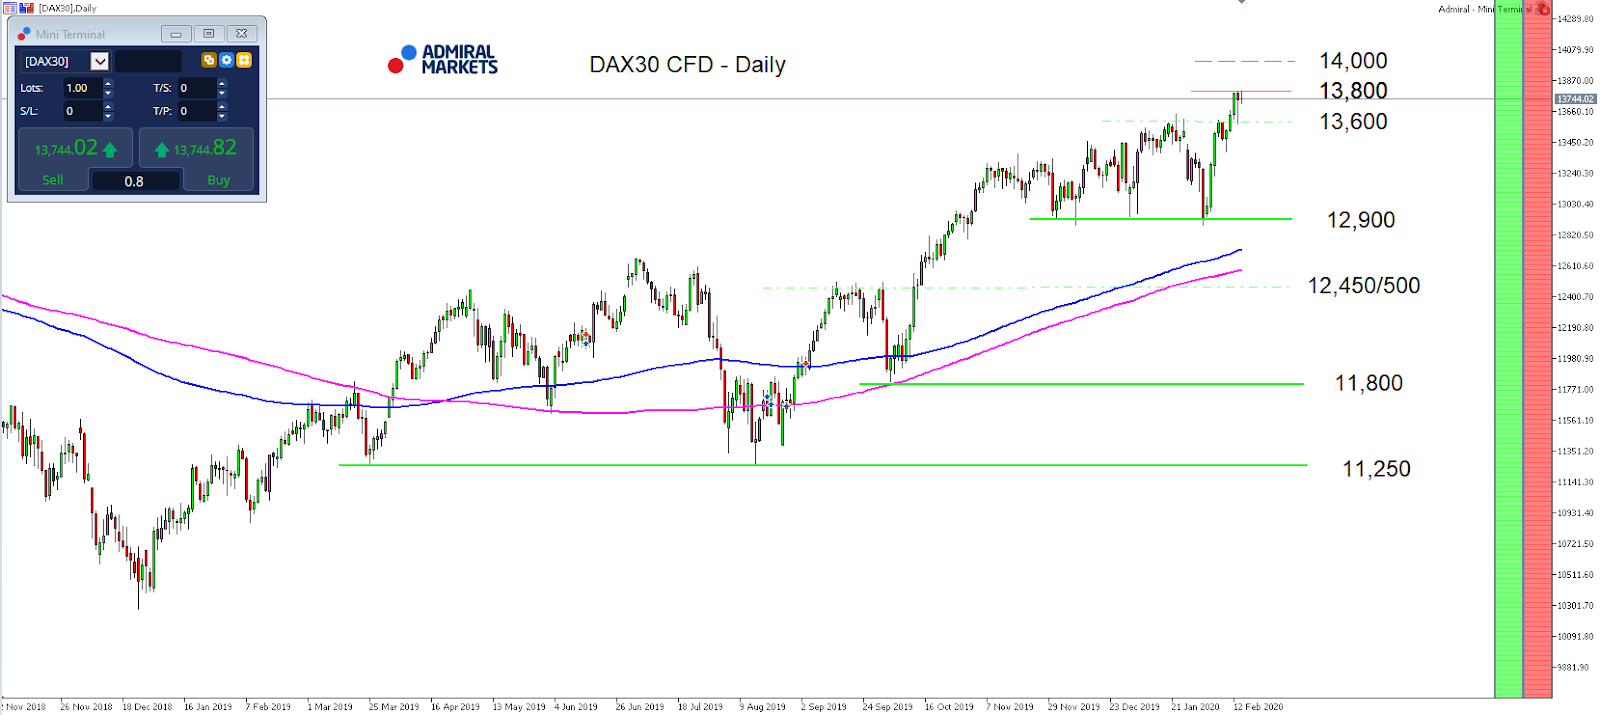
Due to the US bank holiday “US President’s Day”, shortening US trading hours and minimising volatility for the start of the trading week, the chance of any significant moves in the German DAX30 is pretty low.
This is even more likely given the small expiration in Options at the EUREX next Friday.
Here, the Open Interest of Short Calls is quite elevated at 13,800 points, meaning that institutional market participants have an increased interest in holding the German index below 13,800 points, limiting any upside potential.
Nevertheless, if, for whatever reason, we get to see a break above 13,800 points today or in the near future, these institutional players might be forced to hedge their bets, pushing the DAX30 CFD even higher, and bring the next psychological milestone at 14,000 points into focus.
On the other hand: after the surprisingly neutral remarks from Fed chairman Powell last week couldn’t bring Equities down, and the Thursday’s drop was quickly erased, so it became clear that risk-reward ratios for Short engagements are probably not very attractive either.
That said, we see the DAX30 CFD solidly supported around 13,580/600 points with only a drop lower darkening the technical picture on H1 a bit, activating the region around 13,360/400 as a next target:
Source: Admiral Markets MT5 with MT5-SE Add-on DAX30 CFD Hourly chart (between January 28, 2020, to February 14, 2020). Accessed: February 14, 2020, at 10:00pm GMT
Source: Admiral Markets MT5 with MT5-SE Add-on DAX30 CFD Daily chart (between November 2, 2018, to February 14, 2020). Accessed: February 14, 2020, at 10:00pm GMT – Please note: Past performance is not a reliable indicator of future results, or future performance.
In 2015, the value of the DAX30 CFD increased by 9.56%, in 2016, it increased by 6.87%, in 2017 it increased by 12.51%, in 2018 it fell by 18.26%, in 2019 it increased by 26.44% meaning that after five years, it was up by 34.2%.
Discover the world’s #1 multi-asset platform
Admiral Markets offers professional traders the ability to trade with a custom, upgraded version of MetaTrader 5, allowing you to experience trading at a significantly higher, more rewarding level. Experience benefits such as the addition of the Market Heat Map, so you can compare various currency pairs to see which ones might be lucrative investments, access real-time trading data, and so much more. Click the banner below to start your FREE download of MT5 Supreme Edition!
Disclaimer: The given data provides additional information regarding all analysis, estimates, prognosis, forecasts or other similar assessments or information (hereinafter “Analysis”) published on the website of Admiral Markets. Before making any investment decisions please pay close attention to the following:
This is a marketing communication. The analysis is published for informative purposes only and are in no way to be construed as investment advice or recommendation. It has not been prepared in accordance with legal requirements designed to promote the independence of investment research, and that it is not subject to any prohibition on dealing ahead of the dissemination of investment research.
Any investment decision is made by each client alone whereas Admiral Markets shall not be responsible for any loss or damage arising from any such decision, whether or not based on the Analysis.
Each of the Analysis is prepared by an independent analyst (Jens Klatt, Professional Trader and Analyst, hereinafter “Author”) based on the Author’s personal estimations.
To ensure that the interests of the clients would be protected and objectivity of the Analysis would not be damaged Admiral Markets has established relevant internal procedures for prevention and management of conflicts of interest.
Whilst every reasonable effort is taken to ensure that all sources of the Analysis are reliable and that all information is presented, as much as possible, in an understandable, timely, precise and complete manner, Admiral Markets does not guarantee the accuracy or completeness of any information contained within the Analysis. The presented figures refer that refer to any past performance is not a reliable indicator of future results.
The contents of the Analysis should not be construed as an express or implied promise, guarantee or implication by Admiral Markets that the client shall profit from the strategies therein or that losses in connection therewith may or shall be limited.
Any kind of previous or modeled performance of financial instruments indicated within the Publication should not be construed as an express or implied promise, guarantee or implication by Admiral Markets for any future performance. The value of the financial instrument may both increase and decrease and the preservation of the asset value is not guaranteed.
The projections included in the Analysis may be subject to additional fees, taxes or other charges, depending on the subject of the Publication. The price list applicable to the services provided by Admiral Markets is publicly available from the website of Admiral Markets.
Leveraged products (including contracts for difference) are speculative in nature and may result in losses or profit. Before you start trading, you should make sure that you understand all the risks.
By Hussein Sayed, Chief Market Strategist (Gulf & MENA), ForexTime
Equity investors’ continued faith in central banks is evident in China’s market today, with the CSI 300 index up more than 1%.The index has now recovered all of its losses since trading resumed after the Lunar New Year holiday, rising 10.9% from a low of 3,639 recorded on February 3. China’s PBOC lowered the rate on its medium-term loans to financial institutions to 3.15% from 3.25%, after earlier lowering rates on reverse repurchase agreements by a similar amount. The central bank also announced an injection of 100 billion Yuan of reverse repo to financial institutions. These actions are likely to be followed up by lowering the country’s benchmark rate later this week, as they continue to fight the spread of the coronavirus.
Fiscal policies are likely to play a significant role in the current situation with the virus outbreak, with authorities in China pledging to reduce taxes on corporations. But whether this will lead to faster production and get the business cycle running at full capacity again, still depends on how soon the virus gets contained.
Monetary stimulus is currently not helping to boost investment or encourage consumers to spend, but it is inflating asset prices. At this stage, companies’ capital expenditure will not rise because of the cheaper cost of money, similarly spending by consumers on housing, cars and other durable goods. The contagion needs to be controlled to bring confidence back and that’s what we should be monitoring going forward.
This week, we’ll get to see how German institutional investor’s sentiment has been affected by the outbreak of the coronavirus. After reaching a four-year high in January, Tuesday’s German ZEW is most likely to have declined in February, but Euro traders will be monitoring the scale of any fall in the sentiment index.
Eurozone companies will reveal how they are coping with the deadly virus on Friday when IHS Markit releases its February manufacturing and services activity for the region.
A worsening economic outlook may lead to further pressure on the Euro, which fell to a three-year low on Friday, with data from before the coronavirus already showing weakness. Industrial production in the Eurozone dropped 2.1% in December, while the Germany economy stagnated in the fourth quarter of 2019 and the wider Eurozone is growing at its weakest pace since 2014.
Traders will have a better understanding of the Federal Reserve’s outlook on Wednesday, when it releases its minutes for last month’s meeting. Whether Chair Powell’s warning about the impact of the coronavirus outbreak on the US economy will potentially justify a further cut in interest rates remains to be seen, with speculators already pricing in a 43% chance of a rate cut by mid-year.
Disclaimer: The content in this article comprises personal opinions and should not be construed as containing personal and/or other investment advice and/or an offer of and/or solicitation for any transactions in financial instruments and/or a guarantee and/or prediction of future performance. ForexTime (FXTM), its affiliates, agents, directors, officers or employees do not guarantee the accuracy, validity, timeliness or completeness, of any information or data made available and assume no liability as to any loss arising from any investment based on the same.
The US Dollar is now weaker against most Asian and G10 currencies, softening after having recently broken past the 99 psychological level. The Dollar index has posted a 2.84 percent year-to-date gain through February 14, having recorded just one full-week’s decline so far in 2020.
With its 14-day RSI having tipped into overbought territory, the DXY’s upward momentum is set to wane over the near-term, perhaps allowing currencies across the emerging-markets and G10 spectrum some measure of relief. However, considering the still-cautious mood in the markets stemming from the Covid-19 outbreak, the Greenback should remain well bid in the interim.
Fed’s policy bias in focus
Investors will be combing through the minutes from late-January FOMC meeting on Wednesday in ascertaining whether the Dollar deserves to be pushed even higher over the coming days. Although the Fed funds futures are now pricing in at least one Fed rate hike in the second half of the year, should the Covid-19 outbreak feed negatively into the US economy, that could prompt the US central bank to cut rates sooner than unexpected.
Such a scenario though appears unlikely at this point in time, considering the resilience of the world’s largest economy. Retail sales in the US grew for four consecutive months in January, indicating that US consumers can be relied on to keep US economic growth momentum chugging along.
Disclaimer: The content in this article comprises personal opinions and should not be construed as containing personal and/or other investment advice and/or an offer of and/or solicitation for any transactions in financial instruments and/or a guarantee and/or prediction of future performance. ForexTime (FXTM), its affiliates, agents, directors, officers or employees do not guarantee the accuracy, validity, timeliness or completeness, of any information or data made available and assume no liability as to any loss arising from any investment based on the same.