Concerns over the soon-to-begin EU/UK trade talks increased further over the weekend. This was in response to comments made by French President Emmanuel Macron.
Speaking at an event over the weekend, the French premier told the audience that he expects the negotiations to be “tense” when they begin in March.
Macron went on to say that he’s “not sure that an agreement will be reached between now and the end of the year”.
Deadline Raises Risks
The end of year deadline has become a key focal point for the talks. Especially given that UK PM Boris Johnson continues to reaffirm his position that he will not extend the deadline.
Johnson has repeatedly said that he is prepared to leave the transition period without a trade deal rather than extend the deadline any further.
UK to Publish Trade Deal Demands
This week, we’re expecting the UK government to publish its mandate for the trade deal. However, the recent statements from both EU and UK leaders are still very far apart in terms of the desired terms of such a deal.
The EU is insisting that the UK will continue to abide by some EU regulations in return for a deal. Meanwhile, the UK insists that it will only enter a deal if it can retain full sovereignty.
The full details of the UK’s demands for the deal are coming out on Tuesday. They will then be presented in parliament on Thursday.
The UK’s chief Brexit negotiator, David Frost, said that the UK is seeking a Canada-style free trade agreement. We expect the forthcoming mandate to reiterate this message.
Stand-Off Continues
However, speaking in Brussels last week, Michel Barnier (the EU’s chief negotiator) warned that such a deal cannot be granted given the “particular proximity” of the UK to the EU.
There have also been widespread concerns about the likelihood of the two sides agreeing on a deal within the current timeframe.
Negotiations between the two economies will begin on March 2nd. This provides a ten-month window for a deal to be agreed upon. Therefore, we can expect the ongoing progress of the talks to be a key factor for both EUR and GBP price-action.
Technical Perspective
EURGBP is sitting on a very important long term support level of .8306 currently. The level has underpinned the last four years’ worth of EURGBP price action, capped by the .9310 resistance level.
The last test of this level could prove to be a long term double top. If price breaks down below the .8306 level, the next level to watch will be the 8117 support.
US stock indices in over-the-counter trading plummeted today
On Friday, quotes of US stocks stocks fell for the second day in a row. This was facilitated by the growing number of patients with coronavirus and weak macroeconomic data. Markit US Manufacturing PMI in February turned out to be worse than expected and fell to a minimum since October 2013. The S&P 500 (-1.1%) and the Dow Jones Industrial Average (-0.78%) went down, the Nasdaq (1.8%) showed a decrease as well. Trading volume on US exchanges was 8% more than the 20-day average. On Monday morning, the situation in the global stock market worsened even more. The death toll from coronavirus reached 8 people in Iran, 7 people in South Korea and 3 people in Italy. In China, over the weekend, the number of patients increased by 4 thousand to 79.4 thousand. Futures for US stock indices fell this morning by an average of 2%. Today, no significant macroeconomic data are expected to be released in the United States. The ICE dollar index declined on Friday, but then rose on Monday. Investors buy US government bonds. Yield on 10-year securities fell to a minimum since July 2016 and reached 1.421%
European stock indices drop for the third day in a row
European stocks went down in value on Friday. More than others, the automotive sector fell by almost 2%. Investors fear a shortage of Chinese components, as they are produced in the Hubei province, which is dealing with the epidemic of coronavirus. Now the German DAX stock index is down 3.3%. The number of patients with coronavirus in Italy has reached 157 people. Italy takes the 3rd place in the world after China (79.4 thousand people) and South Korea (763 people). The biggest losers in Europe today are stocks of airlines, travel companies and luxury goods manufacturers. For example, quotations of the German airline Lufthansa have decreased by 7%. Some IFO Business Climate business indicators will be published in Germany today. The EUR / USD rate suspended the fall and is traded above the psychological level of 1.08.
Nikkei is not trading today in celebration of Emperor’s Day in Japan
Asian indices have descended today. The Chinese Shanghai Composite fell all in all 0.3%. Thanks to quarantine, the number of patients with coronavirus in China is not growing as much as before. Hang Seng Index dropped 1.8% today. The shares of the energy sector (-3.1%), IT (-3.1%), financial (-1.7%) and real estate companies (-1.4%) suffered the most. The Australian stock index S&P/ASX 200 collapsed by 2.2%. This is the maximum decline for a day since last August. Australian energy companies (-4%) became top losers. In particular, shares of Woodside Petroleum got cheaper by 6.4% amid falling global oil prices.
Quotations of Brent futures keep on falling on Monday approximately by 3%, as there are signs of the spread of the coronavirus epidemic outside of China. Investors fear that this will lead to the reduction of global demand. At the same time, there is a strong demand for gold, as investors consider it a protective asset. Gold quotes today rose by 4% and reached a 7-year high.
Note: This overview has an informative and tutorial character and is published for free. All the data, included in the overview, are received from public sources, recognized as more or less reliable. Moreover, there is no guarantee that the indicated information is full and precise. Overviews are not updated. The whole information in each overview, including opinion, indicators, charts and anything else, is provided only for familiarization purposes and is not financial advice or а recommendation. The whole text and its any part, as well as the charts cannot be considered as an offer to make a deal with any asset. IFC Markets and its employees under any circumstances are not liable for any action taken by someone else during or after reading the overview.
Investors remain complacent about an imminent Coronavirus-triggered market correction of up to 10 per cent, warns the CEO of one of the world’s largest independent financial advisory organizations.
The warning from deVere Group’s chief executive and founder, Nigel Green, comes as global equities registered losses on Monday following a surge in cases in Italy, Iran and South Korea over the weekend, and as the first cases are confirmed in Kuwait, Bahrain and Afghanistan.
Mr Green comments: “Global financial markets retreated on Monday as they reacted to the coronavirus headlines over the weekend. But it is likely that they will quickly rebound, as they have consistently done in recent weeks.
“Indeed, stocks keep on reaching record highs.
“This is because many investors remain complacent about the far-reaching impact of coronavirus, which is continuing to spread – and a faster pace. This will inevitably hit financial markets and investors’ complacency leaves many wide open to nasty surprises.”
He continues: “Major global companies, especially those with heavy exposure to the Chinese economy, are lowering profit guidances due to the outbreak. This will have a knock-on effect across international supply chains and throughout economies. But is the message being heard by investors?
“In addition, coronavirus has struck at a time when major economies, including Japan, Germany, India and Hong Kong are facing a downturn due to other factors such as the U.S.-China trade dispute and political protestors, which could hit the world economy.”
The deVere CEO goes on to add: “Until such time as governments pump liquidity into the markets and coronavirus cases peak, a near-term correction – of up to 10 per cent – is increasingly likely.
“We are hoping for a V-shaped recovery, but our current view is that it will be U-shaped.
“Against this backdrop and with the ongoing uncertainty over the direction of stocks and other risk assets, multi-asset portfolios might be favoured by global investors, given that they offer diversification of risk as well as of return.”
Nigel Green concludes with a warning: “Global markets are at high valuations and the impact of the coronavirus on profits appears largely underestimated.
“In general terms, stocks have hardly been deterred by the coronavirus outbreak. This complacency is concerning.
“Investors need to ensure that their portfolios are coronavirus-proofed as cases jump and a market correction looks more likely.”
About:
deVere Group is one of the world’s largest independent advisors of specialist global financial solutions to international, local mass affluent, and high-net-worth clients. It has a network of more than 70 offices across the world, over 80,000 clients and $12bn under advisement.
On Friday, the US dollar fell against a basket of major currencies. The dollar index (#DX) closed in the negative zone (-0.59%). This week, investors will follow the statements by Fed officials. Richard Clarida, Fed Vice Chairman, will speak at the Washington DC Economic Policy Conference on Tuesday, at which International Monetary Fund’s Chief Economist, Gita Gopinath, and President of Federal Reserve Bank of Cleveland, Loretta Mester, will also give a speech. Financial market participants monitor any news and announcements about the coronavirus.
On Saturday, financial officials from the 20 largest economies in the world called for a coordinated response to the outbreak of coronavirus. The International Monetary Fund (IMF) forecasts that coronavirus will reduce China’s GDP growth this year to 5.6% and reduce global GDP by 0.1%. On Sunday, China reported a decrease in the number of new cases again. However, there was an increase in cases in other countries. Thus, 160 new cases of the disease were recorded in South Korea, currently, more than 760 cases were registered, in Italy – more than 150 cases, and in Iran – 43.
The “black gold” prices are declining. Currently, futures for the WTI crude oil are testing the $51.35 mark per barrel.
Market indicators
On Friday, there was the bearish sentiment in the US stock market: #SPY (-1.03%), #DIA (-1.04%), #QQQ (-1.92%).
The 10-year US government bonds yield fell sharply. At the moment, the indicator is at the level of 1.38-1.39%.
The Economic News Feed for 24.02.2020:
– German IFO business climate index at 11:00 (GMT+2:00).
The Japanese yen fell sharply last week amid renewed concern that Japan could be on the brink of a recession. Speculations run high that the Bank of Japan may roll out further monetary stimulus in conjunction with the government’s fiscal package.
The yen could depreciate further if this week’s CPI confirms that economic weakness has outweighed its safe-haven status. The pair has met stiff resistance near the previous top of 112.30. A short-term consolidation is likely before the US dollar resumes its uptrend.
GBPUSD Finds Support Near November’s Low
The pound sterling has been in a sideways consolidation since last December’s election. Despite uncertainty around trade negotiations with its European partners, the UK seems to have enjoyed an economic recovery as business and consumer confidence have improved post-election.
Positive notes from Tuesday’s inflation hearings could heighten bets that rate cuts could be off the table, giving strong support to the currency. A breakout above 1.3050 could trigger a broader rally. On the downside, 1.2830 is a major support to maintain the bullish trend.
NZDCAD Slides as Sentiment Sours
In tandem with its trans-Tasman neighbor, the New Zealand dollar lost ground as investors flew to safety. Concerns over the economic impact from the coronavirus have put high-yield currencies like the NZ dollar under pressure.
Since China is the largest recipient of the country’s exports, absorbing 29% in 2019, its slowdown can only be detrimental to the kiwi.
Positive retail data next week may provide temporary salvation. As the pair grinds lower, the November low of 0.8350 is a key support. On the upside, a rebound could be challenged by the psychological price tag of 0.8500.
WTI Crude Struggles Amid Weak Demand
The US oil price recoups some losses from January’s heavy selling. The recovery is mostly technical-driven and could be short-lived. Market participants stay on their guard as reports of new cases of the epidemic are yet to recede.
In the meantime, contraction in factory activity from China and Japan is likely to curb demand. But oil producers have shown no rush to cut output.
This imbalance could continue to depress the crude price in the medium term. The price saw strong resistance at the 30-day moving average. 45.50 is the immediate target, while any meaningful rebound will need to break above 55.00.
By TheTechnicalTraders – Quite a bit of information can be gleaned from the US Treasury Yield Curve charts. There are two very interesting components that we identified from the Yield Curve charts below. First, the bottom in late 2018 was a very important price bottom in the US markets. That low presented a very deep bottom in the Yield Curve 30Y-10Y chart. We believe this bottom set up a very dynamic shift in the capital markets that present the current risk factor throughout must of the rest of the world. Second, this same December 2018 price bottom set up a very unique consolidation pattern on the 10Y-3Y Yield Curve chart. This pattern has been seen before, in late 1997-1998 and late 2005-2008.
The reality of these two patterns setting up in the Yield Curve charts suggests that the US and global markets are going to experience a surge in volatility and a very real potential that the US and global markets will contract over the next 6 to 24 months. Within about 3 to 6+ months of these patterns setting up, one of two separate outcomes typically takes place.
A. A continued US stock market price advance takes place pushing the Yield Curves lower and ultimately setting up a massive stock market top formation.
B. A moderate price peak sets up where the Yield Curve levels begin to rise from these current levels while the US and global stock markets begin a moderate correction phase – eventually leading into the possibility of a massive price collapse.
Our research team believes the deep price rotation near the end of 2018 set up a very unique capital shift event that took place within the global markets. Currently, there is well over $75 Trillion in the US and global markets. This capital has become enough of a force in the global markets to act as the “moon and the tide”. In a way, this capital, and the search for profits and safety, has propelled the global markets into a very fragile position.
This total amount of capital, in combination with the derivative markets and global credit markets, presents a significant risk for global central banks and nations. Many foreign nations have pushed their debt levels to well over 100% of GDP. Still, even more, have engaged in reckless lending and shadow banking practices that engage a further level of risk to the global markets. Global central banks have taken on excessive debt levels and acquired assets after 2009 in order to help stabilize the global markets. The combination of all of these facets of new capital, risk, and assets add a new dynamic to historical patterns in the Yield Curves.
Even though the patterns are similar in structure, the risks are far greater than in 2000 or 2008. Before, the Central Banks were like a ship navigating the Tides of the seas. Now, the Central Banks have become the Tides and the Moon – they are essentially an omnipresent force in all levels of assets, capital, risks, and contagion.
We believe the 30Y – 10Y yield curve may move slightly lower if any type of reprieve or complacency continues throughout the global markets that risk is not a factor going forward. This would suggest that the US stock market may continue to move a bit higher – possibly seeing the DOW breach the $30,000 level. Otherwise, we believe the Yield Curve may continue to climb suggesting that a global market peak is setting up and a price reversion event is beginning to take place.
This 10Y – 3Y Yield Curve chart highlights the potential for a brief collapse in this level to below ZERO, yet it is not necessary at this point in time to confirm a potential major market peak. Ideally, the future of the US and global stock markets depend on how these yield curves react at this juncture in time. A deeper move to levels below ZERO will suggest a broader market peak is setting up. A rally from these levels would suggest the peak has already set up and that real risk and fear are entering the global markets.
The NQ setup an Engulfing Bearish pattern after a very impressive rally from moderate rotation in December 2019. We highlighted the potential that the US markets are rallying to a peak in a number of research articles recently. The one we’ve included, below, is an excellent example of this type of research.
As we’ve been suggesting for many months, this is the time for skilled traders to become “cautious long traders”. This upside move could end in a very violent manner as the Moon and Tide shift suddenly as fear and central bank paralysis setup in the markets. We urge all our friends and followers to prepare for this eventual setup and to understand the total scope of this omnipresent capital/debt event. This time will certainly be different because Central Banks have become banker, holders, guarantor and leveraged participants in the future outcome.
Our suggestion is to plan to setup your portfolio so you have sufficient cash in reserve in the event of an unexpected market decline. We also suggest proper protection/hedge investments, such as precious metals and metals miner ETFs. Currently, this single Engulfing Bearish pattern is not enough of a trigger to warn of any immediate action for traders – but the Yield Curve charts are clearly showing us the markets will either continue to rally to an ultimate peak or begin to setup that peak very quickly from current levels.
Think of it this way, we know the music will likely stop at some point in the near future, we just don’t know exactly when it will stop. So, we have to prepare for the scramble for the chairs when it ends.
Join my Swing Trading ETF Wealth Building Newsletter if you like what you read here and ride my coattails as I navigate these financial markets and build wealth while others lose nearly everything they own.
On Friday, the EUR/USD currency pair moved away from three-year lows. Quotes updated local highs. Financial market participants have begun to fix greenback positions partially. Investors are still concerned about the spread of coronavirus outside of China. At the moment, the local support and resistance levels are 1.08000 and 1.08300, respectively. A trading instrument has the potential for further correction. We expect important statistics from Germany. We recommend opening positions from key levels.
The Economic News Feed for 24.02.2020:
At 11:00 (GMT+2:00), German IFO business climate index will be published.
Indicators do not give accurate signals: 50 MA has crossed 100 MA.
The MACD histogram is in the positive zone, but below the signal line, which gives a weak signal to buy EUR/USD.
Stochastic Oscillator is in the oversold zone, the %K line has crossed the %D line. There are no signals at the moment.
Trading recommendations
Support levels: 1.08000, 1.07800
Resistance levels: 1.08300, 1.08650, 1.09000
If the price fixes above 1.08300, further correction of EUR/USD quotes is expected. Movement is tending to 1.08600-1.08900.
An alternative could be a decrease in the EUR/USD currency pair to 1.07800-1.07500.
The GBP/USD currency pair
Technical indicators of the currency pair:
Prev Open: 1.28796
Open: 1.29448
% chg. over the last day: +0.70
Day’s range: 1.29338 – 1.29543
52 wk range: 1.1959 – 1.3516
GBP/USD quotes have been growing. The trading instrument has updated local highs. Currently, the British pound is consolidating. The key support and resistance levels are 1.29300 and 1.29800, respectively. The technical pattern signals a further correction of the GBP/USD currency pair. We recommend opening positions from key levels.
The publication of important economic releases from the UK is not planned.
Indicators do not give accurate signals: the price has crossed 100 MA.
The MACD histogram is in the positive zone, but below the signal line, which gives a weak signal to buy GBP/USD.
Stochastic Oscillator is in the neutral zone, the %K line is above the %D line, which indicates the bullish sentiment.
Trading recommendations
Support levels: 1.29300, 1.29000, 1.28500
Resistance levels: 1.29800, 1.30150, 1.30600
If the price fixes above the resistance level of 1.29800, further growth of GBP/USD quotes is expected. Movement is tending to 1.30150-1.30500.
An alternative could be a decrease in the GBP/USD currency pair to 1.29000-1.28700.
The USD/CAD currency pair
Technical indicators of the currency pair:
Prev Open: 1.32587
Open: 1.32508
% chg. over the last day: -0.26
Day’s range: 1.32430 – 1.32839
52 wk range: 1.2949 – 1.3566
There is the bullish sentiment on the USD/CAD currency pair. The trading instrument has set new local highs. Loonie approached the resistance level of 1.32900. The 1.32600 mark is already a “mirror” support. USD/CAD quotes have the potential for further growth. We recommend paying attention to the dynamics of “black gold” prices. Positions should be opened from key levels.
The news feed on Canada’s economy is calm enough.
Indicators signal the power of buyers: the price has fixed above 50 MA and 100 MA.
The MACD histogram is in the positive zone and above the signal line, which gives a strong signal to buy USD/CAD.
Stochastic Oscillator is in the overbought zone, the %K line has crossed the %D line. There are no signals at the moment.
Trading recommendations
Support levels: 1.32600, 1.32400, 1.32150
Resistance levels: 1.32900, 1.33250
If the price fixes above 1.32900, further growth of USD/CAD quotes is expected. The movement is tending to 1.33100-1.33300.
An alternative could be a decrease in the USD/CAD currency pair to 1.32300-1.32000.
The USD/JPY currency pair
Technical indicators of the currency pair:
Prev Open: 112.091
Open: 111.342
% chg. over the last day: -0.48
Day’s range: 111.317 – 111.682
52 wk range: 104.45 – 113.53
USD/JPY quotes have become stable after a sharp increase last week. Currently, the trading instrument is consolidating. There is no defined trend. The key support and resistance levels are 111.200 and 111.750, respectively. In the near future, a technical correction of the USD/JPY currency pair is not excluded. We recommend paying attention to the dynamics of the US government bonds yield. Positions should be opened from key levels.
Japan’s financial markets are closed due to the holiday.
Indicators do not give accurate signals: the price has fixed between 50 MA and 100 MA.
The MACD histogram is in the negative zone, which indicates the development of the correction movement.
Stochastic Oscillator is in the neutral zone, the %K line is above the %D line, which gives a signal to buy USD/JPY.
Trading recommendations
Support levels: 111.200, 110.750
Resistance levels: 111.750, 112.250, 112.500
If the price fixes below 111.200, USD/JPY quotes are expected to correct. Movement is tending to 110.800-110.500.
An alternative could be the growth of the USD/JPY currency pair to 112.200-112.500.
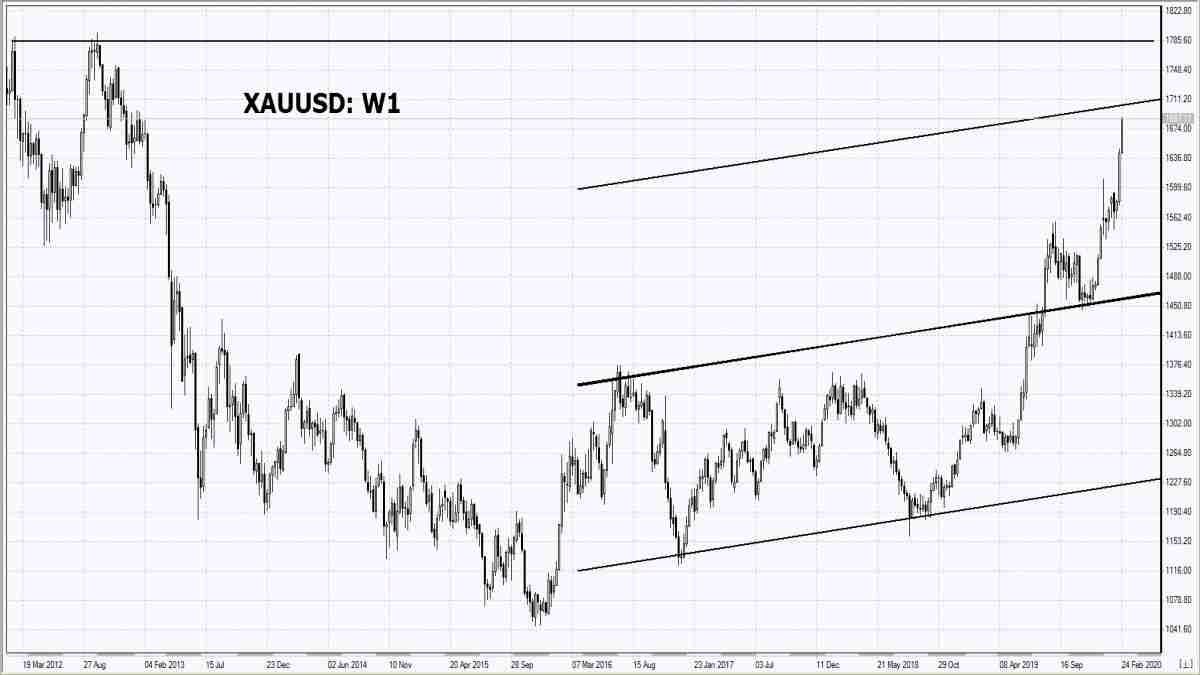
The demand for safe haven assets has understandably been amplified amid swirling concerns over the coronavirus outbreak. Gold has certainly lived up to its billing as a place of refuge, surging to levels not seen since Q1 2013 and is now testing the $1660 resistance level. Using the price action from 2012-2013 as reference, another leg up may bring the $1690 region into focus.
Bullion bulls have only gotten more tenacious since last week, as the coronavirus’ spread outside of China prompts market jitters about the duration and global footprint of this outbreak. Ultimately, market participants would want to know how much the coronavirus would impact global economic growth.
As things stand, Gold is on course for five consecutive days of gains, having climbed over nine percent so far this year. Until the spread of the coronavirus is contained, investors are likely to continue seeking shelter in Gold until the Covid-19 storm clouds disperse.
Coronavirus-related concerns to keep EURCHF’s downward trend intact
Covid-19 has given the Swiss Franc yet another reason to strengthen against the Euro, with EURCHF now testing the 1.06 psychological mark. Serving as a barometer of risk sentiment on the continent, the currency pair has weakened by some 2.3 percent so far in 2020. The Franc also boasts of a year-to-date advance against all G10 currencies except for the US Dollar.
With the China-dependent EU economy struggling to overcome these global uncertainties, it is unlikely that the Euro can stage a meaningful rebound against the safe haven CHF over the near-term.
Covid-19 erodes Yen’s safe haven status
Covid-19’s spread in Japan has upended the Yen’s status as a safe haven asset, with JPY having weakened against all Asian currencies so far in February, except for the Malaysian Ringgit. Although USDJPY has moderated since breaching the psychological 1.12 level, the Yen is still trading around its weakest levels against the US Dollar since May 2019.
With the number of confirmed cases in Japan now exceeding 130, the coronavirus is compounding Japan’s economic outlook. Investors will closely scrutinize Japan’s latest data on inflation, industrial production, jobs, and retail sales, all due this Friday (Feb 28), and set them against the latest domestic developments around Covid-19, in determining the Yen’s next moves.
Disclaimer: The content in this article comprises personal opinions and should not be construed as containing personal and/or other investment advice and/or an offer of and/or solicitation for any transactions in financial instruments and/or a guarantee and/or prediction of future performance. ForexTime (FXTM), its affiliates, agents, directors, officers or employees do not guarantee the accuracy, validity, timeliness or completeness, of any information or data made available and assume no liability as to any loss arising from any investment based on the same.
American consumers rang in the new year with a bit of an increase in spending. Some measures of discretionary spending were sluggish, while there was also a downward revision to the previous month’s data.
Headliner retail sales grew 0.3% on the month in 2020 up from a revised 0.2% previously. The data, however, failed to prop up the market sentiment.
Eurozone Flash PMI’s Rise Slightly in February
The forward-looking flash PMI data for the eurozone covering the services and manufacturing sector beat estimates by a small margin.
Data from IHS Markit showed that services activity rose to 52.8, while manfuacturing activity grew to 49.1. There was a notable pick up in the manufacturing activity from Germany.
EURUSD Rebounds but Will it Hold?
The common currency finally reversed the losses, closing on a bullish note on Friday. The rebound coincides amid signs of the EURUSD forming a bottoming pattern near 1.0800.
With price settling above the initial resistance level of 1.0840, there is scope for a pullback. As long as the current lows are not breached, the bias to the upside could improve.
UK Flash PMI’s Pick Up Momentum in February
Both measures of services and manufacturing activity for the United Kingdom grew in February. IHS Markit’s flash data saw manufacturing activity rising to 51.9, beating estimates of a decline to 49.7.
Meanwhile, services activity fell slightly to 53.3 for the period. Activity in the business is picking up steam after there was some certainty to the Brexit stalemate.
GBPUSD to Continue its Consolidation
Cable is expected to continue its consolidation. Following the rally which put the sterling back to the 1.2960 handle, there is scope for prices to retreat. The lower price level near 1.2879 will be important in the short-term.
If support forms here, we expect GBPUSD to breakout to the upside from the descending wedge pattern currently in play.
Gold Maintains Gains on Flight to Safety
The precious metal is outperforming the equities, reflecting the general market sentiment. Currently, economists continue to assess the global economic impact due to the Coronavirus outbreak. Major equity indices continue to decline as investors favor the safe-haven gold.
XAUUSD Rally Still Has Room to Grow
XAUUSD is keeping up with its bullish momentum as prices touched a new 7-year high on Friday. However, despite some modest pullback, price action could easily target the 1653.95 or 1654 handle in the near term.
This will mark the completion of the ascending triangle pattern formed on the monthly charts. To the downside, any pullback will be limited to the 1631 handle.
By Hussein Sayed, Chief Market Strategist (Gulf & MENA), ForexTime
Stocks in Asian markets were deep in the red on Monday, led by a 3% decline in South Korea’s Kospi index, as the country declared the highest state of alert, given the coronavirus infections surge. US stocks are pointing towards a sharp fall today, with the Dow futures declining 400 points, and European markets are also expected to kick off the week sharply lower.
Investors are no longer just worried about China’s economic health. The coronavirus has clearly become a global economic threat, with infections spreading to dozens of countries. The worldwide death toll has now climbed above 2,600, with 27 reported outside China. Italy’s number of confirmed cases surged from three on Friday to 152 on Sunday. Meanwhile, Iran has confirmed 43 cases, including 8 deaths. However, this is being questioned as the number of infected cases should be above 400, when the average mortality rate of the virus is around 2 percent.
It seems the risks over the past several weeks have been understated; that’s why the US and some European stocks were testing new highs. Investors have been betting on a V-shaped recovery, supported by central bank easing. It now looks like the easy money won’t be enough to offset the impact of the virus.
Last week, we mentioned in an article that asset correlations are no longer making sense, as all asset classes, whether they are stocks, bonds or precious metals, were moving in one direction, which is higher. Now, investors seem to realise that the risks of prolonged economic damage are higher than previously estimated, and this will undoubtedly have a severe impact on corporate earnings in the first quarter of 2020.
Gold tests a new seven-year high
Gold saw a sharp upward spike early Monday, rallying 2% to test a new seven-year high. It only looks like a matter of time before we see the precious metal breaching $1,700. While part of the rally is being based on speculative positioning, there are strong fundamentals supporting this move higher. Money coming out of equities has few other options to go to at this stage, especially given the low yield environment in fixed income.
US 10-year bond yields are currently hovering around 1.47% and 30-year yields have tested a new record low below 1.9%. This suggests that real interest rates are currently in negative territory, even the longer maturity ones. The deeper real rates fall, the more persistent the rally in gold can be, despite a strong Dollar. Expect to see the negative correlation between gold and the Dollar disappear, until the situation returns to normal.
Strong Dollar
The Dollar continues to be the traders’ favourite currency. While the US economy is not bulletproof against the spreading virus, it is still considered a stronger one compared to Europe or Japan. With Japan expected to fall into a recession and several European countries struggling even before the virus outbreak, the Dollar is a safer bet than the traditional safe haven Yen and Swiss Franc.
Disclaimer: The content in this article comprises personal opinions and should not be construed as containing personal and/or other investment advice and/or an offer of and/or solicitation for any transactions in financial instruments and/or a guarantee and/or prediction of future performance. ForexTime (FXTM), its affiliates, agents, directors, officers or employees do not guarantee the accuracy, validity, timeliness or completeness, of any information or data made available and assume no liability as to any loss arising from any investment based on the same.