Oil & Gas Explorer Proves Up Exciting Measured Oil and Gas Production from Orogrande Basin Project

The Energy Report

Source: Peter Krauth for Streetwise Reports   02/25/2020

Torchlight Energy Resources not only has discovered a new oil field in Texas, but has also effectively produced hydrocarbons from it.

Discovering a new oil field is a major accomplishment. But effectively producing hydrocarbons from that field is seen as a truly exceptional, massive success.

As you can probably imagine, it’s a rare occurrence.

So, when a small oil and gas exploration company reaches that milestone, investors are wise to pay very close attention.

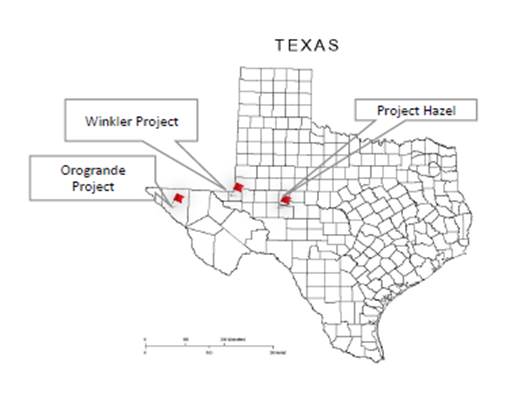
Right now the Orogrande Basin of West Texas is ground zero for just such a key discovery. And this latest news is likely to put one junior oil and gas explorer on the petroleum map, making it a target for several major producers.

It’s one big reason analyst Clive Maund told his subscribers he views this small-cap energy company as a “strong buy,” a call he reiterated on February 25 when he wrote, “Torchlight is rated an immediate buy as soon after the open as possible.”

Major Milestone to Catapult Oil & Gas Explorer

Torchlight Energy Resources Inc. (TRCH:NASDAQ) is a small-cap oil and gas explorer.

But don’t be misled, because the company controls a major play in the newly emerging West Texas Orogrande.

And as TRCH’s newest press release reveals, its latest results are off the charts. Torchlight just announced it has measured substantial Initial Potential (IP) oil and gas hydrocarbon recoveries from the recently drilled and completed Cactus A35 #1H well.

Greg McCabe, Torchlight’s chairman, stated, “. . .With the play consisting of 134,000 acres all under one D&D unit with University Lands, having oil and gas present in the hydrocarbon system is a major development for Torchlight and its shareholders.”

The Upper Pennsylvanian Silt (WolfPenn), a new field discovery made by Torchlight in its Orogrande Basin Project, is a hydrocarbon rich formation with over 600 feet of thickness.

Despite all the right markers, the first horizontal well drilled into this zone, the Founders A25 #1H well, encountered very high gas rates with almost no liquid hydrocarbons.

Gas rates reached over 2 million cubic feet per day, with a stabilized rate of 1.2 million cubic feet per day, from a small 1,000-foot frac interval. Extrapolated to a 10,000′ lateral, this well would be stronger than most Cotton Valley gas wells, and approaching many Haynesville gas wells.

Still, in the aftermath of those promising but inconclusive results, Torchlight hired a team of petroleum scientists, led by Mike Zebrowski.

Their task was to examine these incongruous gas well results. After all, the formation clearly appeared liquids rich.

They eventually concluded that the Wolfpenn displayed a dual porosity system, much like the Wolfbone and Wolfberry Plays of the Permian Basin. Interestingly, early wells in the western portion of Wolfbone encountered the same dichotomy of results, with wells making an inordinately high gas-to-liquids ratio compared to expectations created by the petrophysics.

Some larger operators, including EOG, Concho and Cimarex, realized that the solution was to perform a much larger frac, able to penetrate both porosity systems. That turned out to be exactly the right move. Spectacular results followed, with a large liquid hydrocarbon component being liberated, but also significantly higher gas rates in their wells.

On the basis of this analogy Torchlight drilled a short lateral into the Wolfpenn formation in the Cactus A35 #1H well. The company made the decision to only perforate a 100-foot interval and put a significantly larger frac on this well. Torchlight used 3,000 pounds per foot of sand instead of the 2,000 pounds per foot used on the Founders A25 #1H gas well.

The injection rates were increased from 60 barrels/minute to over 80 barrels/minute. As historically seen in the western Wolfbone wells, the results have proved the potential for high volumes of oil production.

The dual porosity system hypothesis turned out to be spot on, with oil and gas rates increasing significantly. To date, Torchlight’s peak 24 hour production rates are 15 barrels of oil per day (BOPD) and 110 thousand cubic feet per day (33 barrels of oil equivalent per day [BOEPD]). Equating this to a 10,000 foot lateral, the Cactus well can be extrapolated to make 1,500 BOPD and 11 million cubic feet per day potentially, or combined 3,300 BOEPD.

This type of well production has the potential to be significantly better than most Midland Basin wells from a moderate depth of only 5700 feet.

Persistence and Tenacity Pay Off

Management has spent the past three to four years drilling test wells to prove up this thesis, and to position itself for an eventual buyout from a petroleum major.

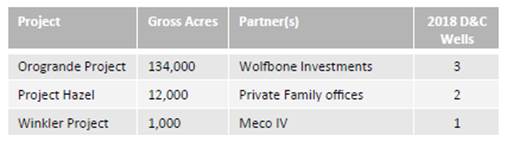
The initial significant news from Torchlight regarding the Orogrande Basin came in April last year. That’s when the company announced a new field discovery, along with a third party reserve estimate of 3.678 billion barrels in recovery potential from unconventional zones. TRCH has a 72.5% working interest in approximately 134,000 net acres.

Consulting geologist Rich Masterson is a recognized Permian Basin expert, and part of the company’s management team. He’s a brilliant geologist, credited with originating the Wolfbone Play, and developed the thesis for the Orogrande Basin (WolfPenn).

It’s hard to overstate how this latest news confirms a huge milestone.

Additional Discovery Potential

Despite its main focus on Orogrande, Torchlight has a couple of other interesting plays.

In the Midland Basin of West Texas (Project Hazel), TRCH controls about 12,000 gross acres (9,600 net acres), 100% of which will be operated. Its interest is 75% of net revenue.

19 contiguous sections with a potential of up to 300 horizontal drilling locations target the Wolfcamp A & B formations. To date, three vertical test wells have successfully drilled and verified horizontal potential, with horizontal drilling having started in June 2017.

The estimated potential, based on analogous Midland Basin EUR’s is 4 to 6 million barrels per section. Additionally, TRCH controls approximately 1,100 gross acres in the Delaware Basin, in Winkler County, West Texas.

Torchlight holds a 75% NRI on the project. 5,000- and 10,000-foot laterals can be drilled. The first well spud came in Q2 2018, and is currently producing from the Wolfcamp A interval. This project contains five prospective benches or “stacked pay zones,” where as many as 20 long laterals and potentially 19 short laterals can be drilled.

A Takeover Target in The Making

With Torchlight, the bottom line is this.

Its superb management team has the right skills to create shareholder value through successful organic growth, driven by science. They also have pertinent experience with top independent and integrated oil and gas companies.

Keith Kohl, editor of the Pure Energy Trader newsletter, said, “We know Torchlight has a tremendous amount of oil underground, and is currently courting some big suitors to take this multi-billion-barrel field off their hands.”

High insider ownership of 27% means management is clearly aligned with shareholders.

Over the last couple of months, the short position on the stock has looked like this.

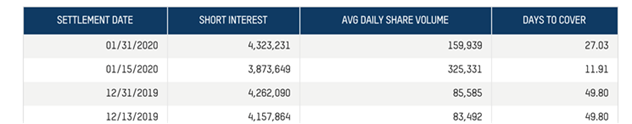
Given the company’s latest news, demand for shares could well blow up this huge short position, causing shares to scream higher. All the while, big boy oil and gas producers must be circling.

In my view, Torchlight not only has the goods, it’s conclusively demonstrated its production potential.

Now’s the time to buy Torchlight, whose shares have the potential to trade at a multiple of current levels in very short order.

Peter Krauth is a former portfolio adviser and a 20-year veteran of the resource market, with special expertise in energy, metals and mining stocks. He has been editor of a widely circulated resource newsletter, and contributed numerous articles to Kitco.com, BNN Bloomberg and the Financial Post. Krauth holds a Master of Business Administration from McGill University and is headquartered in resource-rich Canada.

Sign up for our FREE newsletter at: www.streetwisereports.com/get-news

Disclosure:
1) Peter Krauth: I, or members of my immediate household or family, own shares of the following companies mentioned in this article: None. I personally am, or members of my immediate household or family are, paid by the following companies mentioned in this article: Torchlight Energy. My company has a financial relationship with the following companies mentioned in this article: None. I determined which companies would be included in this article based on my research and understanding of the sector.
2) The following companies mentioned in this article are billboard sponsors of Streetwise Reports: Torchlight Energy. Click here for important disclosures about sponsor fees. As of the date of this article, an affiliate of Streetwise Reports has a consulting relationship with Torchlight Energy. Please click here for more information. An affiliate of Streetwise Reports is conducting a digital media marketing campaign for this article on behalf of Torchlight Energy. Please click here for more information. The information provided above is for informational purposes only and is not a recommendation to buy or sell any security.
3) Statements and opinions expressed are the opinions of the author and not of Streetwise Reports or its officers. The author is wholly responsible for the validity of the statements. The author was not paid by Streetwise Reports for this article. Streetwise Reports was not paid by the author to publish or syndicate this article. Streetwise Reports requires contributing authors to disclose any shareholdings in, or economic relationships with, companies that they write about. Streetwise Reports relies upon the authors to accurately provide this information and Streetwise Reports has no means of verifying its accuracy.
4) This article does not constitute investment advice. Each reader is encouraged to consult with his or her individual financial professional and any action a reader takes as a result of information presented here is his or her own responsibility. By opening this page, each reader accepts and agrees to Streetwise Reports’ terms of use and full legal disclaimer. This article is not a solicitation for investment. Streetwise Reports does not render general or specific investment advice and the information on Streetwise Reports should not be considered a recommendation to buy or sell any security. Streetwise Reports does not endorse or recommend the business, products, services or securities of any company mentioned on Streetwise Reports.
5) From time to time, Streetwise Reports and its directors, officers, employees or members of their families, as well as persons interviewed for articles and interviews on the site, may have a long or short position in securities mentioned. Directors, officers, employees or members of their immediate families are prohibited from making purchases and/or sales of those securities in the open market or otherwise from the time of the interview or the decision to write an article until three business days after the publication of the interview or article. The foregoing prohibition does not apply to articles that in substance only restate previously published company releases. As of the date of this article, officers and/or employees of Streetwise Reports LLC (including members of their household) own securities of Torchlight Energy, a company mentioned in this article.

Additional disclosures
Clive Maund does not own shares of Torchlight Energy and neither he nor his company has a financial relationship with the company.

Keith Kohl: I, or members of my immediate household or family, own shares of the following companies mentioned in this article: I am a shareholder of Torchlight Energy Resources. I personally am, or members of my immediate household or family are, paid by the following companies mentioned in this article: None. My company currently has a financial relationship with the following companies mentioned in this article: None.

( Companies Mentioned: TRCH:NASDAQ,
)

SUGAR Analysis: Cheap oil can reduce bio-ethanol production in Brazil

By IFCMarkets

Cheap oil can reduce bio-ethanol production in Brazil

In Brazil biofuels and sugar are produced from sugarcane. Therefore, in a period of low world oil prices, Brazilian farmers are reducing the production of bioethanol and increasing sugar production. In addition, the weakening of the Brazilian real is also a bearish signal for sugar, which is being traded now near a 2-year high. Brazil is the world leader in sugar production with a share of about 20%. India is the 2nd largest sugar producer in the world and the largest consumer at the same time. The Indian Sugar Mills Association (ISMA) raised its forecast for sugar production in India in the 2019/20 season from 26 million tons to 26.5 million tons. At the same time, the surplus of sugar in 2020-2021 may amount to 6 million tons. The Indian government can encash this volume in the global market.

IndicatorVALUESignal
RSISell
MACDSell
MA(200)Neutral
FractalsSell
Parabolic SARSell
Bollinger BandsSell


Summary of technical analysis

OrderSell
Buy stopBelow 14,4
Stop lossAbove 15,4

Market Analysis provided by IFCMarkets

Silver in a Pandemic – Will It Protect? Watch the Second Wave

By FirstMacroCapital – 4 Pandemics – Watch the Second Wave.

While attention is focused on the overall scale of COVID-19, from many of the leading specialists at Imperial College, Hong Kong University, and Harvard University. If this is a pandemic, which looks more and more likely by the day. Where is this pandemic currently in the pandemic cycle? Is it early in the cycle? Halfway through the cycle? Or is it at the end of the cycle?

If we take the Ray Dalio principle, “Wherein history has this happened before?”. Many times, we have to go back in time where the current generation experiencing a difficult event wasn’t even alive when the past event occurred or was too young to be aware of it.  What historical examples can we look at, to see what has happened during past pandemic waves? The Government of New Zealand in their pandemic preparation has put together an analysis of four major pandemics going back more than 130 years.

While the first wave gets everyone’s attention as a pandemic takes hold. Commonly there is a second and third wave that has been far more serious than the first wave.  As the former FDA Chair, Dr. Scott Gottlieb said in a recent interview, “the next 2-4 weeks will be the most important to see what happens next”. If history repeats, it will be the second wave that is most concerning.

Will silver be a store of value for investors if COVID-19 escalates further?

During the 1889-1892 pandemic, silver prices rose during the first phase of the pandemic to a high of $1.06/oz in 1890. As the pandemic got worse in 1891, the silver price then fell and continued to fall until the end of the pandemic in 1892.

The Spanish Flu saw the silver price accelerate during this time period, from $0.90 at the end of 1917, to a high of $1.36/oz by March 1919 when the pandemic finally subsided.

During the multi-year pandemic from 1957-1963, we saw silver prices rise from $0.91/oz to $1.31/oz in July 1963. The silver price did not rise until there was a pause in the pandemic between the second and final, third wave.

In the 1968-1970 pandemic, we saw the silver price fall initially from $2.34/oz to a low of $1.98/oz as the first wave took hold, before accelerating to a high of $2.75/oz during the summer months of 1968 before the second and final wave took hold in the winter of 1968 and in 1969. This final wave took the silver price down throughout the second wave. Silver bottomed at $1.69/oz in June of 1969. Mixed results throughout the pandemic in 1968-1970.

During this first phase of the COVID-19, we have seen silver head higher, but it is still early days.

Gold was pegged during all four of the pandemics outlined, and we view gold as being treated more like a currency today, particularly as we enter 2020-Q2, where we see slowing GDP growth and slowing inflation, pushing real rates down. Real rates falling is positive for gold.

  • Silver is not guaranteed to protect one’s wealth during a pandemic, as history has highlighted mixed results. It may provide trading opportunities.
  • A weakening home currency in countries that are negatively impacted by the pandemic could see silver prices rise in their home currency.
  • Slowing industrial demand will push demand for silver down, though if mines have to shut because towns that support mines could be impacted by the virus, then this will create shortages for silver. Still too early days to see what will happen. Slowing industrial demand seems more likely with PMIs continue to crash even before they took into account the impact of the virus. Shortages are a more wait and see.
  • Gold may be a better place to protect one’s wealth during a pandemic.
  • US Dollar? Possibly – The US Dollar rose as the tech cycle ended in 2000, which looks increasingly likely the tech cycle is ending in 2020 with Apple’s recent warning on shipments and temporarily shutting down stores.
  • Bitcoin? Possible

About the Author:

Paul Farrugia, BCom. Paul is the President & CEO of First Macro Capital. He helps his clients take advantage of cycle opportunities across all sectors and asset classes, for the long-term. He provides a checklist to find winning gold and silver mining producer stocks, to take advantage of the commodity cycle.

Disclaimer:

The information contained herein is obtained from sources believed to be reliable, but its accuracy cannot be guaranteed. It is not designed to meet your financial situation – we are not investment advisors, nor do we give personalized investment advice. The opinions expressed herein are those of the publisher and are subject to change without notice. It may become outdated, and there is no obligation to update any such information.


Japanese Candlesticks Analysis 27.02.2020 (GOLD, NZDUSD, GBPUSD)

Article By RoboForex.com

XAUUSD, “Gold vs US Dollar”

As we can see in the H4 chart, the ascending tendency continues. After breaking the channel’ upside border and completing a Harami reversal pattern, XAUUSD has reversed; right now, it is still moving upwards. In this case, the upside target is at 1690.04. However, one shouldn’t ignore another scenario, according to which the instrument may return towards 1636.30.

GOLD
Risk Warning: the result of previous trading operations do not guarantee the same results in the future

NZDUSD, “New Zealand vs. US Dollar”

As we can see in the H4 chart, the descending channel continues. After completing an Inverted Hammer reversal pattern close to the support level, NZDUSD is reversing. We may assume that later the price may reverse, correct towards the channel’s upside border, and then resume falling. In this case, the downside target may be at 0.6248. At the same time, one shouldn’t exclude an opposite scenario, according to which the instrument may grow to return to 0.6355.

NZDUSD
Risk Warning: the result of previous trading operations do not guarantee the same results in the future

GBPUSD, “Great Britain Pound vs US Dollar”

As we can see in the H4 chart, GBPUSD has formed several reversal patterns close to the support level, such as Inverted Hammer. Possibly, the pair may reverse and return to 1.3011. Later, the market may continue growing towards the next resistance level. However, there is another scenario, which implies that the instrument may fall to reach 1.2817.

GBPUSD

Article By RoboForex.com

Attention!
Forecasts presented in this section only reflect the author’s private opinion and should not be considered as guidance for trading. RoboForex LP bears no responsibility for trading results based on trading recommendations described in these analytical reviews.

Ichimoku Cloud Analysis 27.02.2020 (AUDUSD, NZDUSD, USDCAD)

Article By RoboForex.com

AUDUSD, “Australian Dollar vs US Dollar”

AUDUSD is trading at 0.6554; the instrument is moving below Ichimoku Cloud, thus indicating a descending tendency. The markets could indicate that the price may test Tenkan-Sen and Kijun-Sen at 0.6605 and then resume moving downwards to reach 0.6480. Another signal to confirm further descending movement is the price’s rebounding from the resistance level. However, the scenario that implies further decline may be canceled if the price breaks the cloud’s upside border and fixes above 0.6625. In this case, the pair may continue growing towards 0.6705.

AUDUSD
Risk Warning: the result of previous trading operations do not guarantee the same results in the future

NZDUSD, “New Zealand Dollar vs US Dollar”

NZDUSD is trading at 0.6293; the instrument is moving below Ichimoku Cloud, thus indicating a descending tendency. The markets could indicate that the price may test the cloud’s downside border at 0.6305 and then resume moving downwards to reach 0.6240. Another signal to confirm further descending movement is the price’s rebounding from the descending channel’s upside border. However, the scenario that implies further decline may be canceled if the price breaks the cloud’s upside border and fixes above 0.6355. In this case, the pair may continue growing towards 0.6445.

NZDUSD
Risk Warning: the result of previous trading operations do not guarantee the same results in the future

USDCAD, “US Dollar vs Canadian Dollar”

USDCAD is trading at 1.3338; the instrument is moving above Ichimoku Cloud, thus indicating an ascending tendency. The markets could indicate that the price may test Tenkan-Sen and Kijun-Sen at 1.3290 and then resume moving upwards to reach 1.3425. Another signal to confirm further ascending movement is the price’s rebounding from the support level. However, the scenario that implies further growth may be canceled if the price breaks the cloud’s downside border and fixes below 1.3225. In this case, the pair may continue falling towards 1.3155.

USDCAD

Article By RoboForex.com

Attention!
Forecasts presented in this section only reflect the author’s private opinion and should not be considered as guidance for trading. RoboForex LP bears no responsibility for trading results based on trading recommendations described in these analytical reviews.

Currency Majors Show a Variety of Trends. Investors Expect Negotiations Between the EU and the UK

by JustForex

The US dollar shows mixed results against a basket of major currencies. The dollar index (#DX) closed with a slight increase (+0.04%). Traders are closely monitoring the spread of COVID-19. WHO said yesterday that coronavirus spread outside of China much faster than in the country itself. On Thursday, the authorities of the world expanded measures to combat the potential pandemic of the coronavirus. The United States and South Korea have postponed joint military exercises to limit the spread of the virus that appeared late last year in China.

Trading activity and volatility on currency pairs with the Euro and the British pound increased significantly before trade negotiations between the UK and the EU, which are scheduled for March 2. However, traders are still worried that the recent harsh rhetoric on both sides could make negotiations unlikely to go smoothly. Michel Barnier, the EU’s Chief Negotiator, said the bloc would not agree to the deal “at any price.”

The “black gold” prices have continued to decline. At the moment, futures for the WTI crude oil are testing the $47.80 mark per barrel.

Market indicators

Yesterday, there was a variety of trends in the US stock market: #SPY (-0.37%), #DIA (-0.35%), #QQQ (+0.52%).

The 10-year US government bonds yield fell sharply again. At the moment, the indicator is at the level of 1.29-1.30%.

The Economic News Feed for 27.02.2020:
  • – Statistics on durable goods orders in the US at 15:30 (GMT+2:00);
  • – US GDP data at 15:30 (GMT+2:00);
  • – Pending home sales in the US at 17:00 (GMT+2:00).

by JustForex

PRECIOUS METALS INVESTOR ALERT: Prices Are Heading Into An Entirely New Market

By Money Metals News Service

The Global Financial System is now under severe stress. While there have been many factors leading to up to this point, the situation that is unfolding in China and abroad seems to be speeding up the process. Yesterday, the market got a small WHIFF or WOKE up a TAD in regards to a global contagion and soon to be the rapid contraction of the JIT – Just In Time Inventory Supply Chain System.

Even though the Dow Jones Index lost 1,031 points on Monday and another 400+ points so far today, this is mere peanuts when we take into account what is coming in the following weeks and months ahead. Because China accounts for 21% of Global GDP and it supplies a lot of goods, parts, and consumables around the planet, a severe contraction will impact the rest of the world in short order.

But, what if this contagion spreads further to other countries as we see in Iran and Italy?? Then, we are talking about a much more severe systemic problem. And according to my research these past 3-4 days, it’s much worse than I previously thought. I don’t plan on doing any updates on this contagion, as many others are more qualified. However, I will be posting some information as it pertains to the global economy and financial system.

The one thing that I will share is that if you want to wait to prepare for this until some local, state, or regional government comes in and locks down your town, city, or area… then you are behaving UNWISELY. Of course, the situation may not get that bad, but there is nothing wrong with a little insurance, just in case.

The Precious Metals Will Do Did Exactly What They Were Designed To Do… PROTECT WEALTH

At the peak yesterday, Gold was up $40, and silver jumped $0.45. And all this took place when the Dow Jones Index was down 1,000+ points. I believe this is just a preview for much BIGGER PRECIOUS METALS PRICE MOVES to come.

While the gold and silver prices lost most of their gains toward the end of trading on Monday and further today, it probably had to do with profit-taking by the supposed “KEEN” traders who locked in some gains. In time, the idea of locking in gold and silver trading profits will become a distant memory as the world transitions into owning and trading physical precious metals. Thus, physical ownership and trading will replace the game of highly-leveraged paper shuffling.

But, we aren’t t there yet because the market still believes that DEBTS are ASSETS and PAPER MONEY is real.

Today, it looks like the markets are getting another WHIFF of the contagion as the Dow Jones Index is down another 400+ points. Again, this is mere peanuts for what’s in store ahead.

Let’s take a brief look at the monthly gold and silver price charts.

Gold Price - Feburary 24, 2020 (Monthly Chart)

As we can see, gold has broken above the important $1,550-$1,560 level, which will likely be the new support level. Several months ago, I thought we could see gold retrace back down to the $1,360 support area, but it looks like the market had other plans. No complaint here whatsoever.

The gold price could correct lower, or move sideways, but as the global supply chain contagion continues to spread, I believe we are going to see the price move higher. So, the next important level for gold is $1,800. But, when gold finally goes above the all-time high of $1,900, it’s OFF TO THE RACES.

We can see that already taking place in the gold price in the EURO:

Gold Price Euro - Feburary 24, 2020 (Monthly Chart)

My associate put together a series of charts, and this is one of them. As we can see, the gold price in the Euro finally broke through the seven-year $1,400 resistance level and is now trading at an ALL-TIME HIGH. I see the same thing taking place with Gold in Dollars, and we may see it sooner than later due to the current situation in the markets.

As for silver, there is a TRADING WAR taking place at the important $18.50 Resistance Level. Once silver breaks through this level and closes above it on a monthly basis, I believe it will quickly move up to the next resistance level of $21.50:

Silver Price - Feburary 24, 2020 (Monthly Chart)

Even though the silver price sold off today, it’s all due to speculative paper trading. Think about it. Would someone want paper contracts worth 50 surgical masks, or would they want 50 surgical masks? Don’t let the paper price of silver bother you. It will come down to how many ounces you own.

Okay, now that I showed you the technical charts based on paper trading, I believe in time physical demand will become the leading driver of price… NOT PAPER CONTRACTS. However, we aren’t there yet. And, if we look at the current COT Report charts, the commercials hold a record number of short positions:

Silver COT Report

Silver COT Report

Gold COT Report

Gold COT Report

In looking at these charts, we shouldn’t be surprised to see a correction in the gold and silver prices. However, it’s not a guarantee, especially in the present circumstances. Regardless, this is just a short-term setup that won’t matter in the coming months and years ahead.

ALERT: The Precious Metals Heading Into An Entirely New Market

Looking into the future, I see the precious metals heading into an entirely new market, much different than today. My past analysis has based this on our future energy predicament, but it seems that this current contagion is speeding up the process… IN A BIG WAY.

With Chinese oil consumption reported to be down 20% since the early part of February, how bad is it now?? In my recent article, I stated it was likely down by at least 50%, or 7 million barrels per day (mbd):

China Total Oil Demand 2017-2020 Forecast & Estimated Decline February 2020

This makes perfect sense when we look at the following three charts from Capital Economics that are circulating in the media:

Daily Property Sales in 30 Major Cities in China (Thousand Units)

Daily Passenger Traffic in China

Average Road Congestion Across 100 Cities in China

While the Chinese Oil industry may continue to import oil, refine it, and then store it as finished products, the economy isn’t consuming it. So, if the IEA is forecasting that China’s oil demand will be down 435,000 barrels per day (bd) in Q1 2020, I wonder what planet they are receiving their data or maybe what they might be smoking. Again, Bloomberg reported a 20% decline in demand, 3 million barrels per day at the beginning of February. And, if we look at the charts above, China’s daily passenger traffic is still down about 80%.

So, if we conservatively say that China’s oil demand is down 50%, or 7 mbd, even if the country turns everything around in March, there is no way it will be down 435,000 bd during the first quarter of 2020, as the IEA (International Energy Agency) forecasts. Why? Let’s do some simple math:

China’s Estimated Oil Demand

Jan 2020 = 13.5 mbd

Feb 2020 = 7 mbd

Mar 2020 = 14 mbd

Avg Q1 2020 = 11.5 mbd

If we subtract 11.5 mbd from 13 mbd for Q1 2019, that equals a decline of 1,500,000 bd for Q1 2020, not the 435,000 bd stated by the IEA. Now, I don’t believe China consumed 13.5 mbd in January because if you look at the chart above, passenger traffic was also down considerably in the last week of the month. Note, these are just my approximations. Again, even if China’s Oil Industry is importing oil and refining products, the Chinese people aren’t consuming much gasoline, diesel, or jet fuel.

BINGO… outcomes this article today, No Financing And No Demand: Chinese Refiners Run Into Trouble:

Refiners, both private and state, have already reduced their run rates in response to the slump in fuel demand resulting from the outbreak, and now they have deepened these cuts, Bloomberg reported last week.

What happens if the situation in China doesn’t improve in March. PSA, an automobile manufacturer in China, just announced it is extending the shutdown of its auto-plant until March 12th. Even if the Chinese people return to work in March, how many are going to show up?? I doubt China’s oil demand in March will reach anymore than 9-10 mbd at most. If this is true, then total oil demand for China would be closer to 10 mbd in Q1 2020, or 3 mbd less, nearly seven times lower than the forecast by the IEA.

There is no way the current oil price trading at $50.70 (WTIC) has priced in this dynamic. Thus, even if the situation improves in China during March, the current oil price hasn’t factored in a decline of approximately 1.5 mbd off the market in Q1 2020. And what if the situation in China doesn’t improve?? Then we could see an even larger decline in China’s oil demand of 3+ mbd. That should do wonders for the oil price WHEN THE MARKET FINALLY WAKES UP.

So, getting back to the precious metals. What does all this mean?? As I have stated for the past few years, the coming ENERGY CLIFF would destroy the value of most financial assets. While I thought this might be a few years away, the present contagion just might speed the time-table up a bit. If the oil price continues to contract down to the $40s and $30s, that should be the final NAIL IN THE COFFIN for the U.S. Shale Oil Industry… for good.

PRECIOUS METALS ALERT: Be prepared for investors to significantly increase their purchases of physical gold and silver. Demand could go crazy in a relatively short period of time. This is what happens when individuals realize overnight they need something quickly. Here’s a picture of a long line of people in South Korea waiting to get into the supermarket:

Long Lines for Masks in S. Korea

Of course, getting enough food, protective masks, and supplies is the priority, but what happens when financial assets and money become problematic?? People still need to use money, or what behaves as money. I have no idea what the future holds, but if we continue to see a serious contraction of the global supply chain, then it’s very wise to own some physical gold and silver.


The Money Metals News Service provides market news and crisp commentary for investors following the precious metals markets.

The Analytical Overview of the Main Currency Pairs on 2020.02.27

by JustForex

The EUR/USD currency pair

Technical indicators of the currency pair:
  • Prev Open: 1.08804
  • Open: 1.08823
  • % chg. over the last day: +0.05
  • Day’s range: 1.08776 – 1.09179
  • 52 wk range: 1.0879 – 1.1572

The EUR continued its growth against the greenback. The EUR/USD quotes updated the local highs again. At the moment the trading instrument is testing resistance at 1.09150. The mark 1.08850 is already a mirror support. The Euro has a potential for further strengthening. Investors are closely monitoring the situation with the coronavirus COVID-19 spreading outside China. Today, participants of financial markets will assess important economic releases from the USA. Positions need to be opened from key levels.

The Economic News Feed for 27.02.2020:

  • – Report on orders for durable goods (US) – 15:30 (GMT+2:00);
  • – GDP report (US) – 15:30 (GMT+2:00);
  • – Pending home sales report (US) – 17:00 (GMT+2:00);
EUR/USD

The indicators signal the strength of buyers: the price has fixed above 50 MA and 100 MA.

MACD histogram is in the positive zone and above the signal line, which gives a strong signal to buy EUR/USD.

The Stochastic Oscillator is in the neutral zone, the %K line is below the %D line, which indicates a bearish sentiment.

Trading recommendations
  • Support levels: 1.08850, 1.08600, 1.08300
  • Resistance levels: 1.09150, 1.09500

If the price fixes above 1.09150, expect further growth of EUR/USD toward 1.09500-1.09700.

Alternatively, the quotes could descend toward 1.08600-1.08400.

The GBP/USD currency pair

Technical indicators of the currency pair:
  • Prev Open: 1.30053
  • Open: 1.28956
  • % chg. over the last day: -0.77
  • Day’s range: 1.28949 – 1.29379
  • 52 wk range: 1.1959 – 1.3516

The GBP/USD currency pair has gone down. Yesterday the drop in quotes exceeded 100 points. GBP reached the round level of 1.29000. The local resistance is at the level of 1.29400. The technical pattern signals a further decrease in the trading instrument. Today the statistical data on the US economy is in the spotlight. We recommend opening positions from key levels.

The Economic News Feed for 27.02.2020 is calm.

GBP/USD

The indicators signal the sellers’ strength: the price has fixed below 100 MA.

The MACD histogram is in the negative zone, but above the signal line, which gives a weak signal to sell GBP/USD.

The Stochastic Oscillator is located in the overbought zone, the %K line crossed the %D line. There are no signals at the moment.

Trading recommendations
  • Support levels: 1.29000, 1.28500
  • Resistance levels: 1.29400, 1.29750, 1.30150

If the price fixes above resistance level 1.29400, correction of GBP/USD quotes is expected to 1.30000.

Alternatively, the quotes could descend toward 1.28700-1.28400.

The USD/CAD currency pair

Technical indicators of the currency pair:
  • Prev Open: 1.32787
  • Open: 1.33292
  • % chg. over the last day: +0.49
  • Day’s range: 1.33247 – 1.33475
  • 52 wk range: 1.2949 – 1.3566

The USD/CAD currency pair has moved up again. During yesterday’s and today’s trades the growth of quotations exceeded 60 points. The trading instrument has set new local highs. The CAD found resistance at 1.33450. The mark 1.33100 is already a mirror support. The Canadian dollar continues to be under pressure from the negative dynamics of oil prices. The USD/CAD quotes can grow further. Positions should be opened from key levels.

The Economic News Feed for 27.02.2020 is calm.

USD/CAD

The indicators signal the strength of buyers: the price has fixed above 50 MA and 100 MA.

MACD histogram is in the positive zone, which indicates a bullish sentiment.

The Stochastic Oscillator is in the neutral zone, the %K line is below the %D line, which gives a sell signal for USD/CAD.

Trading recommendations
  • Support levels: 1.33100, 1.32700, 1.32450
  • Resistance levels: 1.33450, 1.33800

If the price fixes above 1.33450, expect further growth of USD/CAD quotes ito 1.33800-1.34000.

Alternatively, the quotes could descend toward 1.32800-1.32600.

The USD/JPY currency pair

Technical indicators of the currency pair:
  • Prev Open: 110.196
  • Open: 110.401
  • % chg. over the last day: +0.49
  • Day’s range: 109.967 – 110.457
  • 52 wk range: 104.45 – 113.53

USD/JPY stabilized after a prolonged decline. At the moment the trading instrument is in sideways movement. USD/JPY quotes are testing the round level of 110.000. The mark 110.500 is the nearest resistance. Demand for safe haven currencies is still at a high enough level. Investors estimate the risks of further coronavirus spreading from China. Today, we recommend that you pay attention to the economic reports, as well as the dynamics of yield on U.S. government securities. Positions should be opened from key levels.

The Economic News Feed for 27.02.2020 is calm.

USD/JPY

The indicators signal the sellers’ strength: the price has fixed below 50 MA and 100 MA.

MACD histogram is in the negative zone, which gives a sell signal for USD/JPY.

The Stochastic Oscillator started to exit the oversold zone, the %K line is above the %D line, which indicates a correction of the USD/JPY currency pair.

Trading recommendations
  • Support levels: 110.000, 109.650
  • Resistance levels: 110.500, 110.700, 111.100

If the price fixes below the round 110.000, expect the quotes to fall 1.09700-1.09400.

Alternatively, the quotes could grow toward 110.800-111.100.

by JustForex

SPY Breaks Below Fibonacci Bearish Trigger Level

By TheTechnicalTradersOur research team wanted to share this chart with our friends and followers.  This dramatic breakdown in price over the past 4+ days has resulted in a very clear bearish trigger which was confirmed by our Adaptive Fibonacci Price Modeling system.  We believe this downside move will target the $251 level on the SPY over the next few weeks and months.

Some recent headline articles worth reading:

On January 23, 2020, we issued a warning that the Put/Call ratio was warning of a potential Flash Crash

On January 24, 2020, we issued a research post related to the Wuhan Wipeout the markets

On January 26, 2020, we issued this research post about the start of a Black Swan event

On January 29, 2020, we issued this research post about a potential WaterFall selloff

Clearly, we were well ahead of this correction and issued multiple warnings to our friends and followers. This week we locked in 9.48% on GDXJ at the open on Monday, and today we are writing to suggest that $251 on the SPY is real support (see the magenta/purple area/line on this chart) and pay attention to the real risks at play in the markets.

This would suggest that the major markets will wipe out about 25% of the valuations in the major averages (ES, NQ, and YM), before finding any real support.  Obviously, there is a level near $208 that appears in RED on this chart.  If $251 fails to hold as support, then we immediately start to look at that $208 level for ultimate support.

This is the time when you want skilled researchers and traders backing you up and sourcing real solid trade opportunities for you.  We’ve been warning about this move for many months, suggesting that 2020 was going to be an incredible year for skilled traders and warning that a large downside price rotation was likely after August 2019.

In fact, one of our researchers predicted this move back in February/March 2019.  Visit TheTechnicalTraders.com to learn how we can help you stay ahead of these massive trends and find real opportunities in the markets.

Make sure to opt-in to our free market trend signals newsletter before closing this page so you don’t miss our next special report!

Chris Vermeulen
TheTechnicalTraders.com

For the first time, new cases of coronavirus infection within China were fewer than beyond its borders

By IFCMarkets

Today, futures for US stock indices are “in the red” for the 6th day successively

On Wednesday, quotes of US stocks mostly closed “in the red”, despite sluggish correction attempts. US President Donald Trump said that the risks of the coronavirus epidemic are quite low and the media overestimate them. Besides that, indicators of the American real estate market ended up positive. However, the S&P 500 (-0,38%) and Dow Jones Industrial Average (-0,46%), fell on Wednesday and only Nasdaq (+0,17%) managed to increase a bit. The indices lost 8-8.5% from their recent historical highs. On Wednesday, trading volume on US exchanges decreased by 3.8% compared with Tuesday’s numbers and amounted to 11.86 billion shares. This is 44% more than the average for 20 days. This morning U.S. Centers for Disease Control and Prevention confirmed the infection of a California resident who hadn’t been to countries exposed to coronavirus. This triggered a decline in futures for US stock indexes. Important economic data will be published in the US today: Durable Goods Orders for January and 4th quarter GDP in 2nd reading, as well as home sales on the secondary market. Reports of new cases of coronavirus in the United States (California) contributed to a resumption of the ICE US dollar index decline.

European stock indexes today resumed their fall after a slight correction

European stocks yesterday were being traded without a single trend. The sectors of utilities and automobile production turned out to be the top gainers. This was due to good reporting by the Spanish electricity distribution company Iberdrola SA and the French automaker Peugeot SA. Today, the drop of European stock indices recommenced. This was facilitated by the further spread of coronavirus, as well as forecasts of a decline in profit of Standard Chartered beer producer Anheuser-Busch InBev. Both of them work intensively in epidemic-affected countries in Southeast Asia. We do not expect the Eurozone to publish any significant macroeconomic data today. The EUR/USD rate today has risen markedly due to the weakening dollar. Investors expect the Fed to fall by 0.25% at the April 29 meeting and lower the ECB rate by 0.1% at the July 16 meeting.

27/02/2020 Market Overview IFC Markets chart

Nikkei continues to go down today after yesterday’s insignificant correction

Asian indices today are being traded in different directions: some of them have grown, and some have decreased. Hang SengIndex went up at 0.3%. Stock indices of the Shanghai Exchange also rose. Investors believe that the Chinese authorities will stimulate the economy affected by the coronavirus epidemic. Besides, the influx of new patients in China obviously slowed down. The number of people who recovered exceeds the number of cases for 10 consecutive days. The Japanese Nikkei index resumed its decline, but shares in Kyorin Holdings pharmaceutical company rose by 10% owing to reports that their unit has developed a new test for coronavirus Covid-19.

Brent today keeps falling for the 5th day in a row

Brent зfutures for 5 days lost 10.6% and WTI – 10.4%. Almost all well-known agencies and banks lower their forecasts for an increase in global oil demand this year because of the coronavirus epidemic. For example, Facts Global Energy agency now believes that global oil demand will increase by only 60 thousand barrels per day, or the growth will be even zero. USA official oil reserves did actually increase for the 5th week consecutively. This was reported by U.S. Energy Information Administration (EIA). Now market participants are waiting for the outcome of the OPEC + meeting, which is held on March 5-6. Previously, OPEC + was going to reduce production by 600 thousand barrels per day, which could support oil prices.

Market Analysis provided by IFCMarkets

Note:
This overview has an informative and tutorial character and is published for free. All the data, included in the overview, are received from public sources, recognized as more or less reliable. Moreover, there is no guarantee that the indicated information is full and precise. Overviews are not updated. The whole information in each overview, including opinion, indicators, charts and anything else, is provided only for familiarization purposes and is not financial advice or а recommendation. The whole text and its any part, as well as the charts cannot be considered as an offer to make a deal with any asset. IFC Markets and its employees under any circumstances are not liable for any action taken by someone else during or after reading the overview.