The EUR/USD currency pair shows a pronounced upward trend. The demand for greenback has decreased. Investors made a bet that the Fed may lower interest rates to compensate for the impact of the spreading coronavirus. Yesterday the growth of quotations exceeded 1%. Euro reached the round level of 1.10,000. The mark 1.09650 is a local support. We do not rule out further recovery of the single currency. We expect important economic releases from Germany and USA. Positions should be opened from key levels.
The Economic News Feed for 28.02.2020:
– German labour market report – 10:55 (GMT+2:00);
– Personal spending in the US – 15:30 (GMT+2:00).
The indicators signal the strength of buyers: the price has fixed above 50 MA and 100 MA.
MACD histogram is in the positive zone, which gives a signal to buy EUR/USD.
The Stochastic Oscillator is in the neutral zone, the %K line is above the %D line, which also indicates a bullish sentiment.
Trading recommendations
Support levels: 1.09650, 1.09100, 1.08600
Resistance levels: 1.10100, 1.10500
If the price fixes above 1.10100, further growth of EUR/USD quotes is expected to 1.10400-1.10600.
Alternatively, the quotes could descend toward 1.09300-1.09100.
The GBP/USD currency pair
Technical indicators of the currency pair:
Prev Open: 1.28956
Open: 1.28811
% chg. over the last day: -0.14
Day’s range: 1.28694 – 1.28966
52 wk range: 1.1959 – 1.3516
Bearish sentiment prevails on GBP/USD currency pair. Sterling reached key lows (1.28550). The round level 1.29000 is already a mirror resistance. At the moment the trading instrument is consolidating. GBP/USD quotes have potential for further decline. We recommend that you keep track of the current information regarding the trade negotiations between the UK and the EU. Positions should be opened from key levels.
The Economic News Feed for 28.02.2020 is calm.
The indicators signal the sellers’ strength: the price has fixed below 50 MA and 100 MA.
MACD histogram is in the negative zone and continues to decline, which gives a strong signal to sell GBP/USD.
The Stochastic Oscillator is in the neutral zone, the %K line has crossed the %D line. There are no signals at the moment.
Trading recommendations
Support levels: 1.28550, 1.28000
Resistance levels: 1.29000, 1.29400, 1.29750
If the price fixes below 1.28550, expect the quotes to fall toward 1.28000.
Alternatively, the quotes could recover toward 1.29300-1.29600.
The USD/CAD currency pair
Technical indicators of the currency pair:
Prev Open: 1.33292
Open: 1.33906
% chg. over the last day: +0.43
Day’s range: 1.33789 – 1.34486
52 wk range: 1.2949 – 1.3566
Aggressive purchases are observed on the USD/CAD currency pair. During yesterday’s and today’s trades quotations growth exceeded 100 points. The CAD is under pressure from a significant drop in oil prices. The trading instrument found resistance at 1.34500. 1.34000 is the nearest support. USD/CAD quotes can grow further. We expect important economic reports from Canada. Positions should be opened from key levels.
At 15:30 (GMT+2:00) will be published data on Canadian GDP.
The indicators signal the strength of buyers: the price has fixed above 50 MA and 100 MA.
The MACD histogram is in the positive zone and above the signal line, which gives a strong signal to buy USD/CAD.
The Stochastic Oscillator is located in the overbought zone, the %K line crosses the %D line. There are no signals at the moment.
Trading recommendations
Support levels: 1.34000, 1.33450, 1.33100
Resistance levels: 1.34500, 1.35000
If the price fixes above 1.34500, further growth of USD/CAD quotes is expected to the round level 1.35000.
Alternatively, the quotes could descend toward 1.33700-1.33500.
The USD/JPY currency pair
Technical indicators of the currency pair:
Prev Open: 110.401
Open: 109.590
% chg. over the last day: -0.72
Day’s range: 108.795 – 109.682
52 wk range: 104.45 – 113.53
USD/JPY quotes show a stable downtrend. During yesterday’s and today’s trades the yen added more than 150 points in price against the US dollar. Demand for safe haven currencies remains at a high level due to growing risks of further spread of coronavirus. Currently, USD/JPY quotes are consolidating in the range 108.800-109.300. We recommend that you pay attention to the dynamics of US government securities yield. Positions should be opened from key levels.
Mixed economic reports from Japan were published during the Asian trading session.
The indicators signal the sellers’ strength: the price has fixed below 50 MA and 100 MA.
MACD histogram is in the negative zone, which gives a sell signal for USD/JPY.
The Stochastic Oscillator is located in the oversold area, the %K line crosses the %D line. There are no signals at the moment.
Trading recommendations
Support levels: 108.800, 108.400, 108.000
Resistance levels: 109.300, 109.650, 110.200
If the price fixes below 108.800, expect the quotes to fall toward 108.500-108.300.
Alternatively, the quotes could grow toward 109.700-110.000.
By OilPrice.com – Three of the most valuable metals in the world are so rare that they could become a factor in the difference between global technological dominance and military superiority on one hand, and the loss of superpower status on the other.
Yet, for all their critical importance, even the most powerful nations are struggling to secure a stable supply.
That’s because one of these metals is so rare that total historical production wouldn’t even cover your ankles in an Olympic-sized swimming pool
The second is even rarer than the first.
And the third … is so secretive that it’s almost impossible to put a market price on it at all.
#1 Platinum (Pt)
This metal is as scarce as gold, representing .005 ppm (parts per million) of the earth’s crust. But it isn’t exploited at even close to the volume of gold.
That’s because it’s hard to get at. There’s no surface-mining of platinum, although South Africa does have one very small open-pit mine that provides some 8 percent of the world’s platinum production.
All the gold ever produced in the world would fill three Olympic-sized swimming pools, while platinum would barely cover your feet in one.
But while gold has few uses aside from aesthetics and a safe haven for traders, platinum is critical.
Platinum is so rare and valuable that during WWII, it was declared a strategic metal, and the U.S. government banned its use in jewelry.
Today, it’s even more strategic than it was during the Second World War – and not just for military applications, either.
Platinum is critical for everything from computers and catalytic converters to optical fibers – and crucially, it’s used by automakers to reduce harmful vehicle emissions.
And its sister metal – palladium – is on a massive bull run right now. Palladium prices have risen an amazing 400 percent since early 2016 due to chronic under-supply and “relentless” industrial demand. That has led to a wide gap between prices for the sister metals, with over-supplied platinum struggling but now poised to gain lost ground.
Worldwide, estimates are that we have 69,000 metric tons of platinum reserves, and 95 percent of that is deep in the earth’s crust in South Africa. Miniscule amounts are to be found in Russia and North America, where it is mined as a by-product of nickel and palladium, respectively.
The platinum jackpot is South Africa’s Merensky Reef, and the biggest producer is Anglo Platinum (AMS:SJ) (OTCMKTS:ANGPY), which accounted for some 40 percent of all primary refined platinum, and 30 percent of total global production in 2017.
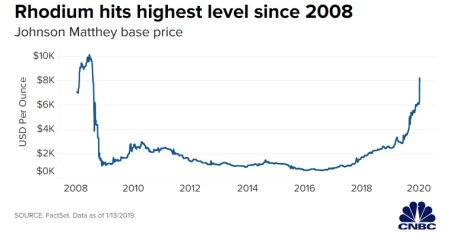
#2 Rhodium (Rh)
Rhodium is even rarer and more expensive than palladium. And it goes for five times the price of gold.
Rhodium has a high melting point and is pretty much immune to corrosion. That makes it a key element for use in anything that needs reflective properties, as well as catalytic converters.
This month alone, rhodium prices have surged over 30 percent, and one of its key drivers is its application in emissions rules, which is now stricter and pushing much greater demand for this precious rare earths element. Both diesel and gas engines need rhodium – and now more than ever.
Some analysts are calling it “the hottest trade of 2020”.
Data from S&P Global Platts suggests that over 80 percent of demand for rhodium and palladium comes from the automotive industry.
Again, the biggest producer is South Africa, followed by Russia and Canada. That’s because it’s produced largely as a by-product of platinum and palladium.
Cesium, was added to the critical commodities list by the USGS in 2018 and has several important uses in modern industry: It’s increasingly vital to the oil and gas industry because it’s used in cesium formate brines, which act as heavy mud for high pressure, high temperature offshore oil drilling. In other words, it lubricates drill bits and prevents blowouts.
Cesium isotopes are also responsible for the world’s time standard. That’s why they are used in atomic clocks for cell phone networks, the internet, Global Positioning Systems (GPS) and aircraft guidance systems. Cesium clocks are the most accurate known to man – accurate to about 1 second in 300 million years.
Cesium bromide is used in infrared detectors, optics, photoelectric cells, scintillation counters, and spectrophotometers, and the metal is also used in the glass for military-grade night vision goggles.
According to the USGS, the United States relied 100% on cesium imports in 2019. It’s hard to get a world market price on cesium because there is not much trading of this strategic metal, but according to the most recent Mineral Commodities Summary, one company offered 1-gram ampoules of 99.8% (metal basis) cesium for $63.00, a slight increase from $61.80 in 2018, and 99.98% (metal basis) cesium for $81.10, a 3% increase from $78.70 in 2018.
Strategic as it is, though, there are only three pegmatite mines in the world that commercially produce it: Tanco in Manitoba, Bitika in Zimbabwe, and Sinclair in Australia. Of these, Tanco and Bitika are no longer producing, and the stockpiles at Tanco and Sinclair are largely controlled by China.
So, not only is there limited production – there are a very limited number of companies in the cesium supply chain.
One is Sinomine Resource Group Co. Ltd, based in China and now the owner of the Tanco mine and Sinclair’s stockpiles, but a potential future competitor is now just emerging on the cesium scene: the relatively unknown Canadian junior miner, Power Metals Corp. best known for its major hard rock lithium deposit in Canada.
This company is sitting on what is hoped to become only the fourth commercial mine of its kind in the world, with 100 percent ownership in the Case Lake property in Northeastern Ontario, where it has made a discovery of a deposit which includes some high-grade cesium mineralization.
The company discovered the pegmatites at West Joe Dyke in August 2018, intersecting high-grade cesium mineralization in six drill holes when it was targeting lithium instead.
For cesium, it means the playing field could be strategically shifting away from what has already been lost to China and towards a new North American supply.
The timing is as critical as the precious metals themselves.
The United States effectively relies on foreign imports for 70 percent of its strategic metals, as indicated by a 2017 USGS report:
That’s no way to win world dominance in an age of advanced technology that would be crippled without these super metals.
As the world continues to evolve, a handful of companies are looking to ride the wave of growing demand…
Teck Resources (NYSE:TECK, TSX:TECK)
Teck could be one of the best-diversified miners out there, with a broad portfolio of Copper, Zinc, Energy, Gold, Silver and Molybdenum assets. Its free cash flow and a lower volatility outlook for base metals in combination with a potential trade war breakthrough could send the stock higher in H2 of this year.
Teck’s share price stabilized last year, and many investment banks now see the stock as undervalued. Low prices for Canadian crude and disappointing base metals prices weighed on Q4 earnings.
Despite its struggles, however, Teck Resources recently received a favorable investment rating from Fitch and Moody’s and will likely benefit from its upgraded score. “Having investment grade ratings is very important to us and confirms the strong financial position of the company,” said Don Lindsay, President and CEO. “We are very pleased to receive this second credit rating upgrade.”
Turquoise Hill Resources (NYSE:TRQ ,TSX:TRQ)
Turqouise is a mid-cap Canadian mineral exploration and development company headquartered in Vancouver, British Columbia. Its focus is on the Pacific Rim where it is in the process of developing several large mines.
The company mines a diversified set of metals/minerals including Coal, Gold, Copper, Molybdenum, Silver, Rhenium, Uranium, Lead and Zinc. One of the fortes of Turquoise hill is its good relationship with mining giant Rio Tinto.
Turquoise has seen its share price languish last year, and the successful development of its world-class Oyu Tolgoi project in Mongolia is of utmost important to the future of this miner.
Pretium Resources (NYSE:PVG, TSX:PVG)
This impressive Canadian company is engaged in the acquisition, exploration and development of precious metal resource properties in the Americas. Pretium has an impressive portfolio and if you can catch the stock while the price is right, there could be huge opportunity for upside. Additionally, construction and engineering activities at its top location continue to advance, and commercial production is targeted for this year.
With Pretium’s variety of assets, this mining giant is a key figure in Canada’s resource realm. Investors know a good thing when they see it and have definitely taken note of this company’s ambitious and forward-looking drive.
Magna International (NYSE:MGA, TSX:MG)
Based in Aurora, Ontario, Magna is a global automotive supplier is gutsy and innovative–and definitely tuned to the obvious future–clean transportation. A great catalyst is its development of a combo electric/hydrogen vehicle–a fuel cell range-extended EV (FCREEV). It’s not going to produce them (for now, at least) but plans to use the model to show off its engineering and design prowess and produce elements of the electric drivetrain and contract manufacturing. It’s insightful, forward-thinking and smart value/low cost for shareholders.
Agnico Eagle Mines Ltd (NYSE:AEM, TSX:AEM)
Canadian based gold producer, Agnico Eagle Mines is an especially noteworthy company for investors. Why? Between 1991-2010, the company paid out dividends every year. With operations in Quebec, Mexico, and Finland, the company also is taking place in exploration activities in Europe, Latin America, and the United States.
While Agnico primarily focuses on gold, it made this list because the world’s appetite for gold will never die. It is engrained in our culture, history and society.
By. Meredith Taylor
**IMPORTANT! BY READING OUR CONTENT YOU EXPLICITLY AGREE TO THE FOLLOWING. PLEASE READ CAREFULLY**
Forward-Looking Statements
This news release contains forward-looking information which is subject to a variety of risks and uncertainties and other factors that could cause actual events or results to differ from those projected in the forward-looking statements. Forward looking statements in this release include that prices for cesium will retain value in future as currently expected; that PWM can fulfill all its obligations to maintain its properties; that PWM’s property can successfully mine commercial quantities of cesium; that the three properties the company is drilling are hoped to have similar finds as the strategically important Sinclair mine in Australia; that occurrences and indications of a commercially sized deposit become reality; that high grades found in samples are indicative of a high grade deposit; and that PWM will be able to carry out its business plans. These forward-looking statements are subject to a variety of risks and uncertainties and other factors that could cause actual events or results to differ materially from those projected in the forward-looking information. Risks that could change or prevent these statements from coming to fruition include that aspects or all of the properties’ development may not be successful, mining of the cesium may not be cost effective, the price of cesium may not stay high and it may never be profitable to mine cesium; PWM may not raise sufficient funds to carry out its plans, changing costs for mining and processing; increased capital costs; the timing and content of upcoming work programs; geological interpretations and technological results based on current data that may change with more detailed information or testing; potential process methods and mineral recoveries assumptions based on limited test work with further test work may not be viable; competitors may offer cheaper cesium; more production of Cesium could reduce its price; alternatives could be found for cesium; the availability of labour, equipment and markets for the products produced; and despite the current expected viability of its projects, that the minerals cannot be economically mined on its properties, or that the required permits to build and operate the envisaged mines cannot be obtained. The forward-looking information contained herein is given as of the date hereof and the Company assumes no responsibility to update or revise such information to reflect new events or circumstances, except as required by law.
DISCLAIMERS
ADVERTISEMENT. This communication is not a recommendation to buy or sell securities. Oilprice.com, Advanced Media Solutions Ltd, and their owners, managers, employees, and assigns (collectively “the Company”) may in the future be paid by PWM to disseminate future communications if this communication proves effective. In this case the Company has not been paid for this article. But the potential for future compensation is a major conflict with our ability to be unbiased, more specifically:
This communication is for entertainment purposes only. Never invest purely based on our communication. We have not been compensated by PWM but may in the future be compensated to conduct investor awareness advertising and marketing for TSXV: PWM.V; OTC:PWRMF. Therefore, this communication should be viewed as a commercial advertisement only. We have not investigated the background of the company. Frequently companies profiled in our alerts experience a large increase in volume and share price during the course of investor awareness marketing, which often end as soon as the investor awareness marketing ceases. The information in our communications and on our website has not been independently verified and is not guaranteed to be correct.
SHARE OWNERSHIP. The owner of Oilprice.com owns shares of this featured company and therefore has an additional incentive to see the featured company’s stock perform well. The owner of Oilprice.com will not notify the market when it decides to buy more or sell shares of this issuer in the market. The owner of Oilprice.com will be buying and selling shares of this issuer for its own profit. This is why we stress that you conduct extensive due diligence as well as seek the advice of your financial advisor or a registered broker-dealer before investing in any securities.
NOT AN INVESTMENT ADVISOR. The Company is not registered or licensed by any governing body in any jurisdiction to give investing advice or provide investment recommendation. ALWAYS DO YOUR OWN RESEARCH and consult with a licensed investment professional before making an investment. This communication should not be used as a basis for making any investment.
RISK OF INVESTING. Investing is inherently risky. Don’t trade with money you can’t afford to lose. This is neither a solicitation nor an offer to Buy/Sell securities. No representation is being made that any account will or is likely to achieve profits similar to those discussed.
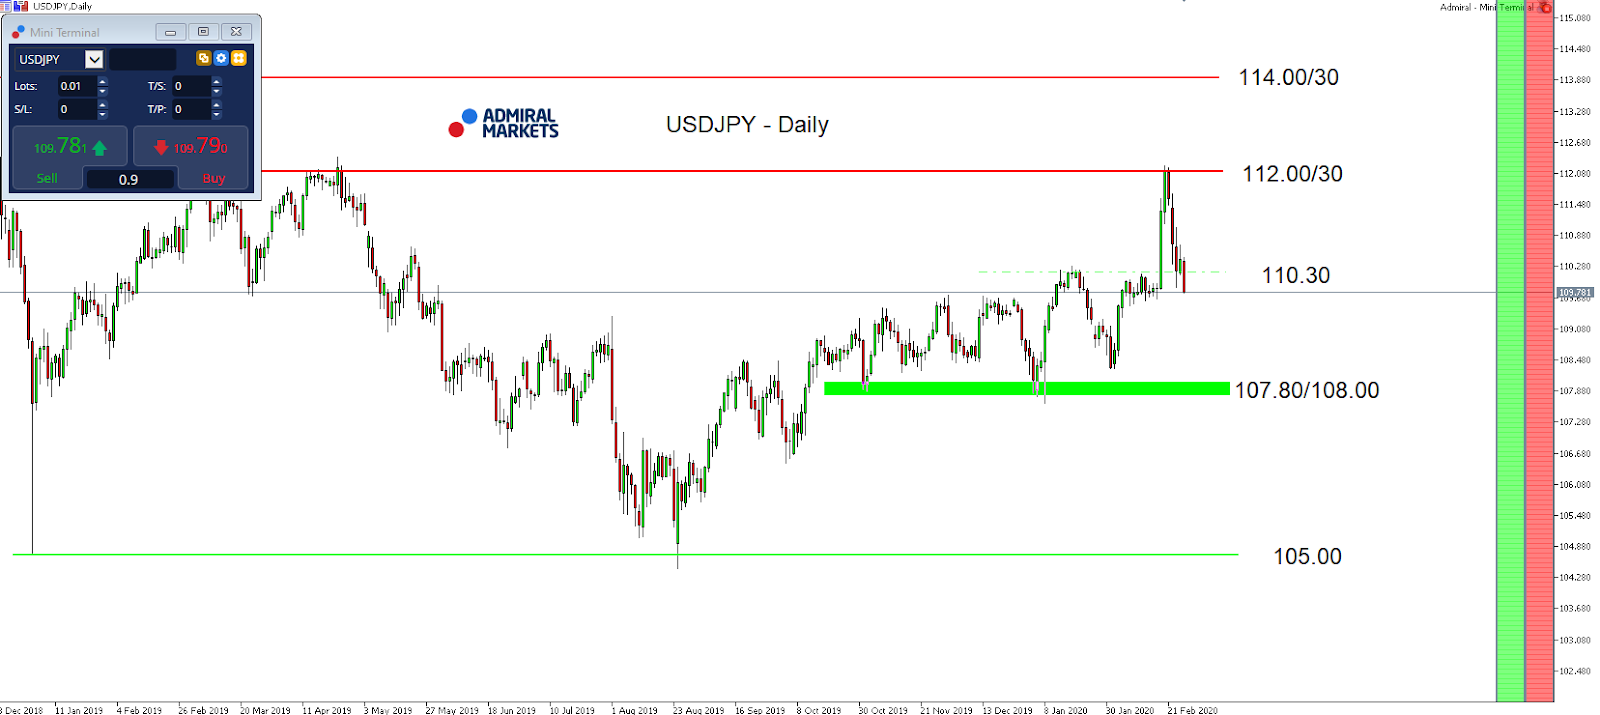
After the USD/JPY went for a test of the region around 2019’s yearly highs of 112.00/30, recent developments concerning the Coronavirus resulted in a sharp bounce from the massive risk-off hitting global financial markets.
While we expect volatility to stay elevated since the worst is probably yet come (the US CDC said that it wants to prepare the American public for the possibility that their lives will be disrupted in the US with the Coronavirus’ spread), a short-term push back above 110.00 could be coming.
Our take: if the Personal Spending data comes in better than expected, and above 0.3%, 10-year US yields (which just saw new all-time lows recently), could see a bounce, thus driving the USD/JPY higher.
But we are very cautious in regards to the sustainability of such a move: if the situation around the Coronavirus worsens again, and signs intensify that the Fed may be forced to go with a surprising “emergency rate cut” before their next meeting on March 18 (which is currently not in sight thus “surprising”), US yields could see another push lower, driving the USD/JPY sustainably back below 110.00.
Technically the mode stays bullish as long as we trade above 107.80/108.00:
Source: Admiral MarketsMT5 with MT5-SE Add-on USD/JPY Daily chart (between December 18, 2018, to February 27, 2020). Accessed: February 27, 2020, at 10:00pm GMT – Please note: Past performance is not a reliable indicator of future results, or future performance.
In 2015, the value of the USD/JPY increased by 0.5%, in 2016, it fell by 2.8%, in 2017, it fell by 3.6%, in 2018, it fell by 2.7%, in 2019, it fell by 0.85%, meaning that after five years, it was down by 9.2%.
Discover the world’s #1 multi-asset platform
Admiral Markets offers professional traders the ability to trade with a custom, upgraded version of MetaTrader 5, allowing you to experience trading at a significantly higher, more rewarding level. Experience benefits such as the addition of the Market Heat Map, so you can compare various currency pairs to see which ones might be lucrative investments, access real-time trading data, and so much more. Click the banner below to start your FREE download of MT5 Supreme Edition!
Disclaimer: The given data provides additional information regarding all analysis, estimates, prognosis, forecasts or other similar assessments or information (hereinafter “Analysis”) published on the website of Admiral Markets. Before making any investment decisions please pay close attention to the following:
This is a marketing communication. The analysis is published for informative purposes only and are in no way to be construed as investment advice or recommendation. It has not been prepared in accordance with legal requirements designed to promote the independence of investment research, and that it is not subject to any prohibition on dealing ahead of the dissemination of investment research.
Any investment decision is made by each client alone whereas Admiral Markets shall not be responsible for any loss or damage arising from any such decision, whether or not based on the Analysis.
Each of the Analysis is prepared by an independent analyst (Jens Klatt, Professional Trader and Analyst, hereinafter “Author”) based on the Author’s personal estimations.
To ensure that the interests of the clients would be protected and objectivity of the Analysis would not be damaged Admiral Markets has established relevant internal procedures for prevention and management of conflicts of interest.
Whilst every reasonable effort is taken to ensure that all sources of the Analysis are reliable and that all information is presented, as much as possible, in an understandable, timely, precise and complete manner, Admiral Markets does not guarantee the accuracy or completeness of any information contained within the Analysis. The presented figures refer that refer to any past performance is not a reliable indicator of future results.
The contents of the Analysis should not be construed as an express or implied promise, guarantee or implication by Admiral Markets that the client shall profit from the strategies therein or that losses in connection therewith may or shall be limited.
Any kind of previous or modeled performance of financial instruments indicated within the Publication should not be construed as an express or implied promise, guarantee or implication by Admiral Markets for any future performance. The value of the financial instrument may both increase and decrease and the preservation of the asset value is not guaranteed.
The projections included in the Analysis may be subject to additional fees, taxes or other charges, depending on the subject of the Publication. The price list applicable to the services provided by Admiral Markets is publicly available from the website of Admiral Markets.
Leveraged products (including contracts for difference) are speculative in nature and may result in losses or profit. Before you start trading, you should make sure that you understand all the risks.
Bob Moriarty of 321gold rings the alarm bells on the fallout from the coronavirus.
Exactly a month ago I warned that the coronavirus outbreak was going to pop the “Everything Bubble.” I did something fairly subtle. I buried my main message under a whole heap of cow manure. It doesn’t make a rat’s ass if I was right or wrong about calling for a market crash in October or the Fed dumping piles of new crisp $100 bills onto a bonfire in September.
This time I’m going to put my message right at the top so no one can miss it. I quote from the January 27th piece, “This has the potential for being the biggest mass casualty event in world history. At the very least it will take down the financial system as the world economy grinds to a halt with efforts to contain the virus.”
In short, the world is f**ked.
I didn’t want most people to understand that when I said it. If they had, there would be panic and you wouldn’t be able to buy food, fuel or water.
Face it, 97% of people want to believe all the crap handed out by their governments. Maybe 3% are willing to think for themselves. I’ve written a couple of books about investing and finance where I tried to show how to make money once you learn to think for yourself. There are no gurus or experts, only people who can think.
I aimed my piece a month ago at the 3%. Because if anyone was following the NEWS (?) from China, the virus is an utter disaster and that’s true in a developed nation. Once it spreads to Africa, as it surely will, it is going to be the biggest catastrophe the continent has ever faced with potentially the deaths of tens or hundreds of millions.
The numbers from China seem to indicate a death rate of above 2% for those under hospital treatment but far higher for the vastly greater number of people who caught it and eventually fell over dead. The Chinese government tossed them in bags and burned them. Eventually they will be putting them in landfills.
There was another important statement in my piece last month that may have flown over the heads of 97% of readers. “Governments lie about everything and as a result we are about to pay a terrible price. All of them lie.”
Any rational thinking person would have come to the conclusion that the Chinese government is lying through their teeth about how serious the virus is. That’s not a big deal because every other government is doing the same thing.
But eventually even the idiots wake up to the point that they can see the giant pimple right on the tip of their nose. Let me give you some facts to think about and how it will affect you.
I’m told that there are 30,000 unique parts in any typical automobile. Companies manufacturing cars might have 1,000 different suppliers providing those parts, many of which are located in China. If you can think for yourself, ask yourself just how many of those companies would have to fail to bring the auto manufacturer to a grinding halt.
One.
The guys making gears for the starter, or steering wheels or door handles or seats. Any of them could stop the entire process. And the Chinese propensity of wanting to be supplier to the world of Chinese stuff, all the auto people just discovered they have a giant problem.
I’m also told that 90% of the precursor ingredients for drugs originate in China. So you may be buying your high blood pressure pills made in Spain but when they run out of the inputs to those pills, the output of those pills stop as well.
Airlines are starting to cancel flights because bookings are coming to a slow halt but also they are hiding the fact that flight crews are refusing to fly. The cruise industry just got destroyed, the events on the Diamond Princess led to over 700 confirmed cases of the coronavirus. Who in their right minds would continue to plan a cruise where you get a free case of the virus with every other ticket? But when this begins to hit military units or boarding schools or prisons, the s**t literally will have hit the fan.
Let’s be real honest here for a moment. I am hardly the only guy who sees a financial disaster on the horizon. Lots of intelligent writers have generated reams of paper about something that has to happen. If you have an interest rate based system, there is always more debt than money to pay it. That’s why Jubilees go back thousands of years. Governments can pretend they intend to pay all the money they have borrowed back but it’s bull. Governments never pay their debts, they always default.
It has taken stock markets around the world a month to understand what my readers and I understood a month ago. The coronavirus is the ultimate black swan and all governments are accomplishing is to prove how impotent they are to solve real problems.
The spread of the virus is expanding and that will continue. The damage to an already weak financial system will also continue. This is going to pop the Everything Bubble including gold, silver, mining stocks, the general stock market, “Bitcon,” real estate, collectibles and everything else that had absurd gains. Paper money just regained it’s real value, that is naught. People are going to go to bed rich and wake up poor.
You have a very limited time to prepare. I’ve warned for years to a mostly bored audience but this is the read deal. You can see what happened in Italy in a couple of short days, they locked down a dozen cities as unprepared citizens panicked and emptied food stores. This is coming your way. Are you prepared or do you want to wait until the government tells you to panic?
The Greatest Depression is going to have negative effects on everyone. No one will escape entirely no matter how well prepared you are. All you can do is try to keep the damage to a minimum.
The only cures for an out of control financial system include a debt jubilee and some form of real money that will include precious metals. They are about to get real precious. But they might well do a 2008 on us before people wake up. If you are not yet prepared, get prepared. If you are determined to panic, always do it early.
Bob Moriarty founded 321gold.com, with his late wife, Barbara Moriarty, more than 16 years ago. They later added 321energy.com to cover oil, natural gas, gasoline, coal, solar, wind and nuclear energy. Both sites feature articles, editorial opinions, pricing figures and updates on current events affecting both sectors. Previously, Moriarty was a Marine F-4B and O-1 pilot with more than 832 missions in Vietnam. He holds 14 international aviation records.
Disclosure: 1) Statements and opinions expressed are the opinions of Bob Moriarty and not of Streetwise Reports or its officers. Bob Moriarty is wholly responsible for the validity of the statements. Streetwise Reports was not involved in the content preparation. Bob Moriarty was not paid by Streetwise Reports LLC for this article. Streetwise Reports was not paid by the author to publish or syndicate this article. 2) This article does not constitute investment advice. Each reader is encouraged to consult with his or her individual financial professional and any action a reader takes as a result of information presented here is his or her own responsibility. By opening this page, each reader accepts and agrees to Streetwise Reports’ terms of use and full legal disclaimer. This article is not a solicitation for investment. Streetwise Reports does not render general or specific investment advice and the information on Streetwise Reports should not be considered a recommendation to buy or sell any security. Streetwise Reports does not endorse or recommend the business, products, services or securities of any company mentioned on Streetwise Reports. 3) From time to time, Streetwise Reports LLC and its directors, officers, employees or members of their families, as well as persons interviewed for articles and interviews on the site, may have a long or short position in securities mentioned. Directors, officers, employees or members of their immediate families are prohibited from making purchases and/or sales of those securities in the open market or otherwise from the time of the interview or the decision to write an article until three business days after the publication of the interview or article. The foregoing prohibition does not apply to articles that in substance only restate previously published company releases.
On Thursday, February 27, the euro was up at the close of trading. During European trading, bulls reached the MA line U3, situated at 1.1006. The main reason for the euro’s growth was investors’ move away from risky assets and stocks (since the euro and the yen are the funding currencies). Investors are concerned about the spread of coronavirus outside of China. The total number of infected exceeded 83,000 people. The current mortality rate sits at 3.4% of the total.
Brent fell 3.66%. Major US stock indices fell by more than 4%. Since February 20, the S&P index has fallen from a record high of 13.8%.
16:30 USA: Personal Spending (Jan), Core Personal Consumption Expenditure – Price Index (MoM) (Jan), Personal Income (MoM) (Jan).
17:15 USA: FOMC Bullard speech.
17:45 USA: Chicago Purchasing Managers’ Index (Feb).
18:00 USA: Michigan Consumer Sentiment Index (Feb).
21:00 USA: Baker Hughes US Oil Rig Count.
Current situation:
The EURUSD pair has reached the upper limit of the MA channel. The last time the price reached the U3 line was on August 6, 2019. The 135th degree is located slightly higher up, which also strengthened the resistance at 1.1010, with the U3 line now found at 1.1037. Since investors are afraid of a pandemic, and, against the background of continued falling stock indices, the 1.1040-1.1050 zone is likely to be tested. In most cases, the price rolls back to the balance line (Lb) upon reaching the U3 line, but growth is currently supported by crosses and the news about the coronavirus.
Pay attention also to the Fiber channel. After the breakthrough at 1.0930 (around the 67th degree), the price hit the 200%. The 300% level is found at 1.1071. A jump in moment is likely, but if the price deviates from the SMA 55, the price will either fall into sideways movement for two days or will begin to correct. If the situation in the stock markets does not change for the better, then the EURUSD pair could well form three peaks along the U3 line. This is a favourite Bitcoin pattern.
S&P 500 collapsed by 12% of its maximum recorded on February 19
On Thursday, US stock quotes resumed falling. The Dow index fell again by more than 1000 pips per day, for the 4th time in its entire history. The main reason for such a negative trend is still the spread of the coronavirus epidemic named Covid-19. The daily decline in US indices was the highest since August 2011: S&P 500 (-4,42%), Dow Jones Industrial Average (-4,46%), Nasdaq (-4,6%). The S&P 500 is moving down led by three sectors: real estate, high technology and energy. Shares of Microsoft Corp plummeted by 7% after reporting a potential profit cut due to coronavirus. Earlier, similar negative statements were made by Apple, HP, PayPal, Mastercard and others. The S&P 500 growth leader was the medical masks manufacturer 3M (+ 0.8%). On Thursday, the volume of trading on US exchanges was record high since July 2014 and amounted to 15.6 billion stocks. This is almost twice more than the average level of 20 days. USA are to publish important economic data today: trade balance and personal expenses for January. The ICE dollar index continues to decline today. Futures for US stock indexes fall by around 2.5%.
European stock indices are actively going down today
European stocks fell significantly yesterday. Today, they still keep declining. Italy took the third place in the number of people infected with coronavirus (about 700 people) after South Korea (2.5 thousand) and China (79 thousand). The death toll in Italy has come up to 20 people. Yesterday, European companies’ quotations from the travel & leisure sector fell more than others. Today, the German DAX index crashed by almost 5%. If this decline continues, it could be the worst week for European stock exchanges since the 2008 crisis. The World Health Organization stated the coronavirus epidemic could overgrow into a global pandemic. Moody’s rating agency said the pandemic will switch the US and global economies into recession in the first half of this year. Today, the Eurozone will publish data on inflation and the labor market in Germany. The EUR/USD rate today continues to rise steadily. Investors expect the Fed to fall by 0.25% at the April 29 meeting and lower the ECB rate by just 0.1% at the July 16 meeting.
Nikkei collapsed today along with other world indices
Today, all Asian indices went down. In general, there is no growth on any more or less large stock market in the world. Hang Seng index lost 2.4%. Meanwhile, the situation with coronavirus in China already shows signs of stabilization, unlike other countries. Mainland China on Friday reported about only 327 new cases of the disease. This is the minimum since January 23. The total number of cases in the country approached 79 thousand people, nearly 2.8 thousand died. During the week, Hang Seng decreased by 4.3%. This is noticeably less than the fall of many American and European indices. Investors expect the Chinese authorities to take measures to support the economy. Japanese Nikkei index for the week fell by 10% to a minimum since September last year. This could be facilitated by the powerful strengthening of the yen, which investors consider as a protective asset. The number of patients with coronavirus in Japan is a little more than 200 people
Brent crushed below psychological level of $ 50 a barrel today
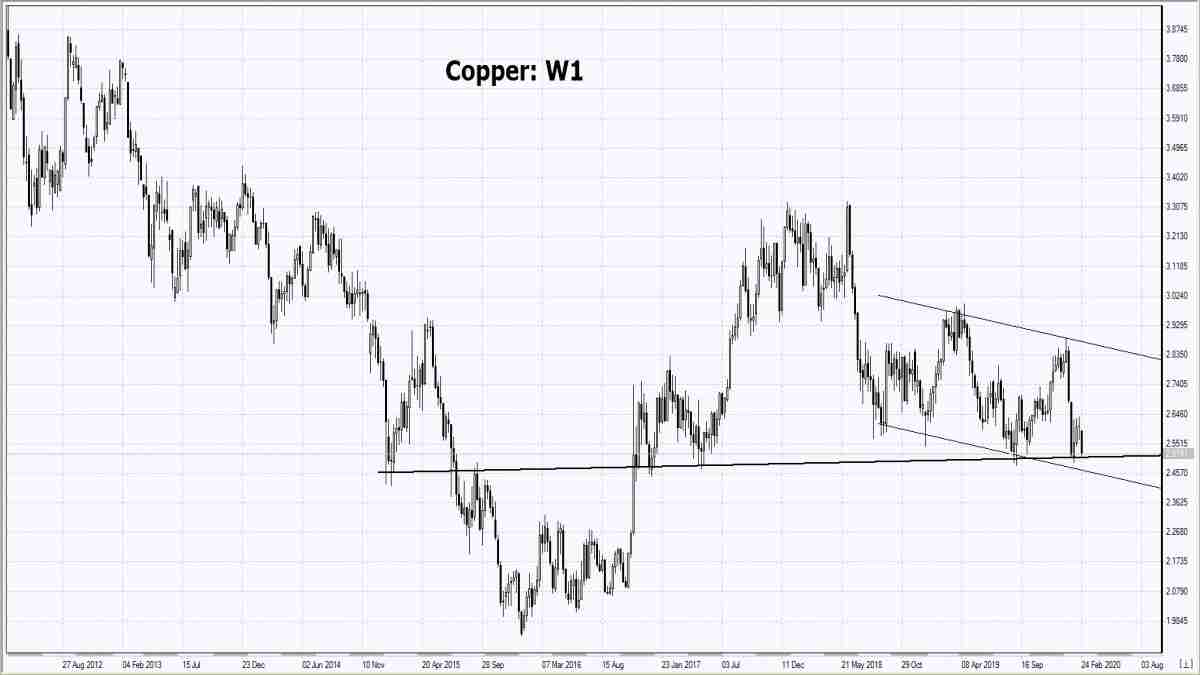
West Texas Intermediate (WTI) futures demonstrated an extreme weekly decline of 14% since May 2011. Market participants are waiting for the results of the OPEC + session, which is to be held March 5-6. Previously, OPEC + was going to reduce oil production by 600 thousand barrels per day, which could support oil prices. We can note a reduction in prices for almost all commodities, including copper and other non-ferrous metals, agricultural products, natural gas and so on.
Note: This overview has an informative and tutorial character and is published for free. All the data, included in the overview, are received from public sources, recognized as more or less reliable. Moreover, there is no guarantee that the indicated information is full and precise. Overviews are not updated. The whole information in each overview, including opinion, indicators, charts and anything else, is provided only for familiarization purposes and is not financial advice or а recommendation. The whole text and its any part, as well as the charts cannot be considered as an offer to make a deal with any asset. IFC Markets and its employees under any circumstances are not liable for any action taken by someone else during or after reading the overview.
Global stock markets are spiralling downwards, with the Dow Jones and the S&P 500 both entering correction territory, after each fell by another 4.42 percent respectively. The MSCI Asia Pacific index is set to close out the week on the back of seven consecutive days of losses, with just a single day of gains to show over the last 12 trading days.
Equity investors have finally been jolted into action after weeks of seemingly paying little heed to the warnings about the coronavirus’ potential to negatively impact earnings. Market participants are joining in the fierce selloff even as they are still flying blind amid the swirling uncertainties about how long the coronavirus outbreak will last, how many countries would be ensnared and how deep its impact on global economic and business conditions.
China PMI could set the immediate market tone for March
Even as some segments of the its economy come back online, China’s February PMI data due Saturday could serve as the next marker for risk sentiment. Confirmation that the coronavirus is pulling the brakes on the world’s second largest economy could spell another leg down for risk assets, while better-than-expected data could deflate some of the selling pressure.
If Covid-19 morphs into a severe pandemic, that could herald a bear market for equities, which is usually accompanied by a recession, although it is not the market’s base case at this point in time. The sooner the coronavirus outbreak can show signs of stabilising, the greater the potential revival in risk appetite, while allowing a longer runway for the global economy to be restored in 2020.
Disclaimer: The content in this article comprises personal opinions and should not be construed as containing personal and/or other investment advice and/or an offer of and/or solicitation for any transactions in financial instruments and/or a guarantee and/or prediction of future performance. ForexTime (FXTM), its affiliates, agents, directors, officers or employees do not guarantee the accuracy, validity, timeliness or completeness, of any information or data made available and assume no liability as to any loss arising from any investment based on the same.
These events for Axsome Therapeutics are described in an H.C. Wainwright & Co. report.
In a Feb. 24 research note, H.C. Wainwright & Co. analyst Ram Selvaraju reported that Axsome Therapeutics Inc. (AXSM:NASDAQ) finished patient enrollment for its INTERCEPT early-stage migraine study and two possible value inflection points are expected in March 2020.
Selvaraju described the design of INTERCEPT, a pivotal, Phase 3, randomized, double-blind, multicenter, placebo-controlled trial. About 300 patients are being randomized in a 1:1 ratio for treatment with AXS-07 (rizatriptan and meloxicam) or placebo, which will be given at the earliest sign of migraine pain.
INTERCEPT has two primary endpoints. Both measured at two hours post dosing, they are the proportion of patients who no longer have migraine pain and who no longer suffer from their most bothersome migraine symptom, such as nausea, phonophobia or photophobia.
The analyst commented that positive INTERCEPT data “should position AXS-07 extremely favorably within the migraine market, in light of the prior positive top-line data generated from the MOMENTUM study.” MOMENTUM evaluated the effect of AXS-07 on migraine patients who previously achieved no response to available therapies. The combination of data from the two trials should “permit Axsome to position AXS-07 as a potentially best-in-class, rapid-onset migraine therapy,” he added.
Selvaraju highlighted that two potentially stock-moving catalysts are expected in March. They are the release of topline data from two studies: INTERCEPT with AXS-07 and STRIDE-1 evaluating AXS-05, or bupropion and dextromethorphan, in patients with treatment-resistant depression. “Positive data in treatment-resistant depression would conclusively position AXS-05 as a best-in-class antidepressant therapy and constitute a key value inflection point for Axsome shares,” he indicated.
Another possible inflection point, potentially even greater than with STRIDE, according to Selvaraju, is expected later, sometime in H1/20, with the release of topline data from Axsome’s Phase 2/3 ADVANCE-1 trial of AXS-05 in Alzheimer’s disease-related agitation.
Finally, the analyst noted that “Axsome’s shares continue to look undervalued” and the biopharma’s “current market cap still only reflects substantial credit for AXS-05 in major depressive disorder and treatment-resistant depression and possibly AXS-07 in migraine, while the other pipeline programs remain comparatively ignored.”
H.C. Wainwright has a Buy rating and a $200 per share target price on Axsome, whose stock is trading at around $84.76 per share.
Disclosure: 1) Doresa Banning compiled this article for Streetwise Reports LLC and provides services to Streetwise Reports as an independent contractor. She or members of her household own securities of the following companies mentioned in the article: None. She or members of her household are paid by the following companies mentioned in this article: None. 2) The following companies mentioned in this article are billboard sponsors of Streetwise Reports: None. Click here for important disclosures about sponsor fees. 3) Comments and opinions expressed are those of the specific experts and not of Streetwise Reports or its officers. The information provided above is for informational purposes only and is not a recommendation to buy or sell any security. 4) The article does not constitute investment advice. Each reader is encouraged to consult with his or her individual financial professional and any action a reader takes as a result of information presented here is his or her own responsibility. By opening this page, each reader accepts and agrees to Streetwise Reports’ terms of use and full legal disclaimer. This article is not a solicitation for investment. Streetwise Reports does not render general or specific investment advice and the information on Streetwise Reports should not be considered a recommendation to buy or sell any security. Streetwise Reports does not endorse or recommend the business, products, services or securities of any company mentioned on Streetwise Reports. 5) From time to time, Streetwise Reports LLC and its directors, officers, employees or members of their families, as well as persons interviewed for articles and interviews on the site, may have a long or short position in securities mentioned. Directors, officers, employees or members of their immediate families are prohibited from making purchases and/or sales of those securities in the open market or otherwise from the time of the interview or the decision to write an article until three business days after the publication of the interview or article. The foregoing prohibition does not apply to articles that in substance only restate previously published company releases. 6) This article does not constitute medical advice. Officers, employees and contributors to Streetwise Reports are not licensed medical professionals. Readers should always contact their healthcare professionals for medical advice.
Disclosures from H.C. Wainwright & Co., Axsome Therapeutics Inc., Company Update, February 24, 2020
Investment Banking Services include, but are not limited to, acting as a manager/co-manager in the underwriting or placement of securities, acting as financial advisor, and/or providing corporate finance or capital markets-related services to a company or one of its affiliates or subsidiaries within the past 12 months.
I, Raghuram Selvaraju, Ph.D., certify that 1) all of the views expressed in this report accurately reflect my personal views about any and all subject securities or issuers discussed; and 2) no part of my compensation was, is, or will be directly or indirectly related to the specific recommendation or views expressed in this research report; and 3) neither myself nor any members of my household is an officer, director or advisory board member of these companies.
None of the research analysts or the research analyst’s household has a financial interest in the securities of Axsome Therapeutics, Inc. (including, without limitation, any option, right, warrant, future, long or short position).
As of January 31, 2020 neither the Firm nor its affiliates beneficially own 1% or more of any class of common equity securities of Axsome Therapeutics, Inc..
Neither the research analyst nor the Firm has any material conflict of interest in of which the research analyst knows or has reason to know at the time of publication of this research report.
The research analyst principally responsible for preparation of the report does not receive compensation that is based upon any specific investment banking services or transaction but is compensated based on factors including total revenue and profitability of the Firm, a substantial portion of which is derived from investment banking services.
The firm or its affiliates received compensation from Axsome Therapeutics, Inc. for non-investment banking services in the previous 12 months.
The Firm or its affiliates did receive compensation from Axsome Therapeutics, Inc. for investment banking services within twelve months before, and will seek compensation from the companies mentioned in this report for investment banking services within three months following publication of the research report.
H.C. Wainwright & Co., LLC managed or co-managed a public offering of securities for Axsome Therapeutics, Inc. during the past 12 months.
The Firm does not make a market in Axsome Therapeutics, Inc. as of the date of this research report.
H.C. Wainwright & Co., LLC and its affiliates, officers, directors, and employees, excluding its analysts, will from time to time have long or short positions in, act as principal in, and buy or sell, the securities or derivatives (including options and warrants) thereof of covered companies referred to in this research report.
By TheTechnicalTraders – Back in early 2018, after a dramatic rally in early January 2018, the US stock market collapsed suddenly and violently – falling nearly 12% in a matter of just 9 trading days. Our researchers asked the question, is the current collapse similar to this type of move and could we expect a sudden market bottom to setup?
Although there are similarities between the setups of these two events, our researchers believe there are two unique differences between the selloff in 2018 and the current selloff. We’ll attempt to cover these components and setups in detail.
Make sure to opt-in to our free market trend signals newsletter before closing this page so you don’t miss our next special report!
First, the similarities:
_ The contraction in market price just before the end of the year in 2017 was indicative of a market that had rallied to extended valuation levels, then stalled in December as the year-end selling took over.
_ The renewed rally in early January was a process of capital re-engaging in the market as future expectations continued to drive and exuberant investor confidence in the markets.
These two similarities between 2018 and 2020 seem fundamental.
Yet, there are differences that may drive a further price contraction event – beyond what we saw in 2018.
_ The US/China trade deal disrupted market fundamentals over the past 6+ months and established a more diminished function of global economics as the trade tensions continued
_ The foreign market capital shift process, where foreign capital poured into the US stock market over the past 12+ months and supported the US Dollar was a process of avoiding foreign market risks. This process trapped a large portion of foreign capital in the US markets prior to the 2020 collapse.
_ Global geopolitical functions are far more fragile than they were in 2018. After BREXIT was completed and prior to the signing of the US/China trade deal, a number of concerns existed throughout the world and are still valid.
_ The Wuhan Corona Virus has changed what global investors expect and how both supply and demand economic functions are being addressed world-wide.
The potential of an early price bottom setting up after this 2020 price collapse is very real. Yet, the ultimate bottom in the markets may be much lower than the 11% or 12% price decline that happened in 2018. The scale and scope of the Corona Virus event, should it continue beyond April 2020 (and possibility well into June or July 2020), could extend the price decline even further. Ultimately, this extended risk function may push the US and global markets to deeper lows before a bottom sets up – yet the outcome may be very similar.
After the double bottom in 2018 setup, a slow and stead price advance continued until the SPY price rallied to new highs in September 2018. A very similar type of price activity may take place in 2020 after the ultimate bottom in price sets up.
Our researchers believe the ultimate bottom in the SPY will likely happen near $251 – near the middle of the 2018 price range. Ideally, the event that takes place to create this price decline will likely happen in a “waterfall” event structure. This means we may see a series of 3 to 9+ day selloffs culminating in a major market bottom near $251.
If our research team is correct in this analysis, a bottom will likely form in the SPY and near $251 to $265 where and extended bottom pattern may setup. We may see a double-bottom type of pattern as we saw in 2018. Ultimately, we believe the bottom will setup sometime in mid-2020 and the remainder of the year will continue to support an extended price rally into the end of 2020.
Are we looking at a similar type of price event like we saw in early 2018? Ideally, yes. Although, we believe this downside price move will be deeper in terms of the total price decline (likely 18% to 25%) and will end when price valuation levels reach a point where global investors feel opportunity exists beyond risk.
Right now, we believe an incredible opportunity for skilled investors is present and that incredible market sector price rotations are taking place. We believe the devaluation process will move the markets lower by at least 15% to 20% or more. That suggests the bottom in the SPY is likely near $251 before we see any real opportunity for price to form a support base and begin to rally higher.
As a technical analysis and trader since 1997, I have been through a few bull/bear market cycles. I believe I have a good pulse on the market and timing key turning points for both short-term swing trading and long-term investment capital. The opportunities are massive/life-changing if handled properly.
I urge you visit my ETF Wealth Building Newsletter and if you like what I offer, join me with the 1-year subscription to lock in the lowest rate possible and ride my coattails as I navigate these financial market and build wealth while others lose nearly everything they own during the next financial crisis. Join Now and Get a Free 1oz Silver Bar!
It was another painful day for Oil as concerns intensified over the coronavirus outbreak sapping demand for fuel.
WTI Crude and Brent both tumbled over 4.5% as investors became increasingly jittery over the widening crises and negative consequences to global growth. On Wednesday, for the first time ever, the number of new cases of COVID-19 outside China exceeded the number of new Chinese cases – ultimately fuelling fears of a pandemic. Oil prices are expected to remain severely depressed on demand and global growth concerns.
The technical picture paints a heavily bearish setup for the WTI Oil with prices trading around $46.00 as of writing. A solid daily close above $46.00 may open the doors towards $44.80.
Dollar steps off the throne
On Thursday, the Dollar weakened against every single G10 currency excluding the Pound and Canadian Dollar.
Speculation around the Federal Reserve cutting interest rates in April and two more times in 2020 inspired bears with fresh inspiration. Although the Greenback is still considered as a prime destination for safety, rate cut bets could limit upside gains. Signs of the coronavirus impacting the US economy could threaten the Dollar’s safe-haven status, ultimately fuelling the downside momentum.
The Dollar Index is under intense pressure on the daily charts. A solid breakdown below 98.40 could trigger a move towards 97.80. Should 98.40 prove to be a reliable support, prices may rebound back towards 98.90.
A treacherous path ahead for Sterling
The Pound tumbled across the board on Thursday after the UK government released its negotiating mandate for Brexit talks.
Battle lines were officially drawn after the mandate adopted a hard-line stance. The UK government is seeking a Canada style free trade agreement, no extension beyond the transition period and a decision on whether a deal would be possible by June. More drama and uncertainty will most likely be on the cards when the first round of negotiations kick on 2 March.
This will mean more volatility on Pound crosses, especially the GBPUSD and EURGBP.
Focusing on the GBPUSD, the path of least resistance points south with the first point of interest at 1.2830. A breakdown below this point could open the doors towards 1.2750.
Euro recovers on Dollar weakness and fiscal hopes
Euro bulls switched into higher gear on Thursday after Germany considered fiscal measures to counter the negative impacts of the coronavirus outbreak to its economy.
Dollar weakness also complimented upside gains with the EUR gaining over 0.8% against the Dollar.
The EURUSD has the potential to push higher in the short term if a breakout above 1.1000 is achieved. A solid daily close above this point should open a path towards 1.1050.
Commodity spotlight – Gold
Renewed concerns over the coronavirus outbreak sent investors rushing towards Gold on Thursday.
The precious metal remains bullish on the daily charts as is trading around $1653 as of writing. A solid daily close above $1660 may trigger a move higher towards $1700. If this level proves to be reliable resistance, prices could slip back towards $1620.
Disclaimer: The content in this article comprises personal opinions and should not be construed as containing personal and/or other investment advice and/or an offer of and/or solicitation for any transactions in financial instruments and/or a guarantee and/or prediction of future performance. ForexTime (FXTM), its affiliates, agents, directors, officers or employees do not guarantee the accuracy, validity, timeliness or completeness, of any information or data made available and assume no liability as to any loss arising from any investment based on the same.