By Hussein Sayed, Chief Market Strategist (Gulf & MENA), ForexTime
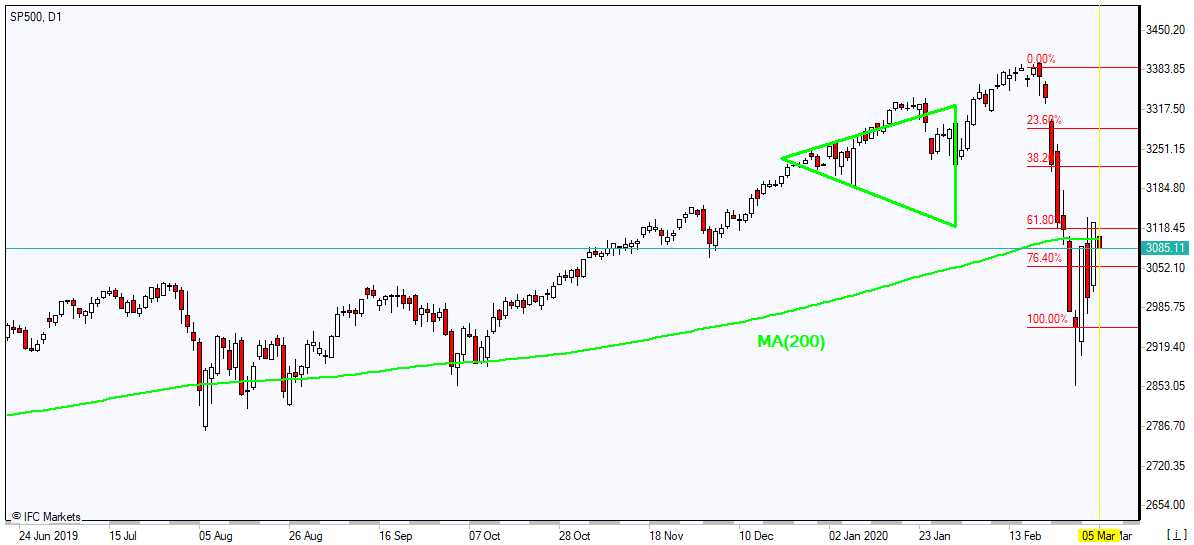
Risk-on sentiment has returned once again with Wall Street leading a significant rally on Wednesday. The Dow Jones Industrial Average soared 4.5% to close above 27,000. The S&P 500 and Nasdaq Composite also climbed 4.2% and 3.8% respectively. All three major US indices are now out of correction territory and the key question investors are now asking is whether this rally has further room to go.
Before attempting to answer this question, investors need to know that extreme volatility has become the new norm. We may continue to see daily moves of 2% to 4% in either direction until the dust settles. However, yesterday’s surge in equities was supported by several factors:
US Presidential candidate, Joe Biden, performed strongly in the Super Tuesday Democratic party’s primaries. He is considered as the most market-friendly candidate compared to his opponents, Bernie Sanders and Elizabeth Warren. That has been evident in the rally of the healthcare sector, which climbed 5.9%.
The US Congress approved a bipartisan $8.3 billion emergency funding bill to tackle the coronavirus crisis. Part of this funding will go to research and development of vaccines, therapeutics, and diagnostics.
The IMF unveiled a $50 billion package of emergency financing for developing countries hit by the virus.
The Bank of Canada followed in the Fed’s footsteps by reducing its Benchmark rate by 50 basis points.
The US services sector activity accelerated to a one-year high last month, suggesting strength in this part of the economy, despite the coronavirus outbreak.
While all these factors encouraged risk-taking, the higher moves in stocks may prove to be temporary. When looking at other asset classes such as bonds and currencies, they do not reflect the same enthusiasm we’ve seen in stocks. The safe-haven Yen remained near its 5-months high against the USD. Meanwhile, yields on US 10-year treasury bonds are barely trading above 1%.
The number of people infected by the coronavirus is likely to increase rapidly over the next couple of weeks and by the weekend, it’s expected to hit more than 100,000 globally, a headline that would have a negative impact on investors’ sentiment. More people will be sent to work from home, schools will continue to close and more events will be canceled around the world. The panic mode is clearly evident when you go to grocery stores and find many shelves empty. This is not just in Asia, but across Europe, US and Australasia. Consumers are stocking up as they prepare for the worst. Such behavior will start appearing in economic data this month and hence on asset prices further out.
We still don’t know the full impact on corporate earnings for 2020 and US companies will be lucky if they achieve zero earnings growth. That’s yet to be priced in by equity markets, but the shape of the recovery is essential for the next move. Whether it’s a V, W, or U-shaped recovery is still unknown. It all depends on when this health crisis will be solved and until we get there, expect monetary and fiscal stimulus to only have little impact on asset prices.
Disclaimer: The content in this article comprises personal opinions and should not be construed as containing personal and/or other investment advice and/or an offer of and/or solicitation for any transactions in financial instruments and/or a guarantee and/or prediction of future performance. ForexTime (FXTM), its affiliates, agents, directors, officers or employees do not guarantee the accuracy, validity, timeliness or completeness, of any information or data made available and assume no liability as to any loss arising from any investment based on the same.
On Wednesday, March 4, trading on the euro ended in decline. The pair corrected during the day after setting a new high as a result of the US Federal Reserve’s decision to reduce rates by 50 bp. The impetus for the selling of the euro was provided by the strengthening of the dollar off the back of the release of promising economic data.
The index of business activity in the service sector in the United States was above the forecast and hit a new high for the year. The ISM index in February rose to 57.3. Employment in the US private sector grew by 183,000, which was substantially more than the forecast of 170,000. The indicator for January was revised downwards by 82,000. Since the US Fed has already cut interest rates, employment data has become uninteresting to speculators.
Major US stock indexes rose from 3.7% to 4.5%, this was all as a result of the news concerning former Vice President Biden and his campaign to become the preferred presidential candidate for the Democratic Party in the United States.
Expectations regarding a weakening of the euro came true. The price fell below the balance line (Lb) and the level of 1.1120 (lower line of the channel). In Asian trading, the euro is under pressure against other currencies. Even though the stochastics show the price is in the “buy zone”, we are still daring to consider the continuation of correctional movement to the 135th degree – 1.1053. From here it will already be possible to look out for signals to buy the euro.
There are no European stats coming out today. The scheduled Carney and Poloz speeches are happening later on in the evening, the information they announce will be interesting to market players. Following the Fed, the Bank of Canada lowered its basic interest rate by 0.50% to 1.25%.
US stock market rebounded on Wednesday after the surprise half-a-percentage-point rate cut by the Fed on Tuesday. The S&P 500 advanced 4.2% to 3130.12. The Dow Jones industrial average jumped 4.5% to 27090.86. Nasdaq rose 3.9% to 9018.09. The dollar weakening stalled as the Institute for Supply Management reported its nonmanufacturing index in February rose to 57.3% from 55.5% in the previous month. The live dollar index data show the ICE US Dollar index, a measure of the dollar’s strength against a basket of six rival currencies, rose 0.2% to 97.37 but is lower currently. Futures on stock indexes point to lower openings today.
FTSE 100 led European indexes recovery
European stocks extended gains on Wednesday. EUR/USD reversed lower yesterday while GBP/USD accelerated its climb with both pairs higher currently. The Stoxx Europe 600 ended up 1% led by utility shares. Germany’s DAX 30 advanced 1.2% to 12127.69. France’s CAC 40 gained 1.3% while UK’s FTSE 100 rose 1.5% to 6815.59.
Shanghai Composite leads Asian indexes recovery
Asian stock indices are sharply higher today tracking changes on Wall Street overnight. Nikkei added 1.1% to 21330.50 despite yen resuming its climb against the dollar. Markets in China are rising: Shanghai Composite Index is 2% higher while Hong Kong’s Hang Seng Index is up 1.7%. Australia’s All Ordinaries Index rebounded 1.1% despite Australian dollar’s continuing climb against the greenback.
Brent futures prices are extending losses today. Prices fell yesterday after the Energy Information Administration report US crude oil inventories rose by smaller than expected 785 thousand barrels last week: May Brent lost 1.4% to $51.13 on Wednesday.
Gold falls as Dollar strengthens
Gold prices are extending losses while dollar inched up. The price of an ounce of gold for April delivery slipped 0.1% to $1643 an ounce on Wednesday.
Note: This overview has an informative and tutorial character and is published for free. All the data, included in the overview, are received from public sources, recognized as more or less reliable. Moreover, there is no guarantee that the indicated information is full and precise. Overviews are not updated. The whole information in each overview, including opinion, indicators, charts and anything else, is provided only for familiarization purposes and is not financial advice or а recommendation. The whole text and its any part, as well as the charts cannot be considered as an offer to make a deal with any asset. IFC Markets and its employees under any circumstances are not liable for any action taken by someone else during or after reading the overview.
Sri Lanka’s central bank left its key interest rates steady, saying its current accommodate monetary policy stance was appropriate and there is “ample space for market lending rates to reduce without a further adjustment in policy rates at this juncture.”
The Central Bank of Sri Lanka (CBSL) has already lowered its rates three times since May 2019 by a total of 150 basis points, most recently on Jan. 29 this year when it became the first central bank to cut rates after the outbreak of the coronavirus in China began to affect financial markets.
The rate cuts and other regulator measures taken by CBSL over the past months has led to a decline in market lending rates but the central bank said a faster downward adjustment was required to pass on the full benefits of recent policy measures to borrowers and the economy.
“Such downward adjustment in the market lending rates would also help weather any short term impact on financial markets and the real economy arising from the COVID-19 outbreak,” CBSL said, adding it would continue to monitor developments, including the spread of the virus and its effects on Sri Lanka “while standing ready to provide liquidity to domestic financial markets as necessary.”
CBSL left its Standing Deposit Facility Rate (SDFR) and its Standing Lending Facility Rate (SLFR) at 6.50 percent and 7.50 percent, respectively.
The coronavirus is likely to affect Sri Lanka’s economy but the extent of this would depend on the global spread of the virus, its persistence and the policy responses of major economies and partners.
“Sri Lanka’s economic links with China could be directly affected as significant volumes of consumer goods, intermediate goods and investment goods are imported from China,” with a likely slowdown of the global economy and disruptions to the supply chain affecting Sri Lanka’s exports and related logistics.
A decline in tourism would also affect Sri Lanka’s tourism sector while the spread of the virus to countries with a significant number of Sri Lankan migrant workers could affect remittances.
“These adverse implications are likely to outweigh any marginal benefit arising from reduced global energy prices and international interest rates,” it added.
The hit to Sri Lanka’s economy comes just as the country is slowly recovering from the 2019 Easter Sunday bombings, which killed more than 250 people, dealing a heavy blow to its tourism sector.
Gross domestic product rose 2.7 percent year-on-year in the third quarter of 2019, up from 1.5 percent in the second quarter, and last month the International Monetary Fund (IMF) forecast Sri Lanka’s economy would grow 3.7 percent this year, up from an estimated 2.6 percent in 2019, helped by a solid performance of the manufacturing sector and a rebound in the tourism sector.
However, the IMF on Feb. 7 said this forecast assumed the coronavirus would only have a limited negative effect on tourism.
The Purchasing Managers’ Index for January slowed to 54,0 from 54,.3 in December with suppliers’ delivery times lengthening significantly, especially in the textile and apparel sector, due to the coronavirus outbreak.
Many other respondents to the survey from the textile sector also highlighted that imports from China had been delayed indefinitely.
Sri Lanka’s headline inflation rate has risen in the last four month to 6.2 percent in February from 5.7 percent in January, but CBSL says this is solely due to the comparison with a low rate in February last year.
Core inflation, which reflects underlying inflation, rose to 3.2 percent from 3.0 percent while the average core rate eased to 5.1 percent in February from 5.3 percent in January.
The central bank said it expects inflation to stabilize within its desired range of 4-6 percent over the medium term.
Sri Lanka’s rupee, which fell in the second half of 2018, has been relatively stable in recent months and was trading around 182 to the U.S. dollar today, marginally down from 181.7 at the start of the year.
The Central Bank of Sri Lanka released the following statement:
“The Monetary Board of the Central Bank of Sri Lanka, at its meeting held on 04 March 2020, decided to maintain the Standing Deposit Facility Rate (SDFR) and the Standing Lending Facility Rate (SLFR) of the Central Bank at their current levels of 6.50 per cent and 7.50 per cent, respectively, and thereby continue its accommodative monetary policy stance. The Board arrived at this decision following a careful analysis of the current and expected developments in the domestic economy and the financial market as well as the global economy. The decision of the Monetary Board is consistent with the aim of maintaining inflation in the 4-6 per cent range while supporting economic growth to reach its potential over the medium term. Many economies are becoming increasingly accommodative amidst global growth concerns The escalation of the coronavirus (COVID-19) outbreak to a ‘global health emergency’ and its potential to become a pandemic pose significant threats to global economic recovery in 2020. The widespread impact on China, the world’s second largest economy, will have spillover effects on the global economy through weakening trade, tourism and investment flows. The recent rapid rise in cases outside China highlights the high degree of health and economic contagion that the outbreak entails. Policymakers around the globe are expected to intensify policy support to address the effect of the outbreak on global demand and supply conditions, while monetary policies in both advanced economies and emerging market and developing economies are projected to be relaxed at a faster pace than previously envisaged.
The COVID-19 outbreak is likely to affect Sri Lanka’s economic performance The exact impact on the Sri Lankan Economy would depend on the extent of the global spread of the COVID-19 outbreak, its persistence and policy responses of major economies and trading partners. Sri Lanka’s economic links with China could be directly affected as significant volumes of consumer goods, intermediate goods and investment goods are imported from China. The likely slowdown of the global economy and disruptions to the supply chain could affect Sri Lanka’s merchandise and service exports as well as related logistics. The slowdown in global tourist movements will affect Sri Lanka’s tourism sector, in addition to the direct impact of lower arrivals from China. The spread of the virus to countries with a significant number of Sri Lankan migrant workers could affect remittance inflows as well. These adverse implications are likely to outweigh any marginal benefit arising from reduced global energy prices and international interest rates. Continued policy support would ensure a gradual recovery of domestic economic activity over the medium term Despite global disruptions to growth caused by the spread of COVID-19 and uncertainties in the domestic market due to upcoming elections and the delayed presentation of the annual government budget, the economy is expected to somewhat recover in 2020 from the current subpar performance, supported by monetary and fiscal stimulus measures complemented by improving investor confidence. However, the introduction of appropriate structural reforms is essential to foster high economic growth, given limited policy spaces available to sustain such momentum over the medium to long term. External sector remains resilient despite rising global uncertainties A notable improvement was observed in the external current account balance in 2019, with the trade deficit contracting significantly as a result of a sharp decline in the growth of imports and a marginal growth of exports. The tourism sector witnessed a faster than expected recovery in 2019 following the Easter Sunday attacks. Yet, the COVID-19 outbreak is likely to pose challenges to the tourism sector in the period ahead. Workers’ remittances that moderated in the first eleven months of 2019, showed an improvement in December 2019 as well as January 2020. In the meantime, foreign investment in rupee denominated government securities recorded a net outflow thus far in 2020, partly due to increased investor appetite for safe haven assets amidst rising global uncertainty. Outflows of foreign investment from the secondary market of the Colombo Stock Exchange (CSE) remained modest thus far during the year. Reflecting these developments, the Sri Lankan rupee remained broadly stable with a marginal depreciation, while gross official reserves stood at US dollars 7.5 billion by end January 2020, sufficient to cover 4.5 months of imports.
Inflation is expected to stabilise within the desired range over the medium term despite transitory deviations arising from supply side disruptions In January and February 2020, headline inflation, as measured by the year-on-year change in the Colombo Consumer Price Index (CCPI) showed an unexpected uptick, driven by a rapid acceleration in food inflation. Headline inflation based on the National Consumer Price Index (NCPI), which has a higher weight on food, also recorded a notable acceleration in January 2020. However, reflecting the subdued aggregate demand conditions, core inflation based on both CCPI and NCPI currently remains below 4 per cent. Meanwhile, vegetable prices showed a sharp downward adjustment since end February with improving supply conditions. Accordingly, the latest projections indicate that inflation would decline in the near term and stabilise within the desired range thereafter. Although demand driven inflationary pressures in the near term are not envisaged, the Central Bank will continue to closely monitor incoming data and take proactive measures to ensure the continued anchoring of inflation expectations in mid single digit levels. An acceleration in the growth of money and credit aggregates was observed in January 2020 The year-on-year growth of credit extended to the private sector by commercial banks continued to accelerate in January 2020, although the absolute increase during the month was marginal compared to the average monthly increases observed since August 2019. Meanwhile, credit to the government increased notably in January 2020, reflecting its increased financing needs. Driven by the domestic credit expansion, broad money growth (year-on-year) also accelerated in January 2020. With the ongoing pass-through of policy measures to market lending rates and improving business confidence, the growth of credit to the private sector is expected to accelerate further, thereby supporting the envisaged expansion in economic activity in the period ahead. Market lending rates are expected to reduce further Market lending rates continued to decline as a result of the accommodative monetary policy stance and the regulatory measures taken by the Central Bank over the past several months. However, a faster downward adjustment in market lending rates is required to pass the full benefit of recent policy measures to borrowers, thereby to the economy.
Policy interest rates maintained at current levels
In consideration of the current and expected macroeconomic developments as highlighted above, the Monetary Board, at its meeting held on 04 March 2020, was of the view that the current accommodative monetary policy stance is appropriate, and decided to maintain the Standing Deposit Facility Rate (SDFR) and the Standing Lending Facility Rate (SLFR) of the Central Bank at their current levels of 6.50 per cent and 7.50 per cent, respectively. The Monetary Board was also of the view that there is ample space for market lending rates to reduce without a further adjustment in policy rates at this juncture. Such downward adjustment in the market lending rates would also help weather any short term impact on financial markets and the real economy arising from the COVID-19 outbreak. The Central Bank will continue to monitor domestic and global macroeconomic and financial market developments, including the impact of the spread of COVID-19 globally and its effects on Sri Lanka, with a view to maintaining stable economic conditions in the period ahead, while standing ready to provide liquidity to domestic financial markets as necessary.” www.CentralBankNews.info
Maurice Jackson of Proven and Probable sits down with Andy Schectman, president of Miles Franklin Precious Metals Investments, to talk about ways to invest in precious metals.
Maurice Jackson: Today we will discuss the merits of owning government minted coins versus private minted coins. Joining us for conversation is Andy Schectman, the president of Miles Franklin Precious Metals Investments.
Glad to have you on the program to discuss an important topic for precious metals investors and in particular silver investors. But before we begin, sir, for first time readers, please introduce Miles Franklin Precious Metals Investments and the merits of becoming a client.
Andy Schectman: Miles Franklin is celebrating its 30th year in business this year. Since 1989 we’ve eclipsed $6 billion in transactions, and we’ve never had a customer complaint ever. We have never had a regulatory complaint. We maintain an A+ rating with the Better Business Bureau. We’re one of fewer than 30 companies ever approved by the United States Mint as an authorized reseller. We have all sorts of exclusives in the storage space and just a great reputation, but really that doesn’t mean very much to the State of Minnesota. The State of Minnesota is the only state in the United States to license and bond participants in the industry. So we are fully licensed, bonded, and background checked every single year, yourself included, myself included. And every employee at Miles Franklin has to be background checked and bonded. And what that really means above all else in a federally non-regulated industry is that the safety of the transaction is unparalleled, and the bonding alone has made over 95% of the industry boycott the State of Minnesota. It’s from the ownership of a company, the bonding alone is enough to make them say, “I’ll work in the other 49 states.” Miles Franklin is very proud of our reputation in and of itself. The accreditation by the State of Minnesota makes doing business with us and with Maurice as safe of a transaction as possible in this industry.
Maurice Jackson: Let’s begin today at the 30,000 foot level and define a term that is surrounded by a lot of ambiguity and that term is bullion. What is bullion? And how does this term apply to all precious metals?
Andy Schectman: Well, really bullion is anything from a bar or a round to a government issued coin. Bullion is a form of precious metals where the majority of the value is in the content of the metal, versus numismatics where the majority of the cost typically is in things associated with age and scarcity and rarity. As I hope to talk later on in this discussion, there is a melding of the two right now. But in general bullion is the majority of what you’re directly related to the content or the value of the metal included in the coin or the bar.
Maurice Jackson: How about the term spot price?
Andy Schectman: Spot price is the price that the metal is trading at 24 hours a day around the globe changing every single second. It’s just like watching a ticker on the Dow Jones Industrial Average, or the price of a barrel of oil. The spot price of gold is denominated typically in dollars world over and as the markets move around the globe is constantly being updated 24 hours a day, seven days a week.
Maurice Jackson: And what is the difference between the bid and the ask price?
Andy Schectman: The bid price is what someone will pay for an item. An ask price is what it will cost to buy the item from a company. So bid is sell back, ask is buy from.
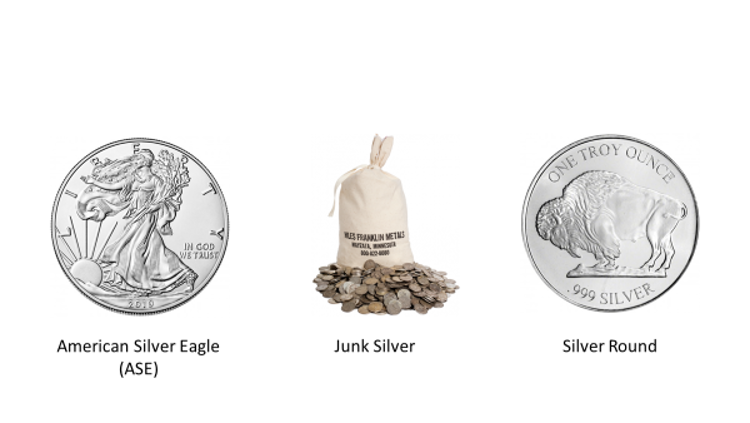
Maurice Jackson: I have displayed a U.S. Silver Eagle, junk silver and some silver rounds. Now there’s a lot of ambiguity regarding these coins and how they fit into one’s precious metals portfolio. Let me begin by asking what is a Silver Eagle? What is junk silver? And what is a silver round?
Andy Schectman: The Silver Eagle is the coin made by the United States Mint and has been made since 1986. It’s I guess you’d call it the Cadillac of silver in the industry. Probably the most sought after form of silver, it’s also the most expensive. The junk silver coins are dimes, quarters and half dollars minted prior to 1965. I think it gets a bad rap by the name of junk. Typically, it got that name because for many years dealers looked at it as difficult to accumulate and hold and store and bulky and oftentimes back when I started in this industry, I was able to acquire junk silver bags for under melt value and add 10, 15, cents an ounce and sell it for melt value or five or 10 cents over. I happen to think that the dimes and quarters and half dollars, otherwise known as junk silver or 90% silver by weight, is probably the best value penny-for-penny in silver right now.
And I’ve seen premiums in excess of $4.50 to $5 an ounce on junk silver and it really wasn’t anything even remotely close to junk at that point. And in fact there was a time in 2007, 2008 and 2009 when the perceived threat of confiscation from President Obama grew and premiums on these coins were higher than that of Silver Canadian Maple Leafs, or Australian Kangaroos. So I like them because there hasn’t been silver in our dimes and quarters since 1964, that was the last year that we saw it. From ’65 to ’69 they made 40% silver Kennedys but I really don’t count those. So pre ’65 dimes, quarters and half dollars, which can’t be reproduced, to me is really the best value because A, it’s the least expensive route right now and B, it can’t be reproduced. C, it’s the most flexible way of owning it in terms of a divisional or fractional form. It offers great utility and if things were ever to really get bad, I could see premiums on junk silver go parabolic. As far as one ounce rounds, Maurice, those are just one ounce coins that look very much like a Silver Eagle or a Gold Buffalo or a Saint Gaudens or whatever the design on that particular round is, but it’s not made by a government, so it doesn’t have a legal tender face value.
So really the difference is the face value that the government puts on the coin, which is rather meaningless in and of itself as the U.S. Silver Eagle has a $1 face value, but it’s an ounce of silver. And the Canadian Maple Leaf has a $5 face value, but has an ounce of silver. So it’s interesting that people who understand precious metals typically have some sort of an aversion to the economic policies of the governments that they reside under, yet very often prefer the government issued coins because of the stated purity, because of the government entity standing behind the authenticity. The bottom line is, as long as you’re doing business from a reputable company, it doesn’t matter what design is on the coin, whether it’s a pre ’65 dime or a Silver Buffalo Round made from a private refiner or an American Eagle.
The most important thing and in the end is it’s the number of ounces that matter. I would simply say to me the biggest consideration is to not cross the penny wise pound foolish threshold. In other words, some people may want to buy a 100 ounce bar of silver made by the same type of refiner that makes the one ounce rounds in an effort to maximize his or her dollar. But in reality it’s been my experience that whether you’re playing poker with your friends, or driving on a crowded highway, or just investing, or living life, you can never have too many outs or too many options or too many exits. And so I think that in general when we talk about the larger items versus the three items that you mentioned, the savings in buying a 10 ounce bar or 100 ounce bar is not commensurate with the loss of flexibility.
I think the three items that you mentioned, and I would throw in the Canadian Maple Leaf, to me are the best or most preferred ways of accumulating and holding silver: recognizable, sought after, very liquid, non-subjective. And the biggest difference with the junk silver is its flexibility and utility. If things ever got really, really bad, 14 dimes minted prior to 1965 is almost an exact ounce of silver. So when you talk about the ability to trade or barter with, I’ve heard lots of stories in 1979 with the oil embargo and inflation running a up towards 17%, our interest rates and inflation going through the roof. A lot of gas stations across the country were accepting a silver dime for a gallon of gas. Now, back then with silver almost at $50 you’re talking three and a half bucks melt value per silver dime. The gas stations were getting a good deal, but the moral of the story is when the currency in which you transact is inflating and becoming less desirable, the allure of having something very flexible in the form of junk silver to me is intriguing. And the fact that it can’t be reproduced offers potential, premium potential that you won’t find in any of the other items that we’ve mentioned.
Maurice Jackson: There are advantages and disadvantages to each of the silver products just referenced. And one of the most popular questions that we receive is which silver product is the best? And that’s a personal decision. But Andy, you had an experience going through customs one day that helped me answer that question that I never considered and completely made me reposition my entire silver portfolio. Would you mind sharing your experience with us?
Andy Schectman: Yeah, sure. So, it’s interesting, I’ve been telling people for a long time that it’s the legal tender face value that matters as you’re traveling. And really it’s important to note too, Maurice, you need to know where you’re traveling to. And I wouldn’t recommend this type of a deal south of the border, but in and out of Canada, in and out of Western Europe, in and out of Australia, New Zealand or back into the United States, this is real and it’s legal. I was coming back from Montreal, where we have a Brink’s facility and I met one of my largest clients who asked me as a favor to bring back on the airplane with me 240 Gold Maple Leafs, as one of his associates was being transferred to the United States. And the associate, it was his gold, asked me to bring it back and to put it into one of our depositories here in the United States on his behalf.
And I acquiesced as this was a very substantial client of mine and I brought it back with me on the airplane. Now when you go through customs in any Canadian airport, you go through United States immigration and customs at that airport, so when you land in your point of destination, for me it was Minneapolis, you get off the plane and you go, you don’t go through customs right there. So in any case, when I got up to the window, I have a Global Entry Card, which means I’ve met with Homeland Security and they vetted me in and gave me that card so they know who I am to a degree. I don’t know if it shows that I own a precious metals company when I go through the line, but nonetheless, when I got up to the window, the gentleman asked me what I had because 240 times 50, the face value of a Canadian Maple Leaf is $12,000 and as you know, Maurice, on the customs form, it says, are you carrying over $10,000? I wrote that I did, and I said yes, and that’s the only answer.
And when you get up to the window, they ask you, “What do you have as per that declaration?” And I said, “I have 240 Gold Maple Leafs. They’re $50 face value coins, I’m declaring $12,000.” And the gentleman wearing the United States Homeland Security garb said, “Well, that’s beyond my pay grade. You’re going to need to go to further screening.” And he shut the light off of his booth and walked out from behind and escorted me down a 45 degree ramp into the basement of the Montreal Airport in a room roughly the size of a small auditorium that was 100% mirrors and stainless steel. He said to me, “Sit down. Don’t touch your bag. Someone will be with you shortly.” I sat in that room alone for almost 45 minutes. And you could feel them, whoever them was, looking at me through the mirrors, waiting for me to shove coins down my pants or whatever it was they thought I might do.
And when the Department of Homeland Security supervisor finally appeared from outside of one of these mirrors, or inside of one of these mirrors rather, he asked me what I had and I said to him, “Just as I told your associates, sir, I have 240 one ounce Gold Maple Leafs, so I’m declaring $12,000. And I showed them a coin and I said, “See, it’s a $50 coin.” And he said to me, “Mr. Schectman, I’m inclined to believe you, but I need to ask you a few questions.” He said, “How much is the price of gold today?” And this was a couple of years ago, and I told them gold is $1,200 and he did the math in his head and he said, “Well, isn’t that nearly $300,000?” I said, “Yes sir, it is.” I said, “But listen, you could take this coin out into the lobby of the airport where there’s a Tim Horton’s. You could get a donut and a cup of coffee and now wouldn’t be the smartest thing you ever did, but they would have to take it and accept it as legal tender. This is a $50 face value coin produced by the Royal Canadian Mint, it’s legal tender.
So he says to me, “Well, I’m inclined to believe you, sir, but I’m going to borrow your coin and I’m going to do a little research. In the meantime you fill out this FENCIN form, and I’ll be back in a few minutes. And he disappeared behind one of the mirrors again. Now, this FinCEN form is a form you never want to see. And the acronym is something to the extent of financial enforcement network criminal investigation, something to that degree. And the form is very invasive and something that you know is going on a desk where you don’t ever want your social security on that desk.
And I was a little reticent at that point because this wasn’t even my stuff. But anyways, I had no choice and this far down the rabbit hole, so I had to fill it out. It’s a two page form and I filled it out and the gentleman came back and he said, “I’ll be darned. You’re right. It is legal tender. Here’s your coin back.” He said, “Let me see the FinCEN form.” And I hand it to him and he says, “Oh, wait a second, I almost forgot how much money do you have on you?” And I opened up my wallet and I said, “I have $37 and a $5 Canadian bill.” And he said, “Do you have any other money you want to tell me about, Mr. Schectman? And I said, “No, I don’t.” He says, “Are you sure?” And I said, “Geez, I might have some change in the bottom of my backpack.”
I think a bead of sweat drip down my temple because I’m thinking, do I have something that I don’t know about? Do I have some coins or some money in my bag? I didn’t know. I said, “No, I have nothing. Honestly I don’t.” He says, “Okay, you’re free to go.” And he tears up the FinCEN form. And I said to him, “Listen, I don’t mean to look a gift horse in the mouth. I have been sitting here for an hour and now you’re letting me leave without declaration. Can you please explain?” And he says, “I had a feeling you’d ask me that question.” And he says, “You’re entering the United States with 37 US dollars, a $5 Canadian bill and some change in your backpack. Is that correct? I said, “Yes, sir. That’s to the best of my knowledge, that is correct. He says, “You’re also entering the United States with $12,000 Canadian legal tender in the form of 240 Canadian Maple Leaves, $50 face value. Is that correct?” “Yes sir.” He said, “Well that exchange rate puts those at $9,400 in change. You’re under the $10,000 threshold. You’re free to go.” And he let me leave.
He let me leave without any declaration whatsoever. Well, that was the second time I’ve done that. I did something similar to that in Vancouver the year before to test out what I’ve always told people. The bottom line is simply this, if you are going somewhere where you’re not concerned about the customs, when you’re traveling with legal tender gold and legal tender silver, it is the face value of said coins that customs will record. Now, if I were going through with Krugerrands or one ounce bars, that is a no-no. Krugerrands have no face value. One ounce bars are just an ounce of gold and the minute you get over $10,000 in value in bullion value, you would have to declare it.
So I guess the bottom line here is that the face value does matter as it pertains to travel. One interesting side note I’ve always often wondered what the IRS would say when we talk about, I think it’s a $14,000 gift exclusion that each parent can give to a child. And I wonder what they would say about a US Eagle is a $50 coin too, giving 280 Gold Eagles to your child as a $14,000 gift exclusion. I don’t know what they would say about that, but it’s interesting when one hand of the government looks at it as legal tender and you wonder what the other side of the government feels about it if you were to challenge it. But nonetheless, I’ve had great experiences traveling across the border with legal tender gold as the face value and nothing else.
Maurice Jackson: What a compelling story. I remember when you shared that with me and I alluded to it earlier, how it changed my silver portfolio. I don’t know if you recall when you shared that with me, but I immediately got rid of all of my rounds and my 100 ounce bars and I immediately got to Eagles. I think that was a very prudent move and I appreciate you sharing that with our audience members, because a lot of us aren’t aware of that if we don’t travel outside of the United States and or we don’t have our bullion with us and if we did the advantages of having one versus the other. Switching gears here, from a price perspective, as you alluded to it earlier, using ratios, what are you sharing with your clients right now to purchase and why?
Andy Schectman: Well, I’d like to say on one hand I was wrong and on the other hand I think I’m going to be right. I was wrong at least so far in saying to people the ratio between platinum and palladium was so far out of whack they should trade their palladium to platinum. I look at the palladium market and the silver market and see great similarities. The palladium market has gotten so strong based upon lack of supply and huge institutional demand in the form of catalytics, that the traders have stopped trading it. The commercial banks have stopped manipulating it and what you see in the palladium market is a glimpse of what a real free market looks like. Palladium to me seems like a glimpse of what a free market looks like, where demand overwhelmed supply and the price goes parabolic.
The silver price and the ratio between silver and gold is ridiculously out of whack as much as it’s been in a hundred-plus years. Only a few times in the last 100 years have we seen anything near this, nearly 90:1. That is absolutely crazy and I use the same phrase all the time, it’s like four feet of snow in the Florida Keys. It’s really unbelievable. When you talk to some of the most respected mining names, what they see coming out of the ground is closer to 9:1. Silver is found in the earth in a form called epithermal close to the surface. And so the big deposits were found many years ago. Most of what is mined nowadays is by-product mining from other metals. And so much of the silver that is used in industry and has been used for so many years has gone forever, never to be recaptured. It’s in motherboards, in landfills. The ratio of 16:1 that we saw forever, the ratio of a 90:1 that we see right now is not right.
And the bottom line is simply this, at a nearly 90 to one ratio, it is an absolute gift. And I feel that way, not just because of the mathematics of it and how unusual that ratio is, but when you take a glimpse at the most sophisticated, well-funded, well-informed, and nefarious traders on the globe, JP Morgan, there may be close to a billion ounces accumulated of silver over the last 10 years, 12 years, according some of the silver experts that follow the silver fundamentals very closely. And they point out that they see the most sophisticated traders on the globe cornering the physical market of silver.
And at that level they have been holding down the paper price to create a perception of reality that has allowed them to scoop up all the physicals at ridiculously low prices. So the bottom line, silver is the most undervalued commodity on the planet. And I would challenge anyone to find a commodity that is trading for a third of its all-time high from 1980. There’s nothing like it, and in and of itself, the fact that you’re seeing such massive accumulation by the commercial banks, I think puts an exclamation point on how undervalued it is. And I think that should consider trading your gold for silver at these inflated ratio numbers with the expectation of trading back to gold when the ratio normalizes. For the last 150 years roughly, the average ratio between gold and silver has been 42:1, so we are past double.
The last time we saw our ratio about 80:1 was 2010, and one year later in 2011 you had $50 silver and $2,000 gold, 40:1. So the idea to me if someone wanted to capitalize on these ratios is not to move everything into silver because it’s so undervalued, or because JP Morgan is cornering the market of physical, it’s to do so realizing that the ratio or mathematical historical averages and ratios are there for a reason. And the further away you get from those long-term established averages, the greater the magnetism that pulls you back. Now, I was wrong with palladium. Palladium got way ahead of I think what anyone thought it would do and the traders gave up on it. I think you could see that with silver too. Huge, huge supply demand imbalances. And so I think you could see a point where silver starts to move so fast that the commercial banks get on the long side of it and let it run instead of trying to hold it back.
And the potential for silver I think is parabolic. Now if someone does trade their gold for silver, I would do it with the intention, however, of doubling the amount of gold I started with, just when the ratio comes back to its mean, to its average. You could trade 10 ounces of gold right now at 90:1 and into silver. And when silver falls or the ratio falls back to the 45:1 or 42:1, switch back to gold and double what you started with without paying a penny. That’s the idea.
But I will simply say this, that logic and outcome sometimes are inversely correlated in this world. And palladium and platinum is a great example, because for the past 18 months I would have thought that trading palladium for platinum was such a great idea, because the 30 years before that, most of the time palladium was one third the price of platinum and right now it’s three times the price of platinum. So there are a lot of imbalances right now and a lot of anomalies and the gold to silver ratio is one of them. The biggest of them all is palladium to platinum and I guess I would just say that palladium is an example of what I think silver could be and what gold could be. When the prices start to move on the upside and the commercial banks give up on trying to hold them back, you will very quickly see what a free market looks like.
Maurice Jackson: Andy, we referenced the buying opportunity before, since silver, and I want to get to gold because there is one buying opportunity within gold, but within silver, if I understand correctly, is the best value proposition you see within silver, junk silver?
Andy Schectman: It is. I really think there’s nothing that compares to it. It’s the least expensive. It can’t be reproduced. It’s the most flexible and it offers premium potential because of the fact that it can’t be reproduced. You don’t get that in rounds and in bars and to a lesser extent in government issued coins. For example, in any of the government issued gold coins, as you move down in denomination from one ounce, to one half ounce, to one quarter ounce, to one tenth ounce, you pay a higher premium. The mint charges more. If you buy a 100 ounce bar, you pay less than if you buy 100 one-ounce rounds. But here you get the greatest form of flexibility, plus a free call on I guess numismatic premiums not the right word, but a free call on scarcity premium. Whether or not happens is irrelevant. It’s happened before, could happen again. But you get a free call on that and it’s the least expensive route. To me, it’s by far the best choice.
Maurice Jackson: And speaking of numismatic gold, we touched on that in previous interviews. What is the buying opportunity before us there?
Andy Schectman: The $10 and $20 gold pieces in Mint State 62, 63, 64 are the best value I’ve seen in gold in 30 years, Maurice. What is really strange is the fact that gold is at all- time highs in almost 80 currencies. It’s at all-time highs or real close to in Canadian dollars in Aussie dollars, in the euro just last week, and most major currencies, I think with the exception of Swiss francs and the dollar, it’s at all- time highs. The rest of the world understands the significance of precious metals. The central banks reclassification of gold as a tier one asset, and their enormous accumulation since 2018 shows that there is a huge demand for precious metals. I mean the price is up almost 30% since last January. But what’s interesting about it is that in the United States, there are the lowest premiums across the board in gold and silver that I’ve seen in 30 years. Whether you’re talking junk silver coins, whether you’re talking Gold and Silver Eagles, secondary market Gold and Silver Eagles, or in this case numismatics.
You can buy certified uncirculated $20 gold pieces for less than you can a Gold Eagle. I have never seen that in 30 years ever. And so the reason people normally say don’t buy numismatics is that the premiums are too high and you’re paying more money for age and scarcity and collector premium than you are for the underlying content. Right now, for the first time in my 30-year career, that’s not true. In fact, there is no opportunity cost. And when we talk about a free call on numismatic premium, I know we’re talking about trading gold to silver as really the ultimate value play, but for people who want gold, in my entire career, I have never seen a better value ever than in the uncirculated $20 gold pieces. They were trading in 2007, 2008 and 2009, with $1,000 gold, they were trading as much as 60%, 70% premium above a $1,000 gold price, again with the threat or the perceived threat of confiscation from President Obama. All I can tell you is that I’ve done this for a very long time and they’re trading at price levels I never ever thought I would see, the very finest value in gold that I’ve ever seen in 30 years.
Maurice Jackson: Andy, for someone who wants to take advantage of these buying opportunities, what’s the best way for them to contact you?
Andy Schectman: Well, they can email me directly at [email protected].
or 800.255-1129.
Maurice Jackson: And as a reminder, I’m the proud licensed representative for Miles Franklin Precious Metals Investments, where we provide a number of options to expand your precious metals portfolio, from physical delivery, offshore depositories, precious metal IRAs and private blockchain, distributed ledger technology.
Call me directly at 855-505-1900 or you may email [email protected]. Finally, we invite you to subscribe to www.provenandprobable.com. We provide Mining Insights and Bullion Sales. Andy Schectman of Miles Franklin Precious Metals Investments. Thank you for joining us today on Proven & Probable.
Maurice Jackson is the founder of Proven and Probable, a site that aims to enrich its subscribers through education in precious metals and junior mining companies that will enrich the world.
Disclosure: 1) Statements and opinions expressed are the opinions of Maurice Jackson and not of Streetwise Reports or its officers. Maurice Jackson is wholly responsible for the validity of the statements. Streetwise Reports was not involved in the content preparation. Maurice Jackson was not paid by Streetwise Reports LLC for this article. Streetwise Reports was not paid by the author to publish or syndicate this article. 2) This article does not constitute investment advice. Each reader is encouraged to consult with his or her individual financial professional and any action a reader takes as a result of information presented here is his or her own responsibility. By opening this page, each reader accepts and agrees to Streetwise Reports’ terms of use and full legal disclaimer. This article is not a solicitation for investment. Streetwise Reports does not render general or specific investment advice and the information on Streetwise Reports should not be considered a recommendation to buy or sell any security. Streetwise Reports does not endorse or recommend the business, products, services or securities of any company mentioned on Streetwise Reports. 3) From time to time, Streetwise Reports LLC and its directors, officers, employees or members of their families, as well as persons interviewed for articles and interviews on the site, may have a long or short position in securities mentioned. Directors, officers, employees or members of their immediate families are prohibited from making purchases and/or sales of those securities in the open market or otherwise from the time of the interview or the decision to write an article until three business days after the publication of the interview or article. The foregoing prohibition does not apply to articles that in substance only restate previously published company releases.
Proven and Probable LLC receives financial compensation from its sponsors. The compensation is used is to fund both sponsor-specific activities and general report activities, website, and general and administrative costs. Sponsor-specific activities may include aggregating content and publishing that content on the Proven and Probable website, creating and maintaining company landing pages, interviewing key management, posting a banner/billboard, and/or issuing press releases. The fees also cover the costs for Proven and Probable to publish sector-specific information on our site, and also to create content by interviewing experts in the sector. Monthly sponsorship fees range from $1,000 to $4,000 per month. Proven and Probable LLC does accept stock for payment of sponsorship fees. Sponsor pages may be considered advertising for the purposes of 18 U.S.C. 1734.
The Information presented in Proven and Probable is provided for educational and informational purposes only, without any express or implied warranty of any kind, including warranties of accuracy, completeness, or fitness for any particular purpose. The Information contained in or provided from or through this forum is not intended to be and does not constitute financial advice, investment advice, trading advice or any other advice. The Information on this forum and provided from or through this forum is general in nature and is not specific to you the User or anyone else. You should not make any decision, financial, investments, trading or otherwise, based on any of the information presented on this forum without undertaking independent due diligence and consultation with a professional broker or competent financial advisor. You understand that you are using any and all Information available on or through this forum at your own risk.
MAG Silver’s two recent announcements about its project in Mexico are relayed and commented on in a ROTH Capital Partners report.
In a Feb. 27 research note, ROTH Capital Partners analyst Joe Reagor noted that MAG Silver Corp. (MAG:TSX; MAG:NYSE A) and joint venture partner Fresnillo Plc (FRES:LSE) moved up the production start for Juanicipio and raised preproduction capex estimates. “These results are essentially offsetting,” Reagor noted.
Production from Juanicipio’s underground mine now is slated to begin in mid-2020. “The pull forward of production as a significant positive for the company as it should provide cash flow to offset ongoing capital expenditures,” Reagor wrote.
The joint venture partners will not commission the flotation plant at Juanicipio until mid-2021, however. In the interim, ore will be processed at one of Fresnillo’s nearby plants.
Now, preproduction capex for Juanicipio is forecast to be $440 million, up 11.4% from $395 million. “This had a negative impact on our discounted cash flow, but we still estimate the company has the necessary funding to complete construction without further dilution,” Reagor commented.
ROTH has a Buy rating and a US$23 per share price target on MAG, whose stock is currently trading at around US$9.64 per share.
Disclosure: 1) Doresa Banning compiled this article for Streetwise Reports LLC and provides services to Streetwise Reports as an independent contractor. She or members of her household own securities of the following companies mentioned in the article: None. She or members of her household are paid by the following companies mentioned in this article: None. 2) The following companies mentioned in this article are billboard sponsors of Streetwise Reports: MAG Silver. Click here for important disclosures about sponsor fees. 3) Comments and opinions expressed are those of the specific experts and not of Streetwise Reports or its officers. The information provided above is for informational purposes only and is not a recommendation to buy or sell any security. 4) The article does not constitute investment advice. Each reader is encouraged to consult with his or her individual financial professional and any action a reader takes as a result of information presented here is his or her own responsibility. By opening this page, each reader accepts and agrees to Streetwise Reports’ terms of use and full legal disclaimer. This article is not a solicitation for investment. Streetwise Reports does not render general or specific investment advice and the information on Streetwise Reports should not be considered a recommendation to buy or sell any security. Streetwise Reports does not endorse or recommend the business, products, services or securities of any company mentioned on Streetwise Reports. 5) From time to time, Streetwise Reports LLC and its directors, officers, employees or members of their families, as well as persons interviewed for articles and interviews on the site, may have a long or short position in securities mentioned. Directors, officers, employees or members of their immediate families are prohibited from making purchases and/or sales of those securities in the open market or otherwise from the time of the interview or the decision to write an article until three business days after the publication of the interview or article. The foregoing prohibition does not apply to articles that in substance only restate previously published company releases.
Disclosures from ROTH Capital Partners, MAG Silver Corp., Company Note, February 27, 2020
Regulation Analyst Certification (“Reg AC”): The research analyst primarily responsible for the content of this report certifies the following under Reg AC: I hereby certify that all views expressed in this report accurately reflect my personal views about the subject company or companies and its or their securities. I also certify that no part of my compensation was, is or will be, directly or indirectly, related to the specific recommendations or views expressed in this report.
ROTH makes a market in shares of MAG Silver Corp. and as such, buys and sells from customers on a principal basis.
ROTH Capital Partners, LLC expects to receive or intends to seek compensation for investment banking or other business relationships with the covered companies mentioned in this report in the next three months.
While silver has thus far lagged the gains of gold, a number of trends underlying the metal should pave the way for a new leg up very soon, according to McAlinden Research Partners.
Summary: Amid the precious metals rally that was set off by the rapid spread of coronavirus and uncertainty around the ability to contain it, gold prices had ratcheted up to a seven-year high. While silver lagged the gains of gold, a number of trends underlying the metal, including a rising gold/silver ratio, increased sales of gold by large silver miners, and steadily rising inflation, should pave the way for a new leg up very soon.
While other commodities have fallen in the wake of the COVID-19 (colloquially known as coronavirus) outbreak in China, precious metals have extended their strong 2020 performance until the big sell-off last week.
Gold spot prices broke above $1600 per ounce (oz) for the first time since 2013 and strengthened even further to break above $1680/oz last Monday. Commerzbank reported that inflows of gold into exchange-traded funds had risen for 21 consecutive business days through February 20. Not only are investors looking to hedge against the uncertain outcome of the coronavirus, but central bank demand remains healthy as their purchases are equivalent to approximately 20% of new gold production, according to Kitco. Silver, for its part, continued higher as well, reached its highest closing level since last September, climbing to $18.31/oz last Monday.
Large speculators sharply hiked their bullish positioning in gold futures by 22% in the week before the sell-off, according to data from the Commodity Futures Trading Commission. However, precious metals were caught up the volatility storm, causing money managers to trim some of those positions. Despite that trimming, BMO and Commerzbank noted that Gold ETFs tracked by Bloomberg still registered sizable inflows of “a good 9 [metric] tons.”
On a technical basis, more upside looks likely for precious metals. Kitco predicts that gold bulls’ next upside price objective is to produce a close in April futures above solid resistance at $1,700/oz, with support at $1,620.00/oz. A break above the $1700 level would mark the highest price for gold since December 2012.
Though silver has not yet surged as much as gold has, it is likely that silver will make an especially strong move upward soon.
Silver miners have actually outperformed gold miners since last summer, they still trail gold miners over the long term, leaving more upside potential to still be tapped. Additionally, while the gold/silver ratio cratered down to 81 from a multi-decade high of 93 in the late summer on a period of relative outperformance for silver, the ratio has been on the rise again in the past few months, peaking out at just below 90 this month. This, combined with strong miner performance that typically leads the strength in spot prices, suggests that silver is still set to make another leg up to catch up with the strength in gold.
The performance of silver miners is becoming more and more dependent on gold than it had been in the past. The Global X Silver Miners ETF’s (SIL) 17 highest weighted miners averaged just 40.4% of their Q3’19 revenues from silver, according to The Bull.com.au. The majority of their sales came from gold, which carries much stronger cash flows, bolstering traditional silver miners. The more gold the major silver miners produce, the more they trade like gold stocks amplifying that metal’s trends.
Though MRP continues to believe coronavirus will have a material impact on first quarter growth in China and the rest of the globe, as noted in our January viewpoint, we believe that it doesn’t have the disruptive potential to create a sustained downturn or resulting recession. Demand in most markets is only being delayed by supply chain backups, as opposed to destroyed by declining financial health of major economies and their institutions. However, the precious metals do have the potential to be one of the asset classes that continues its run even after the coronavirus begins to subside with the end of flu season in March.
While a surprise 50bps cut to the Fed Funds rate on March 3 will provide support to the market, it will likely drive even stronger inflows into gold and silver assets as well, since it effectively legitimizes the perceived economic threat arising from the virus.
As we have maintained since August, we believe the greenback is set for a sustained bout of weakness after a long rally through 2019. Before coronavirus shock sent traders scrambling for safe havens, including the dollar, that is exactly what was happening as the spread between U.S. real rates and real rates of other major currencies like the euro had been tightening for some time, driving dollar depreciation.
After pushing the Fed Funds rate up to its highest level since the 2008 financial crisis in late 2018, the U.S. Federal Reserve was forced to admit that they probably raised short-term rates too quickly, pulling the upper limit back by 100bps in 2019. More cuts now seem likely.
While the dollar had surged alongside higher rates, it fell alongside the new monetary easing cycle and rising U.S. inflation. Lior Gantz, founder of the Wealth Research Group, told Kitco that silver is the true inflation gauge in the marketplace since it carries no “geopolitical premium” like gold does. Higher inflation, Gantz added, is expected to push gold prices higher yet.
Precious metals had also benefited from the weaker dollar, as they usually do, in late 2019, but that historically inverse relationship has broken down in the flight to safety we’ve seen over the last month. Both have been simultaneously rising steeply, but when the dust of coronavirus settles, it’s likely they’ll be headed back toward divergent paths. Because our base case for a weaker dollar remains in place, even if the Fed decides on further U.S. rate cuts this year, we believe spot prices for precious metals, particularly silver, as well as silver/gold miners, will be moving higher through 2020 as the dollar returns to depreciation.
Investors can gain exposure to gold and silver spot prices via the SPDR Gold Shares (GLD) and iShares Silver Trust (SLV) ETFs. The top gold and silver miner ETFs are the VanEck Vectors Gold Miners ETF (GDX) and the aforementioned Global X Silver Miners ETF (SIL).
This content was delivered to McAlinden Research Partners clients on February 25. To receive all of MRP’s insights in your inbox Monday – Friday, follow this link for a free 30-day trial.
McAlinden Research Partners (MRP) provides independent investment strategy research to investors worldwide. The firm’s mission is to identify alpha-generating investment themes early in their unfolding and bring them to its clients’ attention. MRP’s research process reflects founder Joe McAlinden’s 50 years of experience on Wall Street. The methodologies he developed as chief investment officer of Morgan Stanley Investment Management, where he oversaw more than $400 billion in assets, provide the foundation for the strategy research MRP now brings to hedge funds, pension funds, sovereign wealth funds and other asset managers around the globe.
Disclosure: 1) McAlinden Research Partners disclosures are below. 2) The following companies mentioned in this article are billboard sponsors of Streetwise Reports: None. Click here for important disclosures about sponsor fees. The information provided above is for informational purposes only and is not a recommendation to buy or sell any security. 3) Statements and opinions expressed are the opinions of the author and not of Streetwise Reports or its officers. The author is wholly responsible for the validity of the statements. The author was not paid by Streetwise Reports for this article. Streetwise Reports was not paid by the author to publish or syndicate this article. Streetwise Reports requires contributing authors to disclose any shareholdings in, or economic relationships with, companies that they write about. Streetwise Reports relies upon the authors to accurately provide this information and Streetwise Reports has no means of verifying its accuracy. 4) This article does not constitute investment advice. Each reader is encouraged to consult with his or her individual financial professional and any action a reader takes as a result of information presented here is his or her own responsibility. By opening this page, each reader accepts and agrees to Streetwise Reports’ terms of use and full legal disclaimer. This article is not a solicitation for investment. Streetwise Reports does not render general or specific investment advice and the information on Streetwise Reports should not be considered a recommendation to buy or sell any security. Streetwise Reports does not endorse or recommend the business, products, services or securities of any company mentioned on Streetwise Reports. 5) From time to time, Streetwise Reports and its directors, officers, employees or members of their families, as well as persons interviewed for articles and interviews on the site, may have a long or short position in securities mentioned. Directors, officers, employees or members of their immediate families are prohibited from making purchases and/or sales of those securities in the open market or otherwise from the time of the interview or the decision to write an article until three business days after the publication of the interview or article. The foregoing prohibition does not apply to articles that in substance only restate previously published company releases.
McAlinden Research Partners: This report has been prepared solely for informational purposes and is not an offer to buy/sell/endorse or a solicitation of an offer to buy/sell/endorse Interests or any other security or instrument or to participate in any trading or investment strategy. No representation or warranty (express or implied) is made or can be given with respect to the sequence, accuracy, completeness, or timeliness of the information in this Report. Unless otherwise noted, all information is sourced from public data.
McAlinden Research Partners is a division of Catalpa Capital Advisors, LLC (CCA), a Registered Investment Advisor. References to specific securities, asset classes and financial markets discussed herein are for illustrative purposes only and should not be interpreted as recommendations to purchase or sell such securities. CCA, MRP, employees and direct affiliates of the firm may or may not own any of the securities mentioned in the report at the time of publication.
By TheTechnicalTraders – March 3, 2020: the US Fed issued an emergency rate cut of 0.50% to move rates to levels near 1.0% as a result of global economic concerns related to the spread of the Coronavirus and the potential damage it may do to the global major economies. President Trump had been suggesting the US Fed needed to be ahead of the risks associated with future market expectations to allow for increased liquidity and global economic function. Yet, we believe this move by the US Fed came at the wrong time for most investors and traders.
The global markets had already begun a process of revaluing risk in the markets near the end of February 2020. After the Q1 earnings data was digested and the newest Chinese data became available, investors suddenly understood the risks that we had been warning about for most of January and February. Suddenly, the US markets collapsed and traders were revaluing forward expectations.
Now that the US Fed has engaged in a 0.50% rate cut, the real risk solidifies in investor minds as “hey, the Fed is acting in a manner to ease money supply in preparation for a broad global slowdown”. What does this mean for skilled traders? We’ll explore the future price action using our Adaptive Dynamic Learning modeling system.
DOW JONES Weekly Chart
This INDU Weekly chart showing the ADL predictive modeling system results suggests the INDU will likely rotate near current lows (near 27,000) with very high volatility. Current volatility ranges on the INDU suggest the US markets could rotate 1000 points a day very easily over the next few weeks. Near early April, our ADL modeling system is suggesting the INDU will attempt to rally back to near 29,500 setting up a potential Double-Top formation. Our earlier research suggests the INDU/YM will likely form a bottom well before the S&P and NASDAQ – so this aligns with our earlier research.
Once the Double-Top sets up – all bets are off as risk will be extremely high for another breakdown event. We believe a true bottom will form/setup sometime between May and June 2020. Therefore, any recovery in the INDU to levels near 29,500 before the end of April would strongly suggest the markets are setting up for a Q1 earnings collapse – and a potential for a much deeper price low to set up as a real bottom.
Nasdaq Weekly Chart
This NQ Weekly Chart highlights a shorter-term ADL projected price outcome. The reason we went further back in time to produce these results is because these ADL results aligned with price quite efficiently and also illustrated the perceived weakness in price throughout the end of 2019. Notice the CYAN DASH lines below the price in December 2019 – these are the ADL predictive price levels for that span of time. Near the early January 2020 price bars, the ADL predictive modeling system identified price levels that almost mirrored the NQ price activity. Currently, the ADL system is predicting the NQ will find temporary support near 9000 for a few weeks before breaking lower to levels near 8000~8200.
This price move, which is opposite that of the INDU, suggests the tech-heavy NASDAQ may continue to experience price pressure with a potential for a downside “waterfall” price event setting up.
Transportation Weekly Chart
Lastly, this TRAN (Transportation Index) Weekly chart highlights was we believe to be a more true valuation event setting up over the next 60 to 90+ days. This ADL chart suggests the TRAN price will almost immediately move back to levels near 11,000 (with a potential for a new high print above 11,300), then consolidate near 10,800 before breaking lower in late April or early May. This type of price action aligns with the Q1 results reflecting an economic contraction while optimistic investors attempt to push price levels back towards recent highs before the reality sets into the markets. The real forward expectations of Q2-2020 and Q3-2020 may be a fraction of levels reported for Q4-2019.
The US Fed is attempting to front-load the global markets with easier monetary policy to allow for unknown risks that may span 6 months out or longer. Our researchers believe the US stock market will set up a major bottom sometime between May and June 2020 (possibly a bit later) and from that point we expect the US markets to begin to move gradually higher. We believe this move will be similar to the downside price collapse that happened in January 2018 when the markets formed a clear Double-Bottom and began to move higher after May 2018 – eventually peaking above all-time highs.
Although the Fed fired an emergency rate cut of -0.50%, the reality is that investors may see this as a “miss” in terms of hitting a target. Yes, it eases capital flows and sets investor expectations to believe the US Fed is prepared for this risk – but it also diminishes the potential for the US Fed to take decisive action in Q2 or Q3 of 2020 if the markets collapse as we expect.
As we’ve been saying for many months, 2020 is sure to be an incredible year for skilled traders. Pay attention to our research to prepare for the biggest moves in the markets.
As a technical analysis and trader since 1997, I have been through a few bull/bear market cycles. I believe I have a good pulse on the market and timing key turning points for both short-term swing trading and long-term investment capital. The opportunities are massive/life-changing if handled properly.
I urge you visit my ETF Wealth Building Newsletter and if you like what I offer, join me with the 1-year subscription to lock in the lowest rate possible and ride my coattails as I navigate these financial market and build wealth while others lose nearly everything they own during the next financial crisis. Join Now and Get a Free 1oz Silver Bar!
The Dollar was back on its feet on Wednesday after being knocked over by the Federal Reserve’s surprise 50 basis point rate cut in the previous session.
Encouraging ADP NFP figures which showed private payrolls rising by 183,000 in February seem to have eased concerns over the health of the US economy in the face of the virus outbreak. Appetite for the Dollar is likely to increase ahead of the US jobs report on Friday as investors question whether the Fed will ease monetary policy despite strong economic fundamentals.
As of today, markets are pricing in a 90% probability of another rate cut when the Fed meets in March and a 44.5% of another cut in April. Should these predictions become reality, the Dollar is likely to weaken in the medium to long term due to the narrowing interest rate differentials between the Fed and other global central banks.
Focusing on the technical picture, the Dollar Index is staging a rebound on the daily charts with prices trading around 97.48 as of writing. An intraday breakout above 97.80 could open the doors back towards 98.50. Alternatively, if 97.80 proves to be reliable resistance, the Dollar Index could descend back towards 97.00.
Gold buoyed by rate cut bets
A sense of unease over how badly the coronavirus outbreak will hit the global economy should influenced Gold’s outlook this month.
The precious metal received a welcome boost in the previous session thanks to the Federal Reserves emergency interest rate cut. Speculation over the Fed and other global central banks easing policy should push Gold higher due to its zero-yielding nature.
General uncertainty and fears over the global economy are poised to accelerate the flight to safety – ultimately bolstering appetite for Gold.
In regards to the technical picture, prices are bullish on the daily charts. A solid breakout above $1660 could encourage an incline towards $1690 and $1700. Sustained weakness below $1660 could open the doors back towards $1620.
Oil more concerned with demand-side factors
All eyes will be on the OPEC meeting on Thursday which is expected to conclude with the cartel initiating deeper supply cuts. While such an outcome could create a temporary floor and even push oil prices higher, the upside will most likely be capped by demand side factors. For as long as the coronavirus outbreak remains a major market theme, fears around falling demand for fuel will leave oil prices depressed.
Focusing on the technical picture, WTI Crude is under pressure on the daily charts. Sustained weakness below 49.50 may open the doors back towards 47.00 and $46.50.
Disclaimer: The content in this article comprises personal opinions and should not be construed as containing personal and/or other investment advice and/or an offer of and/or solicitation for any transactions in financial instruments and/or a guarantee and/or prediction of future performance. ForexTime (FXTM), its affiliates, agents, directors, officers or employees do not guarantee the accuracy, validity, timeliness or completeness, of any information or data made available and assume no liability as to any loss arising from any investment based on the same.
Canada’s central bank followed the U.S. Federal Reserve and lowered its benchmark target for the overnight rate by 50 basis points to 1.25 percent, saying economic growth in the first quarter of 2020 will be weaker than expected and it “stands ready to adjust monetary policy further if required to support economic growth and keep inflation on target.”
Until today, the Bank of Canada (BOC) had bucked the global trend toward easier monetary policy by maintaining its rate since raising it in October 2018.
“While markets continue to function well, the Bank will continue to ensure that the Canadian financial system has sufficient liquidity,” BOC said, adding it was continuing to monitor economic and financial conditions in coordination with other Group of 7 central banks and authorities.
The rate cut was widely expected following the Fed’s unscheduled easing on March 3 and in January BOC had not only lowered its outlook for growth in the near term but also dropped language of rates being appropriate and said it was watching closely to see if the recent slowdown was more persistent than forecast.
“It is becoming clear that the first quarter of 2020 will be weaker than the bank had expected,” BOC said, adding business investment does not appear to be recovering as expected while economic activity is also being dampened by rail line blockades, teacher strikes and winter storms.
In January BOC estimated 0.3 percent growth in the fourth quarter of 2019, and said today data showed this was the actual rate, and 1.3 percent in the first quarter of 2020.
For the full year, BOC has forecast 1.6 percent growth, steady from 2019’s 1.6 percent, and 2.0 percent growth in 2021.
Canada’s inflation rate ticked up to 2.4 percent in January from 2.2 percent in the previous two months and while the output gap had widened in recent months, BOC said core measures were still around its target of 2.0 percent and the rise in January was due to temporary factors.
Canada’s dollar fell further in response to the rate cut to 1.34 to the U.S. dollar, down from 1.31 at the start of the year.
The Bank of Canada released the following statement:
“The Bank of Canada today lowered its target for the overnight rate by 50 basis points to 1 ¼ percent. The Bank Rate is correspondingly 1 ½ percent and the deposit rate is 1 percent.
While Canada’s economy has been operating close to potential with inflation on target, the COVID-19 virus is a material negative shock to the Canadian and global outlooks, and monetary and fiscal authorities are responding.
Before the outbreak, the global economy was showing signs of stabilizing, as the Bank had projected in its January Monetary Policy Report (MPR). However, COVID-19 represents a significant health threat to people in a growing number of countries. In consequence, business activity in some regions has fallen sharply and supply chains have been disrupted. This has pulled down commodity prices and the Canadian dollar has depreciated. Global markets are reacting to the spread of the virus by repricing risk across a broad set of assets, making financial conditions less accommodative. It is likely that as the virus spreads, business and consumer confidence will deteriorate, further depressing activity.
In Canada, GDP growth slowed to 0.3 percent during the fourth quarter of 2019, in line with the Bank’s forecast, although its composition was different. Consumption was stronger than expected, supported by healthy labour income growth. Residential investment continued to grow, albeit at a more moderate pace than earlier in the year. Meanwhile, both business investment and exports weakened.
It is becoming clear that the first quarter of 2020 will be weaker than the Bank had expected. The drop in Canada’s terms of trade, if sustained, will weigh on income growth. Meanwhile, business investment does not appear to be recovering as was expected following positive trade policy developments. In addition, rail line blockades, strikes by Ontario teachers, and winter storms in some regions are dampening economic activity in the first quarter.
CPI inflation in January was stronger than expected, due to temporary factors. Core measures of inflation all remain around 2 percent, consistent with an economy that has been operating close to potential.
In light of all these developments, the outlook is clearly weaker now than it was in January. As the situation evolves, Governing Council stands ready to adjust monetary policy further if required to support economic growth and keep inflation on target. While markets continue to function well, the Bank will continue to ensure that the Canadian financial system has sufficient liquidity.
The Bank continues to closely monitor economic and financial conditions, in coordination with other G7 central banks and fiscal authorities.”