Shares of GenMark Diagnostics traded higher after the firm reported FY/19 financial results and announced that it has increased global shipment of its test kits designed to detect the SARS-CoV-2 virus.
The company reported that for FY/19, total revenue increased 24% to $88.02 million, compared to $70.76 million in FY/18. During the same period, the firm highlighted that ePlex system revenue increased by more than 59% to $60.3 million. For FY/19, the firm posted a net loss of $0.82 per share, compared to a net loss of $0.91 per share FY/18.
The firm stated that for Q4/19, total revenue increased 40% to $27.2 million, compared with $19.4 million in Q4/18. The company indicated that ePlex revenue in Q4/19 increased 58% to $19.2 million, over the corresponding Q4/18 period. The company stated that for Q4/19 it recorded a net loss of $0.17 per share, versus a $0.21 loss per share in Q4/18.
GenMark noted that it placed 38 net new ePlex analyzers in Q4/19, which expanded its global installed base to 527 at year-end 2019 and that the average annuity per ePlex analyzer rose to $148,000 in 2019, up from $139,000 in 2018.
Scott Mendel, interim president and CEO commented, “2019 was a turning point for our company. From the FDA clearance and launch of our suite of blood culture identification panels to our significant improvement in gross margin, our team delivered meaningful results through teamwork and clearly defined goals…As revenue crosses over the $100 million mark in 2020, we are increasingly focused on driving towards cash flow positivity. We expect continued strong U.S. ePlex revenue growth, which is the vast majority of our business.”
The company provided some forward guidance and advised that it expects FY/20 revenue to be in the range of $100-110 million. FY/20 ePlex revenues are expected to increase by greater than 30% and are estimated to comprise 70-80% of FY/20 total revenue. Additionally, global ePlex placements are expected to range from 130-160 net new analyzers with an annuity per analyzer between $130,000 and $135,000.
In a separate news release, the company reported “initial shipments of ePlex Research Use Only (RUO) test kits designed to detect the SARS-CoV-2 virus. Initial RUO test kits were recently shipped to the company’s Hong Kong distributor, as well as several U.S. customers that have access to clinical samples. GenMark plans to use this information to support submission of an Emergency Use Authorization (EUA) to the U.S. Food and Drug Administration (FDA) for the ePlex SARS-CoV-2 test to address this developing global public health emergency.”
Interim CEO Mendel remarked, “In just one month, our team completed the design, manufacture and shipment of initial tests to customers for validation of our assay design using clinical samples. This is a strong demonstration of the GenMark teams’ scientific and operational expertise, the capability of our novel ePlex technology, and our ability to quickly adapt ePlex to meet a specific market need…COVID-19 is a global health emergency and we believe it is important to use our technology and resources to contribute in the fight against this disease.”
GenMark Diagnostics is headquartered in Carlsbad, Calif., and is a provider of multiplex molecular diagnostic solutions. The company states that “its proprietary eSensor® detection technology, GenMark’s eSensor XT-8® and ePlex® systems are designed to support a broad range of molecular diagnostic tests with compact, easy-to-use workstations and self-contained, disposable test cartridges.” The firm’s ePlex product is designed to address infectious disease testing needs in the areas of respiratory, bloodstream and gastrointestinal infections.
GenMark Diagnostics started the day with a market capitalization of around $203.9 million with approximately 58.08 million shares outstanding and a short interest of about 3.40%. GNMK shares opened higher today at $4.50 (+$0.99, +28.21%) over yesterday’s $3.51 closing price. The stock has traded today between $4.15 and $5.13 per share and is currently trading at $4.54 (+$1.03, +29.34%).
Disclosure: 1) Stephen Hytha compiled this article for Streetwise Reports LLC and provides services to Streetwise Reports as an independent contractor. He or members of his household own securities of the following companies mentioned in the article: None. He or members of his household are paid by the following companies mentioned in this article: None. 2) The following companies mentioned in this article are billboard sponsors of Streetwise Reports: None. Click here for important disclosures about sponsor fees. 3) Comments and opinions expressed are those of the specific experts and not of Streetwise Reports or its officers. The information provided above is for informational purposes only and is not a recommendation to buy or sell any security. 4) The article does not constitute investment advice. Each reader is encouraged to consult with his or her individual financial professional and any action a reader takes as a result of information presented here is his or her own responsibility. By opening this page, each reader accepts and agrees to Streetwise Reports’ terms of use and full legal disclaimer. This article is not a solicitation for investment. Streetwise Reports does not render general or specific investment advice and the information on Streetwise Reports should not be considered a recommendation to buy or sell any security. Streetwise Reports does not endorse or recommend the business, products, services or securities of any company mentioned on Streetwise Reports. 5) From time to time, Streetwise Reports LLC and its directors, officers, employees or members of their families, as well as persons interviewed for articles and interviews on the site, may have a long or short position in securities mentioned. Directors, officers, employees or members of their immediate families are prohibited from making purchases and/or sales of those securities in the open market or otherwise from the time of the interview or the decision to write an article until three business days after the publication of the interview or article. The foregoing prohibition does not apply to articles that in substance only restate previously published company releases. 6) This article does not constitute medical advice. Officers, employees and contributors to Streetwise Reports are not licensed medical professionals. Readers should always contact their healthcare professionals for medical advice.
When investors become increasingly concerned about the financial system, they rush into physical precious metals. And, this is precisely what we see taking place at the U.S. Mint as sales of Silver Eagles surged in the first three days of March versus the entire month of February. The U.S. Mint hasn’t seen this type of buying for several years.
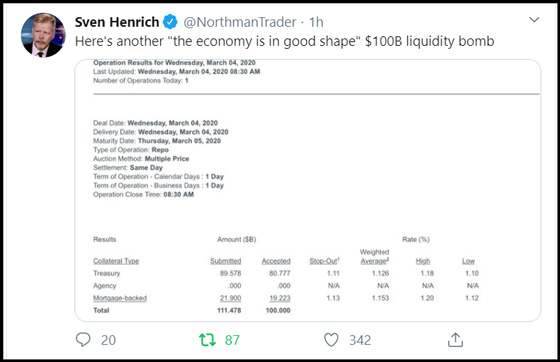
For the past three years, annual Silver Eagle sales fell below 20 million, reaching a low in 2019. However, that may all change this year as the global contagion spreads, motivating investors to shed paper assets and move into physical precious metals. For sure, investors should be worried when the Fed starts to do “LIQUIDITY BOMBS” via its Repo Operations as stated by Sven Heinrich, the Northman Trader:
While the Primary Dealers submitted requests for $111.478 billion this morning, the Fed accepted $100 billion. Add that to the single-day Repo of another $100 billion yesterday, which I wrote about in my article; FED REPO INJECTIONS HIT RECORD LEVEL: Global Contagion Negatively Impacting Financial Markets. The Fed Repo Operations yesterday purchased $100 billion (overnight) and a $20 billion (two-week period) for a total of $120 billion.
On top of the record Fed Repo Operations, then there was the “EMERGENCY” 50 basis point rate cut yesterday that should have pushed the markets up considerably. However, the Dow Jones Index fell nearly 800 points by the end of trading… a very bad sign indeed. While the Dow has recovered this morning, I believe this is only a temporary situation as the global contagion continues to spread negatively impacting the world’s supply chain. Let’s face it; the worst is yet to come.
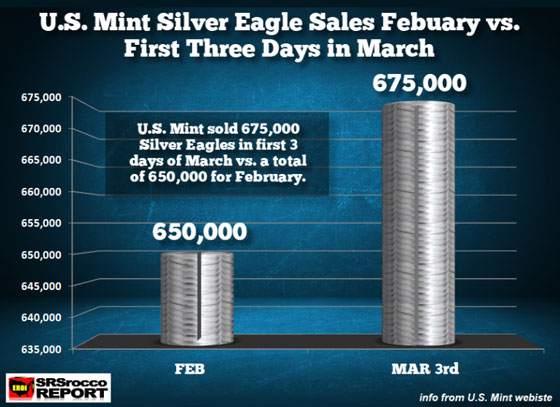
With precious metals sales surging over the past few weeks due to the risk of the global contagion, the U.S. Mint website reported that 675,000 Silver Eagles were sold in just the first three days of March. Now, compare that to the total 650,000 sold during the entire month of February:
Again, it has been quite a while since the U.S. Mint has experienced this type of buying. It will be interesting to see if this trend continues throughout the rest of the month. Please check back at the SRSrocco Report website as I will be publishing updates, depending on the frequency of the U.S. Mint website sales reports.
Total U.S. Mint Silver Eagle sales for 2020 are currently 5,171,000, with 3,846,000 just for January. Each year, the primary dealers purchase a lot of Silver Eagles in January to meet the increased demand for the new yearly product. Last year, Silver Eagle sales in January were 4,017,500.
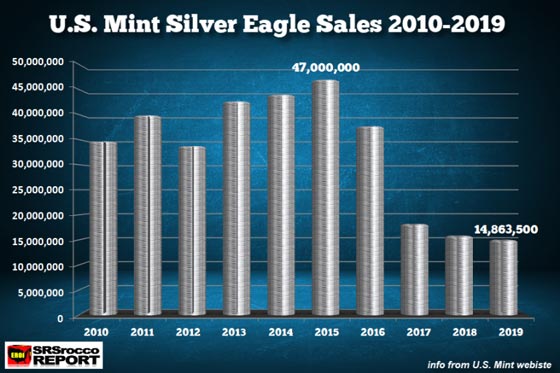
Here are the annual Silver Eagle sales from 2010-2019:
As we can see, the U.S. Mint Silver Eagle sales peaked at 47 million in 2015 and fell to a low of 14.86 million in 2019. However, as I stated, this all can change in 2020 as this global contagion spreads, forcing investors to move into physical precious metals to protect wealth.
IMPORTANT FACTORS to consider about U.S. Mint Silver Eagle Sales in 2020:
The U.S. Mint is not set up to do large monthly mint runs of Silver Eagles like it was before 2016. Thus, there is likely less staff, and it will take a while to ramp up production.
If the global contagion continues to spread in the U.S., then acquiring silver rounds to make Silver Eagles may become increasingly difficult.
What happens if the U.S. Government decides to shut down some “Non-critical” facilities to protect against the spread of the virus? This could impact the production of Silver Eagles.
I believe precious metals investors should be aware that it may be challenging to get available supplies of physical gold and silver bullion in the future… only at much higher prices.
The Money Metals News Service provides market news and crisp commentary for investors following the precious metals markets.
With a key acquisition underway, SMG Industries’ revenues are set to jump exponentially.
Oil prices may be in a holding pattern lately, but that’s helped set the stage for a huge opportunity in one particular area. That subsector is the midstream and oilfield services.
These are the guys who sell and service the “picks and shovels” of the pipeline, drilling and fracking industries.
“It is clear that the upside for this stock is very considerable from here.” – Clive Maund
Right now, one player in this field is using a unique strategy to both grow and diversify its business.
In fact, that approach is so transformational, its revenues are set to jump exponentially.
Keith Kohl, editor of the Pure Energy Trader investment newsletter, told his subscriber base to buy this company’s shares, explaining, “ there’s a huge opportunity in consolidating small, profitable companies, specifically in areas like the Permian Basin.”
Technical analyst Clive Maund wrote on March 3, “it is clear that the upside for this stock is very considerable from here.”
And that makes now an exceptionally ripe moment for early investors to claim their stake.
Buy and Build: A Unique Path to Growth
Headquartered in Houston, Texas, SMG Industries Inc. (SMGI:OTCQB) is a midstream and oilfield services company operating in the Southwest United States. That’s ideal, since nearly half of North American rigs are currently in Texas due to favorable economics in its resource basins, like the Permian.
But SMG is not your garden variety midstream and oilfield services company. Instead, it is on a rapid growth path, thanks to its unique “buy and build” strategy. That means it targets middle and lower-middle market owner-operated companies that service the drilling, completions and production markets.
Many of these are well run and boast great reputations, but their growth remains stalled. Often that’s because their owner-operators get bogged down by the daily administration side of the business.
Enter SMG.
Management identifies quality acquisition targets that are ideal candidates for consolidation, where SMG finds synergies by removing what they call “business constraints.” This usually means allowing existing management to stay on and focus on more efficient operations and sales, while SMG helps provide working capital and equipment, and boosts sales through cross-selling customer bases.
Latest Acquisition: A Transformational Event
In the last three years SMG management has successfully executed its “buy and build” strategy a number of times. But its most recent move promises to be massively transformational for the company.
SMG has just announced the acquisition of 100% of the membership interests of 5J Oilfield Services LLC and 5J Trucking LLC (together “5J”), its largest transaction to date. 5J is an industry recognized player, with $55 million in annual revenues. What’s more, acquiring 5J helps SMG diversify into midstream and logistics with compressor, heavy haul, and drilling rig move services.
That’s significant, because while fracking activity is consolidating, midstream spending continues aggressively ramp up.
Studies by the INGAA Foundation, which represents the natural gas pipeline industry, support that view. Their research concludes that a whopping $44 billion needs to be spent in North America every year until 2035 on new energy infrastructure.
That’s hundreds of billions in spending over the next 15 years. And roughly half of 5J’s $55 million in annual revenues are focused in the pipeline/Midstream market segment.
Funding for SMG’s 5J buyout looks like this: a line of credit (LOC) lender with a $10 million LOC with approximately $6 million drawn at close, an equipment lender $12 million term loan, a $1.6 million mezzanine note and $6 million in a Series B Convertible preferred stock that has a fixed exercise price of $1.25 per share.
But taking over 5J means an eight-times instant growth in revenue. That will push the post-acquisition SMG from its current $8 million in revenue to a whopping $63 million.
And the beauty of the acquisition is that it’s immediately accretive to consolidated earnings. SMG’s customers will have instant access to 5J’s fleet of assets and services, while 5J’s sales force will be able to immediately promote SMG products.
5J’s Locations
Where the New SMG Is Headed
Post transaction, the new SMG will reduce its overall exposure to drilling, completion and production segments, while growing its midstream segment. These midstream pipeline customers, such as Kinder Morgan (KMI), Enterprise Products (EPD), Energy Transfer (ET), Mark West and others, have increasing capital expenditure budgets this year mostly in the southwest U.S., including Texas. Multi year projects represent increasing spend for 5J and SMGI to perform service work and grow with them.
5J is a logistics and transportation business that uses 120+ trucks, 250+ heavy haul trailers/equipment and 20 cranes to move large compressors utilized in pipelines. Customers pay 5J to move these giant compressors hundreds of miles to build out pipeline infrastructure at terminals and stations.
The other half of 5J’ss revenues are in ‘Rig Move,’ moving drilling rigs for oil companies and their drilling contractors such as Nabors (NBR), Patterson (PTEN) and Helmerich & Payne (HP). This drilling market segment correlates to oilfield activity and the domestic onshore drilling rig count.
Interestingly, oil companies are actively trading rigs outmeaning an Oxy, Concho or Chevron may replace its Nabors contract and hire Patterson in order to get a better rateall of this transition produces heavy logistics movement for the new SMG as drilling rigs transition from one customer to another.
SMG’s rig moves take place in Texas, average 10 miles, and cost $130,000. This equates to $4 million of monthly revenues, and is likely to jump 50% to $6 million monthly during fiscal 2020 through an increased focus on midstream following positive customer spend.
The new SMG will also benefit from a high degree of geographic operational overlap, with strategically located operations in five facilities, capitalizing on each main exploration and production producing region in the Southwestern U.S.
Matt Flemming, CEO of SMG Industries, stated, “SMG views this acquisition as immediately accretive and strategic to its business. Many midstream pipeline customers are increasing their spend and capex this year and represent a major growth area for 5J and SMGI. This acquisition will provide additional access into the midstream sector and bring about 100 new MSAs or customer agreements for cross-selling. SMGI’s buy and build strategy includes current plans for additional midstream and other strategic acquisitions in 2020.”
Recent Past is Prologue
One of SMG’s initial acquisitions was MG Cleaners, in July 2017. MG provides contract drilling companies and oil and gas operators with proprietary branded products including detergents, surfactants and degreasers (such as Miracle Blue®) as well as equipment and services crews that perform on-site repairs, maintenance and drilling rig wash services.
In the year following acquisition, MG Cleaners saw its revenues up 100%.
Then, in December 2018 SMG made its move on Momentum Water Transfer Services. Momentum is an oilfield water source and transfer service company that operates throughout Texas. Momentum designs, installs and operates custom water transfer jobs. It provides no-leak lay flat hose, high volume pumps, manifolds, road crossings, connectors and experienced crews that safely manage the process of transferring water for hydraulic fracturing.
SMG’s next target was Trinity Services, which performs drilling pad development, and pits and lease access roads through its heavy equipment like excavators, tractors, compactors and motor graders. In its production market segment, Trinity does work-over and swab well site services.
When SMG acquired Trinity it was a big move, as Trinity’s revenues were about the equivalent of SMG’s then market cap. That roughly doubled SMG’s revenues at the time.
A Major Transformation for SMG and Shareholders
Here’s what investors need to keep top-of-mind.
SMGI shares are closely held, and have a relatively small trading float. So keep in mind that daily trading volumes are low. But don’t let that deter you.
SMG’s latest acquisition of 5J is literally a multiple of its former self, a testament to management’s ability to do not just big, but transformational deals. It could even become the catalyst to have company shares uplisted to either the Nasdaq or NYSE.
Peering into the future, SMG has already identified other midstream acquisition targets to continue to follow customer growth, and benefit from capex spending in this sector.
Management is keen on moving forward with its “buy and build” strategy.
Given how well it has served them so far, odds are excellent that approach will help make SMG an increasingly dominant player in the midstream and oilfield services sector in the Southwest United States.
In my view, wise investors should stake their claim in SMGI at this juncture, with shares likely to trade at a multiple of the recent price. That way they can be successful at “buy and build” for their own investment portfolios.
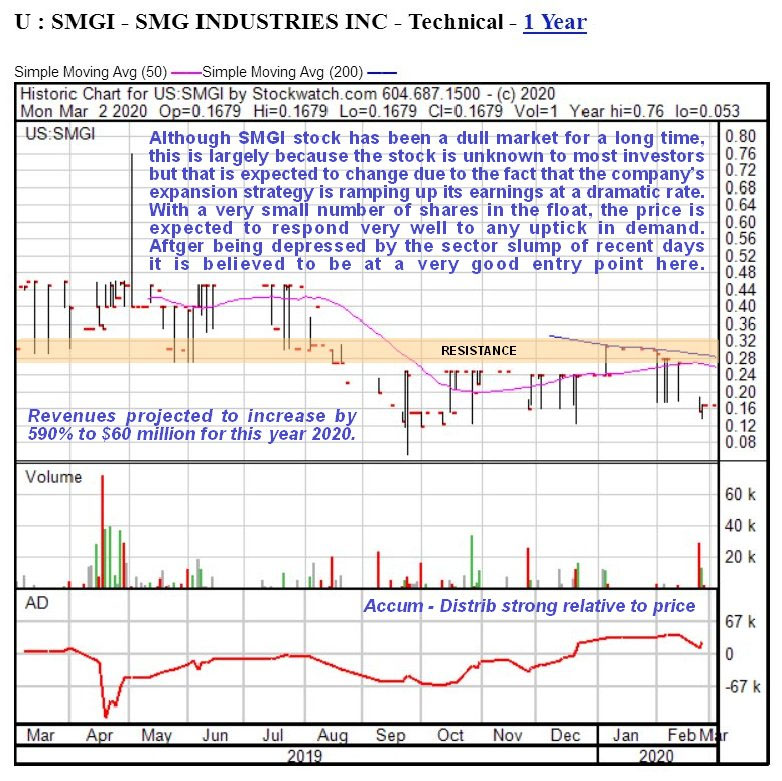
Technical analyst Clive Maund had this to say about the SMGI shares on March 3: “right now it is a very good price having been beaten down over the past week or so by the market crashlet and the drop in the oil price, and yesterday’s reversal candle in oil that we just looked at means that it should now have some tailwind from a rising oil price as well. With this kind of growth in revenue we cannot expect it to remain off the radar of almost all investors for much longer. SMG Industries is therefore rated an immediate buy here.” Maund’s chart follows:
Peter Krauth is a former portfolio adviser and a 20-year veteran of the resource market, with special expertise in energy, metals and mining stocks. He has been editor of a widely circulated resource newsletter, and contributed numerous articles to Kitco.com, BNN Bloomberg and the Financial Post. Krauth holds a Master of Business Administration from McGill University and is headquartered in resource-rich Canada.
Disclosure: 1) Peter Krauth: I, or members of my immediate household or family, own shares of the following companies mentioned in this article: None. I personally am, or members of my immediate household or family are, paid by the following companies mentioned in this article: SMG Industries. My company has a financial relationship with the following companies mentioned in this article: None. I determined which companies would be included in this article based on my research and understanding of the sector. 2) The following companies mentioned in this article are billboard sponsors of Streetwise Reports: None. Click here for important disclosures about sponsor fees. As of the date of this article, an affiliate of Streetwise Reports has a consulting relationship with SMG Industries. Please click here for more information. Within the last six months, an affiliate of Streetwise Reports has disseminated information about the private placement of the following companies mentioned in this article: SMG Industries. An affiliate of Streetwise Reports is conducting a digital media marketing campaign for this article on behalf of SMG Industries. Please click here for more information. The information provided above is for informational purposes only and is not a recommendation to buy or sell any security. 3) Statements and opinions expressed are the opinions of the author and not of Streetwise Reports or its officers. The author is wholly responsible for the validity of the statements. The author was not paid by Streetwise Reports for this article. Streetwise Reports was not paid by the author to publish or syndicate this article. Streetwise Reports requires contributing authors to disclose any shareholdings in, or economic relationships with, companies that they write about. Streetwise Reports relies upon the authors to accurately provide this information and Streetwise Reports has no means of verifying its accuracy. 4) This article does not constitute investment advice. Each reader is encouraged to consult with his or her individual financial professional and any action a reader takes as a result of information presented here is his or her own responsibility. By opening this page, each reader accepts and agrees to Streetwise Reports’ terms of use and full legal disclaimer. This article is not a solicitation for investment. Streetwise Reports does not render general or specific investment advice and the information on Streetwise Reports should not be considered a recommendation to buy or sell any security. Streetwise Reports does not endorse or recommend the business, products, services or securities of any company mentioned on Streetwise Reports. 5) From time to time, Streetwise Reports and its directors, officers, employees or members of their families, as well as persons interviewed for articles and interviews on the site, may have a long or short position in securities mentioned. Directors, officers, employees or members of their immediate families are prohibited from making purchases and/or sales of those securities in the open market or otherwise from the time of the interview or the decision to write an article until three business days after the publication of the interview or article. The foregoing prohibition does not apply to articles that in substance only restate previously published company releases. As of the date of this article, officers and/or employees of Streetwise Reports LLC (including members of their household) own securities of SMG Industries, a company mentioned in this article.
Additional disclosures Clive Maund does not own shares of SMG Industries and neither he nor his company has a financial relationship with the company.
Pure Energy Trader disclosures No statement or expression of opinion, or any other matter herein, directly or indirectly, is an offer or the solicitation of an offer to buy or sell the securities or financial instruments mentioned. Neither the publisher nor the editors are registered investment advisors; nor have either publisher or editors been compensated for this publication, or ongoing coverage. The publisher and/or the editors may or may not have a position in the securities mentioned.
The run-up to the OPEC meeting on Thursday was rather anti-climatic with Oil barely moving despite the cartel proposing deeper production cuts to offset the massive demand hit from the coronavirus outbreak.
OPEC ministers agreed that Oil production should be cut by 1.5 million barrels a day (mbpd) with OPEC members cutting 1.0 mbpd and non-OPEC allies led by Russia cutting 0.5 mbpd. However, Russia has yet to make a decision which could make things very interesting on Friday when crunch talks with non-OPEC members kick-off.
Even if the cartel cuts production by 1.5 mbpd, this is unlikely to support Oil prices in the medium to longer term. For as long as coronavirus concerns fuel fears around falling demand for fuel, the path of least resistance for Oil points south.
Another theme throwing a proverbial wrench in the works for OPEC is US Shale. Oil production in the United States has reached a record high of 13.1 mbpd as of last week which is nearly half of the 27.8 mbpd produced by OPEC members last month.
To cut a long story short, the combination of stuttering demand and rising production will be spell more trouble for Oil which has weakened over 20% since the start of 2020!
Looking at the technical picture, Oil prices remain under pressure on the daily charts. The technical and fundamentals align in favour of bears with resistance around $49.50. There could be a fake bounce towards $49.50 and possibly even $50 but a move higher will most likely be capped by fundamentals.
A breakdown below $46.50 should open the doors back towards $44.00 and possibly lower.
Gold eyes $1660 ahead of US jobs report
Gold bulls were injected with fresh inspiration this week after the Federal Reserve shocked markets with an emergency interest rate cut.
Growing speculation over the Fed and other global central banks easing policy should push Gold higher due to its zero-yielding nature. The metal is positioned to push higher ahead of the US jobs report on Friday. With the Dollar set to weaken on Fed rate cut bets, prices could re-test $1700 after $1660 is breached.
Disclaimer: The content in this article comprises personal opinions and should not be construed as containing personal and/or other investment advice and/or an offer of and/or solicitation for any transactions in financial instruments and/or a guarantee and/or prediction of future performance. ForexTime (FXTM), its affiliates, agents, directors, officers or employees do not guarantee the accuracy, validity, timeliness or completeness, of any information or data made available and assume no liability as to any loss arising from any investment based on the same.
Recent US economic data were mixed: durable goods orders declined over month in January as did the Institute for Supply Management’s (ISM) manufacturing index in February, while pending home sales rose over year in January as did personal income over month. Durable goods orders declined 0.2% over month, but the reading without volatile transportation component rose to 0.8% from 0.1% growth. The ISM PMI declined to 50.1 from 50.9. At the same time construction spending rose in January to 1.8% from 0.2% in December. The decline in goods trade deficit in January was another positive development: the deficit narrowed to $-65.5 billion from $68.67 billion in December. Personal income rose 0.6% on month from 0.1% , and pending home sales rose 5.7% over month from 4.1% in December. The slowing of manufacturing sector expansion was due to supply bottlenecks linked to the coronavirus infection. The spread of infection caused disruption in factory operation in China, which resulted in supply shortages for companies all over the world. This caused the selloff in stock markets all over the world. However, the Federal Reserve surprised investors with a half percentage-point cut in interest rates. Fed’s extraordinary surprise rate cut since 2008 followed a pledge on Tuesday by Group of Seven finance ministers and central bank governors to support their economies by appropriate actions. It came two weeks ahead of Fed’s scheduled policy meeting, where traders had fully priced in a half percentage-point cut. Easier monetary policy is bullish for stock market. At the same time, development of worse scenarios of coronovirus global infection outbreak is a downside risk for stock markets.
A fresh era of negative interest rates is looming and investors are now seeking to top-up their portfolios with equities, says the CEO of one of the world’s largest independent financial advisory organisations.
Nigel Green, the deVere Group chief executive and founder, is speaking out after the U.S. Federal Reserve’s emergency rate cut on Tuesday – the first since the 2008 financial crash – as it tries to limit the economic impact of the coronavirus outbreak.
Mr Green affirms: “There’s been one historic cut already and there are signals that the Fed – the world’s de facto central bank – will make deeper cuts imminently.
“As it scrambles to protect the U.S. economy from the far-reaching fallout of the coronavirus, it can be expected that it could take rates back down to zero – emergency territory – in the next few months.
“This then raises the spectre that the Fed will ultimately follow its peers in Europe and Japan by adopting negative interest rates.”
He continues: “There is much debate and scepticism regarding the effectiveness of slashing rates in response to a global public health crisis and the resulting market turmoil.
“Negative rates can be misinterpreted by the public. They have been viewed as a warning to consumers and investors, that the underlying economies are in a dangerously weak position, and hit investor and consumer demand.”
Mr Green continues: “However, while the jury is out on whether negative interest rates help the real economy, there is no doubt that they help boost financial asset prices.
“As such, with coronavirus possibly ushering in a fresh era of negative interest rates, investors are now seeking to top-up their portfolios with equities before the next round of cuts and the likely subsequent price jump. They are seeking the lower entry points before the market surge.
“Those with savings in the bank are already getting battered by the ultra-low interest rates they are getting,
“Negative rates will give more investors more reason to increase their exposure to equities.”
The deVere CEO concludes: “There question mark remains on whether cutting rates from their already low levels will solve the issues created by the coronavirus outbreak.
“But rate cuts – and it is likely there will be deeper ones to come – will push up financial asset prices and right now many investors are looking to get ahead of the curve on this.”
About:
deVere Group is one of the world’s largest independent advisors of specialist global financial solutions to international, local mass affluent, and high-net-worth clients. It has a network of more than 70 offices across the world, over 80,000 clients and $12bn under advisement.
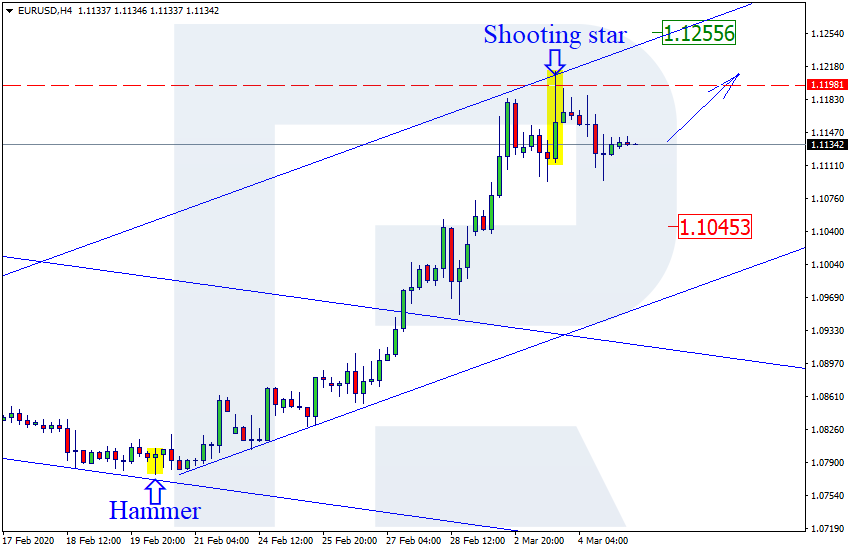
As we can see in the H4 chart, the pair continues growing. By now, EURUSD has completed several reversal candlestick patterns, such as Shooting Star, close to the resistance level. Right now, the pair is reversing. We may assume that later the price may complete the correction and move to reach 1.1125. However, one shouldn’t exclude a possibility that the price may form a more significant pullback towards 1.1045.
USDJPY, “US Dollar vs. Japanese Yen”
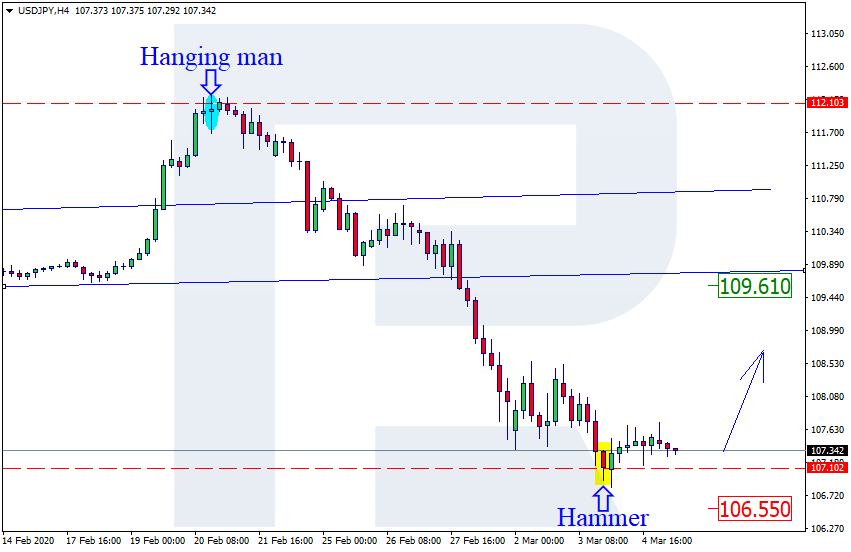
As we can see in the H4 chart, USDJPY is no longer moving inside the rising channel. By now, the pair is testing the support level, where it has formed several reversal patterns, including Hammer. The current situation implies that the price may reverse and then grow to reach 109.61. At the same time, the pair may choose another scenario, according to which the instrument is expected to continue falling towards 106.55 after a slight correction.
EURGBP, “Euro vs. Great Britain Pound”
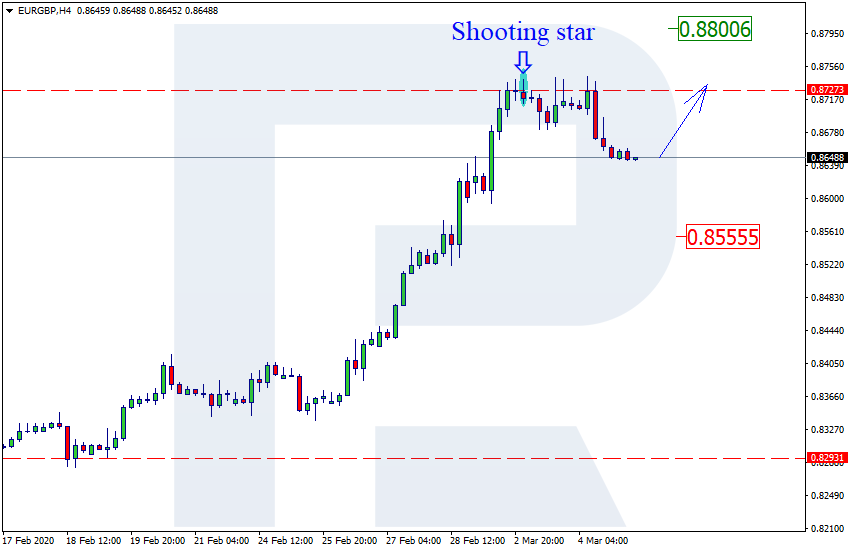
As we can see in the H4 chart, after testing the resistance level and forming several reversal patterns, such as Shooting Star, EURGBP has almost reversed. Right now, we may assume that after reversing the price may continue growing towards 0.8800. However, one shouldn’t exclude an opposite scenario, which implies that the instrument may fall with the target at 0.8555.
Attention! Forecasts presented in this section only reflect the author’s private opinion and should not be considered as guidance for trading. RoboForex LP bears no responsibility for trading results based on trading recommendations described in these analytical reviews.
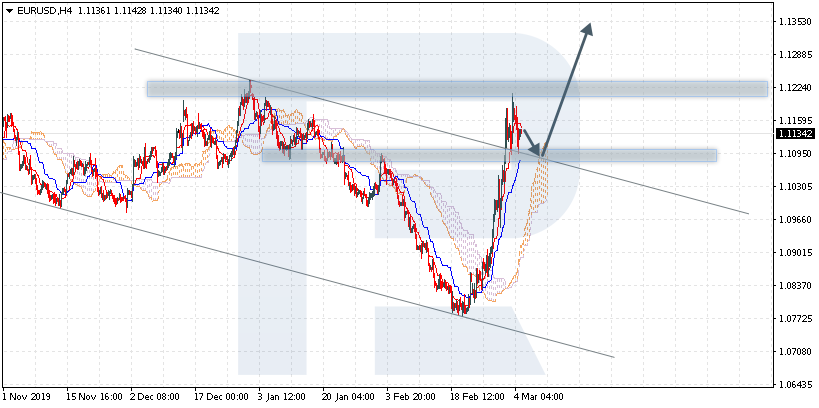
EURUSD is trading at 1.1134; the instrument is moving above Ichimoku Cloud, thus indicating an ascending tendency. The markets could indicate that the price may test the cloud’s upside border at 1.1095 and then resume moving upwards to reach 1.1350. Another signal to confirm further ascending movement is the price’s rebounding from the descending channel’s upside border. However, the scenario that implies further growth may be canceled if the price breaks the cloud’s downside border and fixes below 1.0965. In this case, the pair may continue falling towards 1.0845.
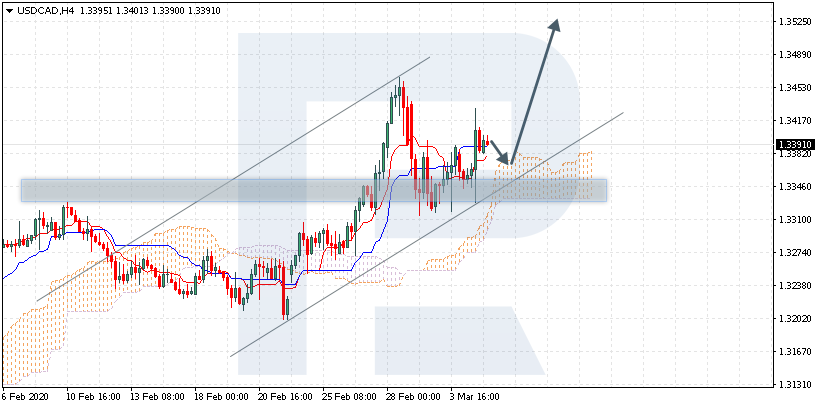
USDCAD, “US Dollar vs Canadian Dollar”
USDCAD is trading at 1.3391; the instrument is moving above Ichimoku Cloud, thus indicating an ascending tendency. The markets could indicate that the price may test the cloud’s upside border at 1.3370 and then resume moving upwards to reach 1.3525. Another signal to confirm further ascending movement is the price’s rebounding from the rising channel’s downside border. However, the scenario that implies further growth may be canceled if the price breaks the cloud’s downside border and fixes below 1.3305. In this case, the pair may continue falling towards 1.3185.
USDRUB, “US Dollar vs Russian Ruble”
USDRUB is trading at 65.93; the instrument is moving above Ichimoku Cloud, thus indicating an ascending tendency. The markets could indicate that the price may test the cloud’s upside border at 65.40 and then resume moving upwards to reach 68.85. Another signal to confirm further ascending movement is the price’s rebounding from the descending channel’s upside border. However, the scenario that implies further growth may be canceled if the price breaks the cloud’s downside border and fixes below 64.05. In this case, the pair may continue falling towards 62.75.
Attention! Forecasts presented in this section only reflect the author’s private opinion and should not be considered as guidance for trading. RoboForex LP bears no responsibility for trading results based on trading recommendations described in these analytical reviews.
Smaller than expected decline in Australia’s trade surplus bullish for AUDUSD
Australia’s trade surplus declined to 5.21 billion Australian dollars from 5.38 billion in December, when a decline to 4.8 billion was forecast. This is bullish for AUDUSD. The decline in trade surplus was due to falls both in imports and exports.
The EUR/USD currency pair has stabilized after a long rally. At the moment the trading instrument is consolidating. EUR/USD quotes are testing key support and resistance levels at 1.11100 and 1.11850, respectively. Investors continue to assess the risks of COVID-19 virus spreading. The U.S. House of Representatives plans to allocate $8.3 bln to fight the epidemic. The greenback is under pressure from the prospects of further easing the Fed’s monetary policy. Futures indicate a 50% probability that the Central Bank will cut interest rates by another 50 basis points by July. We recommend opening positions from key levels.
The Economic News Feed for 05.03.2020:
– Initial Jobless Claims (US) – 15:30 (GMT+2:00);
– Volume of Industrial Orders (US) – 17:00 (GMT+2:00);
Indicators do not give accurate signals: the price has fixed between 50 MA and 100 MA.
MACD histogram is near the 0 mark.
The Stochastic Oscillator is located in the neutral zone, the %K line is below the %D line, which indicates a correction of the EUR/USD currency pair.
Trading recommendations
Support levels: 1.11100, 1.10500, 1.10000
Resistance levels: 1.11850, 1.12200, 1.12500
If the price fixes above 1.11850, expect further growth toward 1.12200-1.12500.
Alternatively, the quotes could decline toward 1.10600-1.10400.
The GBP/USD currency pair
Technical indicators of the currency pair:
Prev Open: 1.28117
Open: 1.28697
% chg. over the last day: +0.46
Day’s range: 1.28607 – 1.28892
52 wk range: 1.1959 – 1.3516
GBP/USD quotes have moved up. The pound has updated the local highs. At the moment GBP/USD currency pair is consolidating near the round level of 1.29000. 1.28400 is already a mirror support. The demand for the US dollar remains at a rather low level. GBP has a potential for further growth against greenback. We recommend opening positions from key levels.
The Economic News Feed for 05.03.2020 is calm.
The indicators signal the strength of buyers: the price has fixed above 50 MA and 100 MA.
MACD histogram is in the positive zone, which indicates a bullish sentiment.
The stochastic oscillator is in the neutral zone, the %K line crosses the %D line. No signals at the moment.
Trading recommendations
Support levels: 1.28400, 1.27850, 1.27400
Resistance levels: 1.29000, 1.29450
If the price fixes above the round level of 1.29000, expect the quotes to grow toward 1.29400-1.29600.
Alternatively, the quotes could descend toward 1.27900-1.27700.
The USD/CAD currency pair
Technical indicators of the currency pair:
Prev Open: 1.33829
Open: 1.33864
% chg. over the last day: +0.02
Day’s range: 1.33846 – 1.34021
52 wk range: 1.2949 – 1.3566
Yesterday, the USD/CAD currency pair showed high trading activity. The Bank of Canada reduced the key interest rate by 50 basis points to 1.25%. This decision was taken by the Board of Governors of the Central Bank in connection with the coronavirus COVID-19 outbreak, which had a significant negative impact on the growth prospects of both the Canadian and global economy. Currently, the CAD is consolidating in the range of 1.33800-1.34300. We recommend paying attention to the dynamics of oil quotations and opening positions from key levels.
The Economic News Feed for 05.03.2020 is calm.
Indicators do not give an accurate signal: 50 MA crossed 100 MA.
The MACD histogram is in the positive zone, but below the signal line, which gives a weak signal to buy USD/CAD.
The Stochastic Oscillator is in the neutral zone, the %K line is below the %D line, which indicates a bearish sentiment.
Trading recommendations
Support levels: 1.33800, 1.33200, 1.32650
Resistance levels: 1.34300, 1.34600
If the price fixes above 1.34300, expect the quotes to rise toward 1.34600-1.35000.
Alternatively, the quotes could descend toward 1.33300-1.33000.
The USD/JPY currency pair
Technical indicators of the currency pair:
Prev Open: 107.120
Open: 107.529
% chg. over the last day: +0.54
Day’s range: 107.190 – 107.740
52 wk range: 104.45 – 113.53
The USD/JPY has stabilized after a long slump. At the moment the quotes are consolidating. The trading instrument tests the following support and resistance levels 107.000 and 107.800, respectively. Demand for safe haven currencies remains at a high level. However, technical correction of USD/JPY currency pair is not excluded in the nearest future. We recommend paying attention to the dynamics of US government bonds yield and opening from key levels.
The Economic News Feed for 05.03.2020 is calm.
Indicators do not give accurate signals: the price is consolidating near 50 MA.
MACD histogram is near the 0 mark.
The Stochastic Oscillator is located in the neutral zone, the %K line is above the %D line, which indicates a correction of the USD/JPY currency pair.
Trading recommendations
Support levels: 107.000
Resistance levels: 107.800, 108.550, 109.300
If the price fixes below the round level of 107.000, expect the quotes to fall toward 106.600-106.300.
Alternatively, the quotes could correct toward 108.500-109.000.