On Monday, March 9, trading on the euro ended with an increase of 1.35% (+152 points). This was the worst day for the stock market. Trading on the New York Stock Exchange was suspended during the session after the indices fell by 7.0%. This was the first suspension in trading on the stock exchange since 2008. After trading was resumed, the indices corrected slightly.
The main reason for the strengthening of the euro and the fall of stock indices was the collapse of the oil market. The price of Brent fell 31% to $31 USD. Russia refused to agree to the OPEC deal, and Saudi Arabia promised to increase its production to 12 million barrels and reduced the price of its oil for buyers.
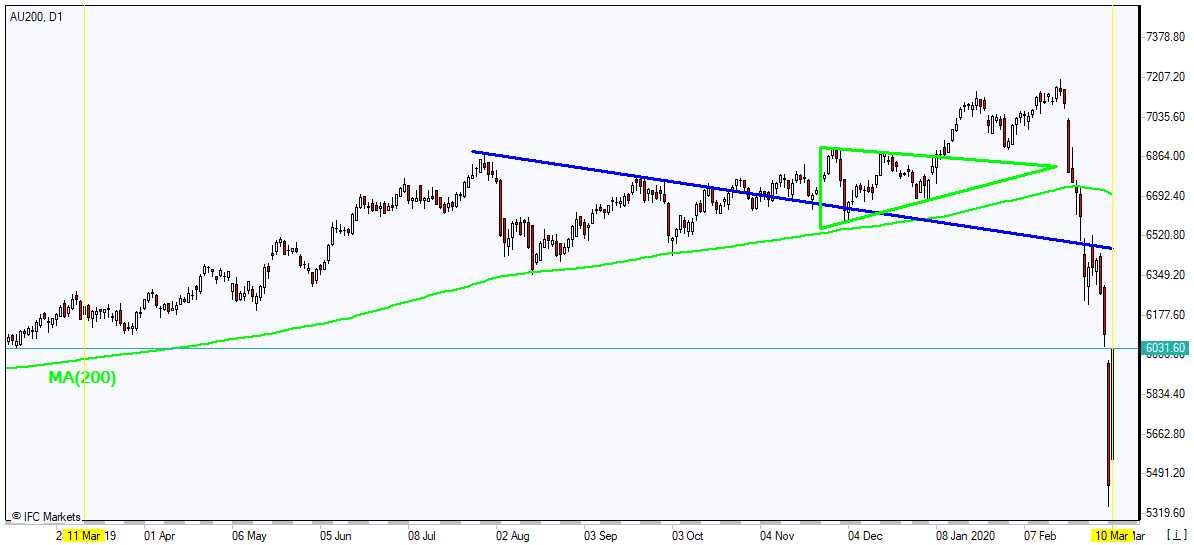
The fall in oil prices negatively affected commodity currencies. AUSUSD fell to 0.6314 (winning back all losses in the process), the lowest since 2009. USDCAD rose to 1.3759, the highest since 2018.
Due to the collapse in oil prices, no one is currently discussing macroeconomic indicators. Everyone forgot about the release of Friday’s payroll data. The price per barrel of Brent crude oil corrected by $5 UDS from a minimum of $31.25 USD.
In Asia, the EURUSD pair completely blocked yesterday’s growth. The correction was at the 135th degree, and the price rolled back to the balance line. Technically, the pair can expect growth. Given that futures on the SP500 recovered by 3.5%, then against the backdrop of positive dynamics of stock indices and oil, the downwards correction may gather pace.
According to the forecast, a breakdown of the lower line of the channel and a decrease down to the 180th degree were considered – 1.1281. It is more logical to rely on a price reversal model, which is similar to the models observed with cryptocurrencies.
We expect growth to 1.1395-1.14. If it is sharp, then above 67th degree. Then the realization of the decline will be in question. Here we will have to wait a day to understand what position the market will form and what market players expect. There are a lot of long positions open, so bears are looking for a moment to advance in order to tear off the stops over the longs and use them as fuel to lower the price down to the 1.12 area. But, buying after yesterday’s rally is risky business.
By Jameel Ahmad, Global Head of Currency Strategy and Market Research at FXTM, ForexTime
Monday 9 March 2020 will forever be remembered as a dark day for global financial markets and only investors with an extreme high appetite towards taking on risk will have the stomach to price in a recovery after financial markets suffered its deepest declines since the global financial crisis. Even following such dramatic drops, the selling isn’t over. This is clearly an enormously fragile environment for investors and just like you wouldn’t catch a falling knife, there isn’t reason to try and catch these markets either.
While the poker game between Saudi Arabia and Russia over Oil output will bear the blame for encouraging such a disaster in world markets, the performance of global assets over the previous fortnight have been showing signs of a sinking ship. The breakdown in the OPEC+ alliance with thanks to Russia, which was later retaliated by Saudi Arabia can be likened to ensuring the ship drowned faster and pushing everything else with it overboard.
If one were to look for a silver lining from an Oil price crash that took as much as 30% from its valuation within moments of the market open for the week is that it should have helped the commodity to find its bottom.
What this market really needs is a hero to save the day. And this hero isn’t global central banks coming to the rescue or authorities announcing more measures to contain the virus, but announcements from health authorities that a cure has been found to the virus or at least that the outbreak has peaked. Sadly the rising cases day by day rules the latter out of the equation. The villain to this story is the virus and the villain is only getting stronger, meaning the signposts remain unclear with dire clouds for investors to find their way back into stock markets.
The announcement late Monday evening from Italian Prime Minister Giuseppe Conte that strict measures will be extended to the whole country should also force the question to investors whether there is any justification in the EURUSD recent jump from 3-year lows at 1.07 to above 1.14. Should other nations in the European Union unfortunately suffer the same fate that Italy is currently dealing with, the Euro is looking at its most serious risk since the European Debt Crisis of 2012.
At this point, everyone would love the help of a crystal ball to help see what is next for financial markets. But in the form of the virus outbreak, we are looking at a world health disaster that still has the potential to spread further, before it gets any better.
I still hold hope that a global recession can be avoided but the previous week or so that has seen the virus reaching Europe and the United States, with infection cases still rising would overall increase the probability of a world recession.
Disclaimer: The content in this article comprises personal opinions and should not be construed as containing personal and/or other investment advice and/or an offer of and/or solicitation for any transactions in financial instruments and/or a guarantee and/or prediction of future performance. ForexTime (FXTM), its affiliates, agents, directors, officers or employees do not guarantee the accuracy, validity, timeliness or completeness, of any information or data made available and assume no liability as to any loss arising from any investment based on the same.
Monday’s panic selling has climbed down several notches, after market sentiment has been left raw by the massive sell-offs across many asset classes yesterday. Asian stocks are currently mixed, after the major US indices fell to within one percentage point of a bear market, which is marked by a 20 percent drop from its high. US futures are now pointing slightly higher, which could erase some of the losses when US markets open Tuesday.
Oil to have easier path to downside amid risk of global oversupply
Investors are now having to contend not just with the uncertainties surrounding the coronavirus outbreak, but also with the global implications that come with sub-$40bbl Oil prices. Such levels could put the risk the fiscal standings of Oil-dependent nations, threaten a swath of corporate defaults in the industry, while eroding support for currencies that are linked to the commodity.
At the time of writing, Brent Oil is testing the $37/bbl psychological level, after falling by as much as 31 percent in the day prior to register its biggest single-day drop since the 1991 Gulf War. Still, the expected supply-shock compounds the languishing demand outlook. As Saudi Arabia and Russia get ready to unleash cheaper Oil supplies into the markets, at a time when global economic activity is being curtailed by the ill-effects of the SARS-CoV-2 outbreak, such supply-demand dynamics should maintain a downward bias for Oil prices.
Risk aversion elevates Gold to higher trading range
With investors nervous over the near-term outlook, safe haven assets have been the clear beneficiaries over the apparent risk aversion in the markets. Gold breached the $1700 level for the first time since December 2012, and has now found a new support level around the $1662 region. Bullion is expected to hold around these levels, barring any surer signs that the downside risks to the global economy are diminishing.
Disclaimer: The content in this article comprises personal opinions and should not be construed as containing personal and/or other investment advice and/or an offer of and/or solicitation for any transactions in financial instruments and/or a guarantee and/or prediction of future performance. ForexTime (FXTM), its affiliates, agents, directors, officers or employees do not guarantee the accuracy, validity, timeliness or completeness, of any information or data made available and assume no liability as to any loss arising from any investment based on the same.
US stock market suffered their biggest one-day percentage declines since 2008 on Monday in a session that started with plunge in oil and Asian indexes. Stocks closed off lows as President Trump proposed cuts to payroll taxes to alleviate coronavirus impact. The S&P 500 fell 7.6% to 2746.56. Dow Jones industrial sank 7.8% to 23851.02. The Nasdaq slumped 7.3% to 7950.68. The dollar weakening continued at faster pace yesterday: the live dollar index data show the ICE US Dollar index, a measure of the dollar’s strength against a basket of six rival currencies, fell 1.0% to 95.09 but is higher currently. Futures on stock indexes point to higher openings today.
European stocks end in bear territory
European stocks ended in bear territory on Monday. The EUR/USD accelerated its climbing with GBP/USD gaining fifth session in a row continuing yesterday. Both pairs are lower currently. The Stoxx Europe 600 index lost 7% led by energy shares, ending down more than 20% from its recent high . The DAX 30 slumped 7.9% to 10625.02. France’s CAC 40 dropped 8.4% and UK’s FTSE 100 sank 7.7% to 5965.77.
Asian indexes recover led by Australia’s All Ordinaries Index
Asian stock indices are mostly higher today following Monday’s plunge. Nikkei recovered 0.9% to 19867.12 as yen’s climbing against the dollar reversed. Markets in China are rising: the Shanghai Composite Index is up 1.7 % and Hong Kong’s Hang Seng Index is 2.0% higher. Australia’s All Ordinaries Index rebounded 3.1% as Australian dollar continued its slide against the greenback.
Brent futures prices are rebounding today after Monday’s sharp drop. Prices ended sharply lower yesterday as traders bet Saudi Arabia entered a war with Russia for market share over the weekend as it cut its export prices for crude. May Brent crude closed 24.1% lower at $34.36 a barrel on Monday.
Gold slips as Dollar weakening reverses
Gold prices are edging lower today. April gold rose 0.2% to 1675.70 an ounce on Monday.
Note: This overview has an informative and tutorial character and is published for free. All the data, included in the overview, are received from public sources, recognized as more or less reliable. Moreover, there is no guarantee that the indicated information is full and precise. Overviews are not updated. The whole information in each overview, including opinion, indicators, charts and anything else, is provided only for familiarization purposes and is not financial advice or а recommendation. The whole text and its any part, as well as the charts cannot be considered as an offer to make a deal with any asset. IFC Markets and its employees under any circumstances are not liable for any action taken by someone else during or after reading the overview.
New drill results from Marathon Gold are reviewed in a Haywood report.
In a March 2 research note, Haywood analyst Mick Carew reported that recent drilling at Marathon Gold Corp.’s (MOZ:TSX; MGDPF:OTCMKTS) Valentine gold project “continues to demonstrate the potential for another gold mineralized zone away from the four deposits that comprise the current resource.”
Carew explained that the new results are from the first eight holes of Marathon’s 2020 exploration program at the Central Newfoundland project. The holes specifically targeted quartz-tourmaline-pyrite-gold veining over a 200 meter (200m) long strike length, where they demonstrated the emergence of a potential new ‘Main zone’ sequence in mineralization in a new area the company has recently named the Berry zone,” he wrote.
The first eight holes were part of an overall 32,000m program of drilling in the 6 kilometer long Sprite corridor, situated between the Marathon and Leprechaun deposits.
Carew provided some highlight assays. Hole VL-20-799 is notable for its width of 55m, he noted, given most of the other widths were between 2m and 6m. This hole intersected 55m of 2.24 grams per ton (2.24 g/t) gold from a downhole depth of 113m, including 3m at 15.17 g/t gold, 3m at 10.96 g/t gold and 1m at 9.25 g/t gold.
Hole VL-20-801 intersected 8m at 3.92 g/t gold from a 146m downhole depth, including 2m at 9.63 g/t gold.
“The recent results are encouraging,” commented Carew.
However, more drilling is needed, he indicated, to assess the continuity of the mineralization encountered thus far and determine whether the grade at Sprite is as consistent as that of the Leprechaun and Marathon deposits.
Haywood has a Buy rating and a CA$2.50 per share target price on Marathon Gold, the stock of which is trading now at around CA$1.33 per share.
Disclosure: 1) Doresa Banning compiled this article for Streetwise Reports LLC and provides services to Streetwise Reports as an independent contractor. She or members of her household own securities of the following companies mentioned in the article: None. She or members of her household are paid by the following companies mentioned in this article: None. 2) The following companies mentioned in this article are billboard sponsors of Streetwise Reports: None. Click here for important disclosures about sponsor fees. 3) Comments and opinions expressed are those of the specific experts and not of Streetwise Reports or its officers. The information provided above is for informational purposes only and is not a recommendation to buy or sell any security. 4) The article does not constitute investment advice. Each reader is encouraged to consult with his or her individual financial professional and any action a reader takes as a result of information presented here is his or her own responsibility. By opening this page, each reader accepts and agrees to Streetwise Reports’ terms of use and full legal disclaimer. This article is not a solicitation for investment. Streetwise Reports does not render general or specific investment advice and the information on Streetwise Reports should not be considered a recommendation to buy or sell any security. Streetwise Reports does not endorse or recommend the business, products, services or securities of any company mentioned on Streetwise Reports. 5) From time to time, Streetwise Reports LLC and its directors, officers, employees or members of their families, as well as persons interviewed for articles and interviews on the site, may have a long or short position in securities mentioned. Directors, officers, employees or members of their immediate families are prohibited from making purchases and/or sales of those securities in the open market or otherwise from the time of the interview or the decision to write an article until three business days after the publication of the interview or article. The foregoing prohibition does not apply to articles that in substance only restate previously published company releases.
Disclosures from Haywood Securities, Marathon Gold Corp., Radar Flash, March 2, 2020
Analyst Certification: I, Mick Carew, hereby certify that the views expressed in this report (which includes the rating assigned to the issuers shares as well as the analytical substance and tone of the report) accurately reflect my/our personal views about the subject securities and the issuer. No part of my/our compensation was, is, or will be directly or indirectly related to the specific recommendations.
Important Disclosures
Of the companies included in the report the following Important Disclosures apply: ▪The Analyst(s) preparing this report (or a member of the Analysts’ households) have a financial interest in Marathon Gold Corp. (MOZ-T).
▪ Haywood Securities, Inc. has reviewed lead projects of Marathon Gold Corp. and a portion of the expenses for this travel have been reimbursed by the issuer.
▪ Haywood Securities, Inc. or one of its subsidiaries has managed or co-managed or participated as selling group in a public offering of securities for Marathon Gold Corp. in the last 12 months.
Other material conflict of interest of the research analyst of which the research analyst or Haywood Securities Inc. knows or has reason to know at the time of publication or at the time of public appearance: n/a.
Extreme volatility in the equity markets has investors wondering what to expect. Even the hardiest of stock market bulls are finally asking some serious questions about whether the top is in.
Stocks have long been priced for perfection and suddenly conditions are looking far from perfect. The coronavirus may be the pin which pricks the latest Fed-blown bubble.
Precious metals investors have been preparing against a rainy day. They may be less surprised by the turmoil in markets over the past couple of weeks. But there are still big questions about how metals prices might behave, especially if the current turmoil in markets should evolve into a full-blown financial crisis.
Here are two metals-market scenarios worth considering:
Scenario #1 – The 2008 Financial Crisis Revisited
During the immediate aftermath of the event, everything gets sold – a repeat of what happened in 2008. Investors buy bullion, even as traders dump leveraged futures in a rush to the sidelines on Wall Street.
Greg Weldon of Weldon Financial said metals investors could easily see a replay of 2008 in a recent Money Metals Weekly Market Wrap podcast. He noted the record number of active contracts, or open interest, in gold. The weak handed speculators who have chased the gold price higher will be quick to dump positions as prices move against them.
It won’t matter if more conservative investors are pouring into the physical markets for gold and silver. The futures markets are almost entirely untethered from physical supply and demand. Price discovery there is driven more by leverage, volatility, algorithmic trading, and bullion bank fraud.
Thus far the Treasury market action is reminiscent of 2008. Investors are buying bonds hand over fist and yields have fallen to new all-time lows.
As long as confidence remains in the U.S. dollar and U.S. Treasury debt, investors will look for safe haven in those markets. They are currently the widest and deepest markets on Earth and there aren’t too many other places for big money to go.
As the dust settles, look for money to pour back into gold and silver. Just as in 2008, speculators will be trying to position for what comes next.
Precious metals will pop up on the radar as a beneficiary of safe haven demand. These traders will also anticipate the Federal Reserve quadrupling down on stimulus measures and look for assets which can benefit from the weaker dollar and lower interest rates.
However, should confidence in U.S. Treasury debt and the dollar finally collapse, markets will look nothing like 2008.
Scenario #2 – The Mother of All Bubbles Pops
Government debt is far beyond what citizens can hope to repay. A reckoning is coming and the only question is when market participants at large will acknowledge that fact. When confidence evaporates, the party for central bankers and their political allies in government will be over.
Money is currently flooding into the bond markets, so at least some confidence remains. However, there are some key differences today versus 2008. The U.S. Treasury better hope investors continue to buy first and ask questions later, because bonds are an obvious bubble.
U.S. Treasury bond prices are at an all-time high. Meanwhile federal debt has nearly tripled since 2008.
Deficits are currently expected to be more than $1 trillion annually.
If recession strikes and officials respond with stimulus those deficits could easily balloon to $2 or $3 trillion.
The supply of Treasuries is already vast and a tidal wave of new issuance seems to be building. The Fed has been acting as the buyer of last resort. Will investors just continue to shrug as the central bank monetizes ever larger portions of the national debt? Maybe, but maybe not.
Steven Grey recently covered just how precarious the bond market is in a Wall Street Journal op-ed. Should interest rates start to rise, there will be enormous pressure to sell Treasuries. A market at all-time highs makes a dubious safe haven.
Interestingly, the U.S. dollar is not acting like it did in 2008. The DXY index has been under pressure since the market turmoil began a couple weeks ago. Currency traders lack confidence in the dollar. That may be contagious when it comes to the bond markets which most certainly aren’t well positioned for any serious inflation.
Don’t Gamble, Just Prepare
Betting on the first scenario only to find out we got the second would be disastrous. Anyone fleeing into cash or government bonds, just as the debt bubble finally bursts could be wiped out entirely.
The second scenario is coming, whether it be now or later. The sheer amount of debt accumulated cannot be paid, so it won’t be – at least not in current dollars. There is little point in trying to predict exactly when this reality will dawn upon the rest of the country.
It is safer to assume it could happen at any time. If we get a replay of 2008, metals will ultimately do well anyway.
The Money Metals News Service provides market news and crisp commentary for investors following the precious metals markets.
NZD traders, like their close cousins in Australia, might have to deal with something of a paradox over the next month when it comes to analyzing fundamental data.
While the economic situation improves, the data reports might be showing worse conditions. And the currency just might strengthen, even with unexpectedly bad data.
There is an important caveat, though. This depends on information coming out of China, and it’s not unheard of that the authorities in the Asian Giant make sure their reports reflect political goals more than reality.
However, China’s response to the coronavirus outbreak has come under unparalleled international scrutiny, with a wealth of information sources available.
New Zealand & the COVID-19 Outbreak
One would expect the Kiwis to be more affected by the virus outbreak than by the trade war. This is unlike with Australia, where the effect is the reverse.
New Zealand was one of the first to implement travel restrictions. And China is where most of their tourism comes from. Kiwi exports to China are mostly consumables. This means that, with shops being closed to fight the COVID-19 outbreak, there would be a drop in demand for goods from New Zealand.
During this period, one of the key indicators for the NZD, the global dairy price index, took a bit of a beating (as did most other commodities). Towards the end of last month, China started to report that the number of new cases had dropped significantly.
This indicated that the spread of the disease was coming under control. After the trend held for a couple of weeks, some quarantines were lifted and factories started going back to work, Thus, NZDUSD started moving up in anticipation of a return to normal.
Investors wanted to get in on the bottom of a potential V-shaped impact from the virus.
Why the Bad Data?
There is an offset between when the data is collected and when it gets reported. During March, we get reports from data collected during February when the COVID-19 situation looked most dire.
That offset means that even as conditions improve, we’re going to be getting relatively negative economic reports. This is why, despite the worst Caixing PMIs ever, the NZD got stronger over the last week.
Data Going Forward
Tonight, we have the report of New Zealand Manufacturing Sales for Q4. Expectations are for this to increase by 4.3% in price, compared to -0.3% in the prior quarter.
This was in the lead-up to the Phase I deal, and long before the coronavirus hit the news. Investors might be looking at this figure as where manufacturing might return to once the situation in China has normalized.
Tomorrow at night, we have Electronic Card Retail Sales for February. Expectations are that they will improve by 0.3% over the prior month. Annually, that implies an increase of 4.1% compared to 4.2%. This is below the usual increments we typically expect in the summer. However, given the economic situation, the markets might interpret the results as quite positive.
The next question on everyone’s mind is whether the RBNZ is going to follow the RBA in another rate cut. But, the meeting isn’t until the end of the month.
That might actually mean a cut is less likely if the expected recovery in China materializes over the next couple of weeks.
By Jameel Ahmad, Global Head of Currency Strategy and Market Research at FXTM, ForexTime
Market sentiment was already viewed as a sinking ship and the Oil price crash has ensured that it has dropped even further into deep water. World stock markets have fallen at a sharp rate, with the Dow Jones Industrial Average expected to decline as much as 7% when the U.S trading session commences just minutes from now. This follows declines of 8% in the UK FTSE 100 and 5% in Japan’s Nikkei 225.
With an all-out price war in Oil between Saudi Arabia and Russia suggesting that coronavirus risks on the global economy are going to be magnified by an astonishing drop in Oil price, investors feel safer in this environment to stay away from riskier assets and turn towards safe-haven investments instead.
Gold is once again acting as the shining light and savior of investors with prices breaking above $1700 for the first time since December 2012. Where the opportunities still can be found is across Yen pairs, with the USDJPY plunging all the way to 101 from 104 so far today. The USDJPY in this environment can drop towards 100, and even 98 should the selling in world stock markets continue at the same type of pace to what has been experienced across the past few days.
Where this leaves the Federal Reserve is the major question on the minds of investors. Expectations are on the rise once again that the Fed will need to cut US interest rates as low as 0% within months, while announcing another round of Quantitative Easing is also appearing on the radars of possibility. Should this occur, the slump in the USD should pave the way for an even stronger EURUSD and GBPUSD.
Disclaimer: The content in this article comprises personal opinions and should not be construed as containing personal and/or other investment advice and/or an offer of and/or solicitation for any transactions in financial instruments and/or a guarantee and/or prediction of future performance. ForexTime (FXTM), its affiliates, agents, directors, officers or employees do not guarantee the accuracy, validity, timeliness or completeness, of any information or data made available and assume no liability as to any loss arising from any investment based on the same.
The Federal Reserve Bank of New York, which implements U.S. monetary policy, raised its offering of liquidity this week to ensure that funding markets continue to operate smoothly and said it would continue to adjust its repurchase operations to foster an effective implementation of policy.
The New York Fed has been gradually reducing its liquidity injections after its intervention in September when a shortage of reserves in the banking system pushed up repo rates beyond the range set by the Federal Open Market Committee (FOMC).
The New York Fed is one of the 12 federal reserve banks in the U.S. but the most important as it implements monetary policy on behalf of the Federal Reserve System through its trading desks and also supervises and regulates financial institutions.
The New York Fed said the changes was made to ensure the supply of reserves at banks remain ample and ease the risk of pressure in money markets that could affect policy implementation.
“They should help support smooth functioning of funding markets as market participants implement business resiliency plans in response to the coronavirus,” the Fed said.
The New York Fed said it was raising its overnight lending amounts through repo operations today and through March 12 to minimum $150 billion from $100 billion.
The Fed is also raising the amount of money it offers through 2-week repo operations on March 10 and March 12 to $45 billion from $20 billion previously scheduled.
On March 3 the FOMC lowered its target range for the benchmark federal funds rate by 50 basis points to 1.0 to 1.25 percent, it’s first inter-meeting rate cut since Oct. 8, 2008.
The Federal Reserve Bank of New York issued the following statement regarding its repurchase operations:
“The Open Market Trading Desk (the Desk) at the Federal Reserve Bank of New York has updated the current monthly schedule of repurchase agreement (repo) operations.
Beginning with today’s operation and through March 12, 2020, the Desk will increase the amount offered in daily overnight repo operations from at least $100 billion to at least $150 billion. In addition, the Desk will increase the amount offered in the two-week term repo operations on Tuesday, March 10, 2020 and Thursday, March 12, 2020 from at least $20 billion to at least $45 billion.
Consistent with the FOMC directive to the Desk, these adjustments are intended to ensure that the supply of reserves remains ample and to mitigate the risk of money market pressures that could adversely affect policy implementation. They should help support smooth functioning of funding markets as market participants implement business resiliency plans in response to the coronavirus. The Desk will continue to adjust repo operations as needed to foster efficient and effective policy implementation consistent with the FOMC directive.
Detailed information on the schedule and parameters of term and overnight repo operations are provided on the Repurchase Agreement Operational Details page. The Desk will release the next monthly repo operation schedule for the March 13, 2020 to April 13, 2020 period on Thursday, March 12, 2020 around 3:00 PM ET.”
A downward movement means weakening of the British pound. Brexit could negatively affect the British economy. Important macroeconomic data for January will be released in the UK this Wednesday: Construction Output, Industrial Production, Manufacturing Production, Monthly GDP, Trade Balance and others. All forecasts are negative, which may adversely affect the dynamics of the pound. Note that the rate of the Bank of England is 0.75%, which is much less than annual inflation of 1.8%. According to interest-bearing futures, with 100% probability the Bank of England will lower the rate to 0.5% at the next meeting on March 26. Let us recall that on March 18, the next round of negotiations on Brexit begins, which may affect the dynamics of the pound.
 Current events: