On Tuesday, March 17, trading on the EURUSD pair was down at the close. The fall of the pair accelerated after the breakout from the level at 1.11. The level of 1.1060 also did nothing to stop the euro from weakening. The USD strengthened on all fronts, leaving no chance for a rebound. This came on the back of news that US Treasury Secretary Steven Mnuchin presented a package of measures worth $850bn. USD to Republican senators to help stimulate the economy.
At the end of the day, major US stock indexes rose from 5.2% to 6.2%. The S&P500 closed at 2529.19. The EURUSD pair fell to 1.0955.
15:30 Canada: BoC Consumer Price Index Core (YoY) (Feb).
15:30 USA: Housing Starts (MoM) (Feb), Building Permits Change (Feb).
17:30 USA: EIA Crude Oil Stocks Change (Mar 13).
Current situation:
On Tuesday, bears sold the euro at 1.1055. Bulls were not ready to meet them at this price, and so refused to buy back the proposed euros. As a result, the price went into the off-peak zone, below the D3 line. The price rebounded, but only recovered to 1.1045.
Today, futures for US indices dipped into negative territory by 3.5%. Yields on 10-year US bonds also fell 5%, to 1.028. The situation is ambiguous, since the USD continues to weaken due to a decrease in profitability, and technical analysis on the hourly TF indicates a continued decline to the level of 1.0900 or 1.0870.
There is no “bullish” divergence between AO and the current price and so therefore, bears dominate the market. Considering that yesterday, the price fell into the off-peak zone and is now being traded at the D3 line, the flat can drag on until it meets the balance line (Lb). I do not have a current forecast to work off, so I’ll reserve judgement until after the opening of the American session.
As I begin the weekly missive here on Thursday, the U.S. equity markets are experiencing the worst daily assault since that fateful day back in 1987, when the Dow lost 23% in a single trading session, sending thousands of Gucci-clad stockbrokers to the Sears re-fit aisle. Being the incredibly prescient individual that I am (tongue firmly planted in cheek), I have attempted four times since 6 a.m. to put words to paper, and four times I have deleted every paragraph and no fewer than ten different charts.
I have tried humor, I have tried humility, I have tried hubris, I have even tried cheerleading. Alas, at the end of the day, I am proceeding on the premise that followers of my work want a simple opinion on one thing: tactics. What are the tactics that I intend to employ to show a positive return for the year 2020? (Subscribers will have my blueprint in the subscriber section, which may be accessed at this shamelessly offered e-mail address of [email protected].)
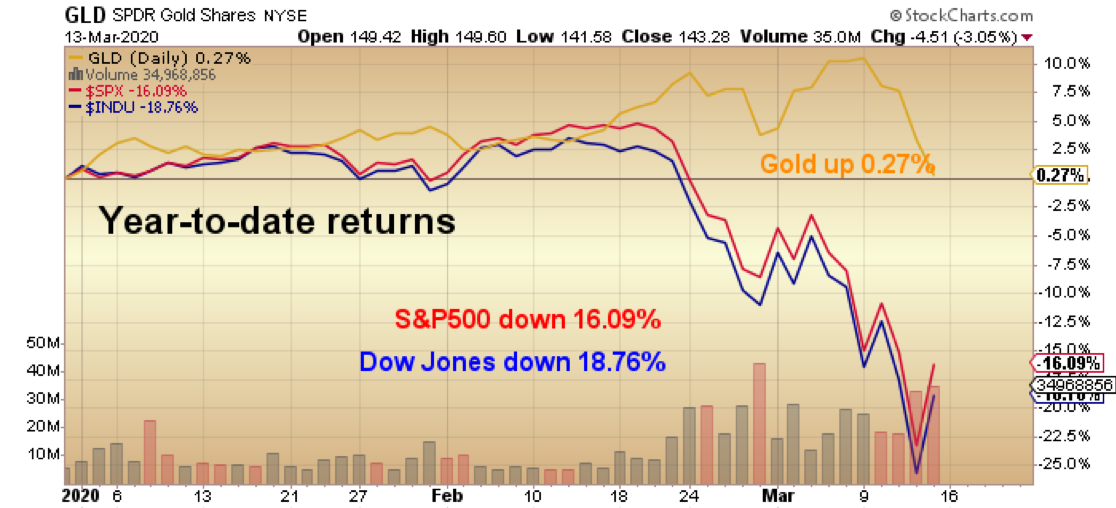
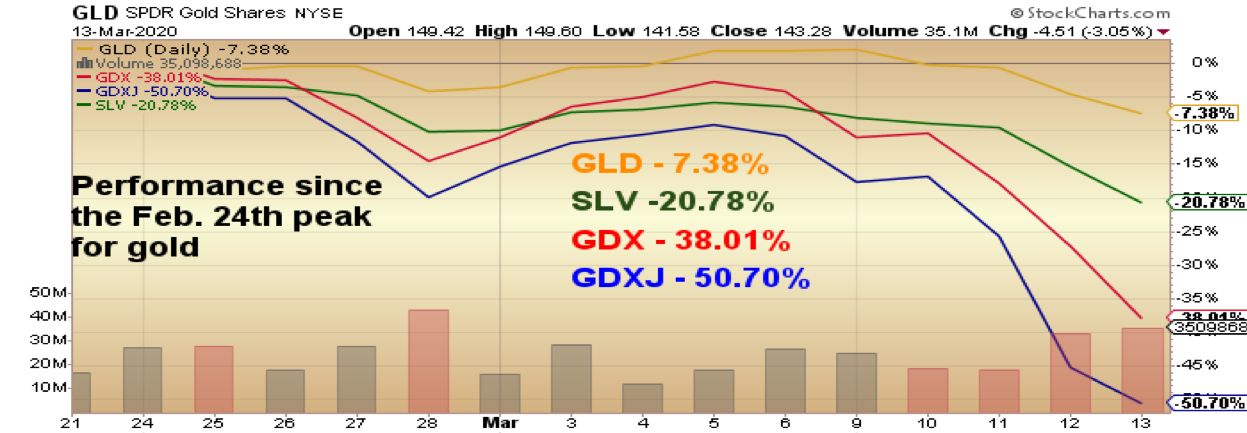
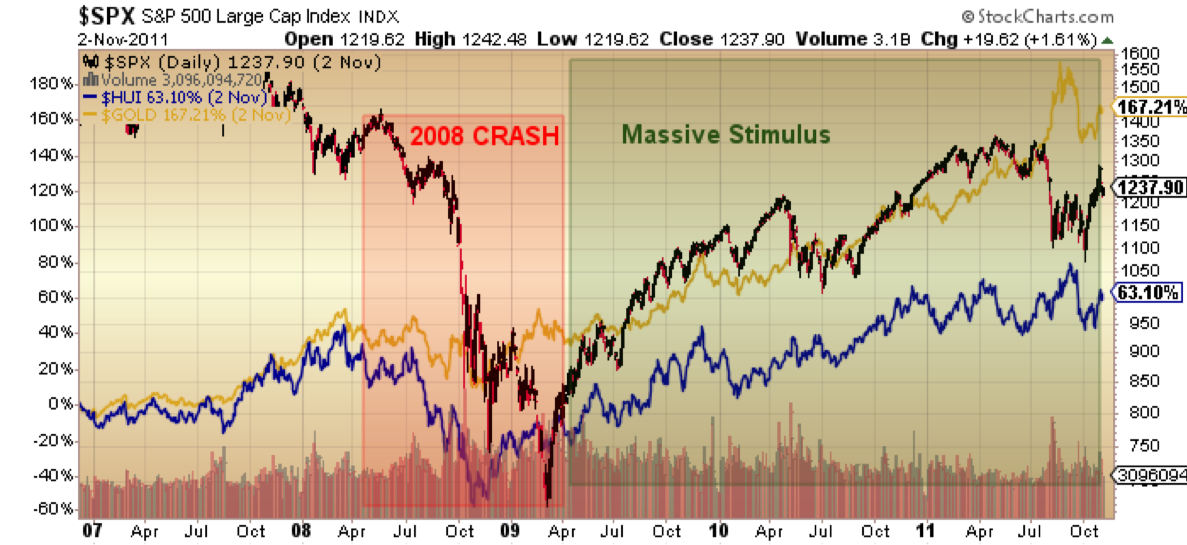
First, I want to talk about the gold market and its pitiable inability to hedge one’s net worth against a market meltdown. While the chart below clearly shows that gold investors are still (barely) ahead, 0.27% versus the S&P down 16.09% and the DJIA down 18.76%, the strategy was based on the assumption, from its behavior in 1987 and 20092011, that gold would advance in the opposite direction to stocks, but that in the event of a crash, it would initially suffer, then outperform.
However, it had lost a good deal of the 2020 gains in Thursday’s sessionat one point, it was down over $80 per ounce as obvious margin selling took its toll. While it is indeed outperforming stocks, it is still getting smacked, and that is little solace to investors in the gold miner exchange-traded funds (ETFs) and junior explorer/developers (not to mention silver).
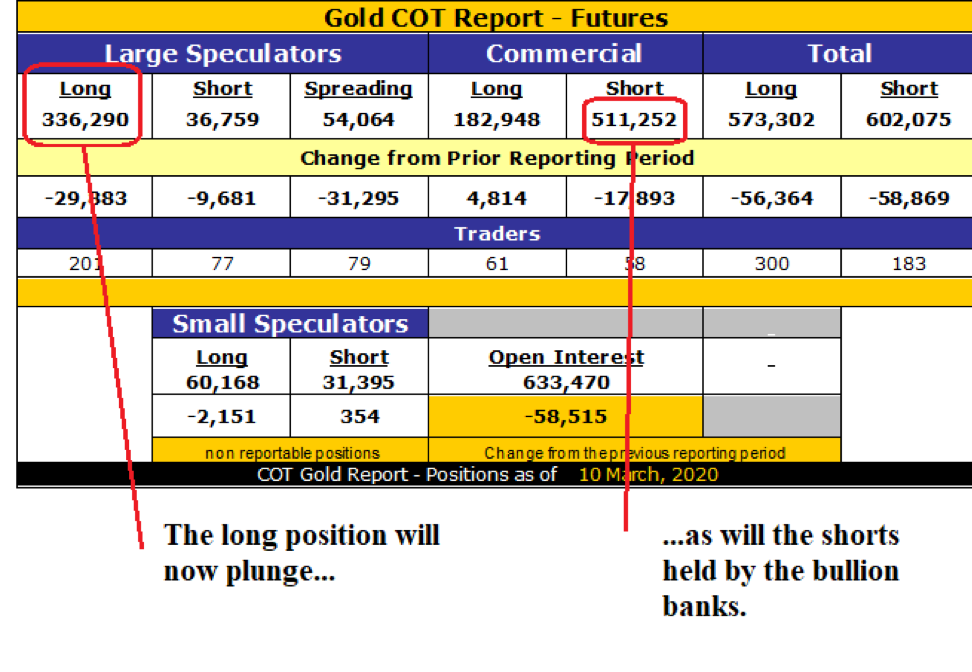
COT Report: Observe the vast differential between the Large Speculators and the Commercials, where the open interest was at record levels. With the late-week crash, massive short covering by the Commercials will be matched off against similar capitulatory selling by Large Specs. It is part and parcel of all that is wrong with this incessant “control freak” tendency whereby the New York banks, with support from the D.C. morons, allow gold to be capped and stocks to be “bid,” which played out again by week’s end in spades.
Twelve years ago, the Fed stepped up and bailed out the banks as a reward to the American people, told them to buy stocks, and then juiced the markets to record highs in the ensuing years. This afternoon, in response to a highly stressed 30-year bond auction, the Fed added $3 trillion to the REPO facility. It remains obvious to this investor that the problem in the markets is indeed a financial crisis, as opposed to the protests of the pundits and market gurus that are sluffing this off as “simply” a health crisis (it’s that too).
I “faded” the immortal words of the late Marty Zweig, whose #1 trading rule was “Don’t fight the tape and don’t fight the Fed.” Back in 2001, and in 2009, and again in December 2018as in all three instancesthe major averages reversed and then went on to new highs. I would be sitting in my humble office humming darts at pictures of Bernanke or Yellen or Powell as the “invisible hand” of the New York Fed swooped down and saved the day, just as the averages were threatening to enter either correction mode or bear market mode.
Through the past eleven-year bull market, the stock market’s role as an economic barometer faded purely because of the machinations and interventions of the mystical miasma of late afternoon shenanigans in all markets deemed “crucial to National Security” or, more appropriately, the reelection of the incumbent.
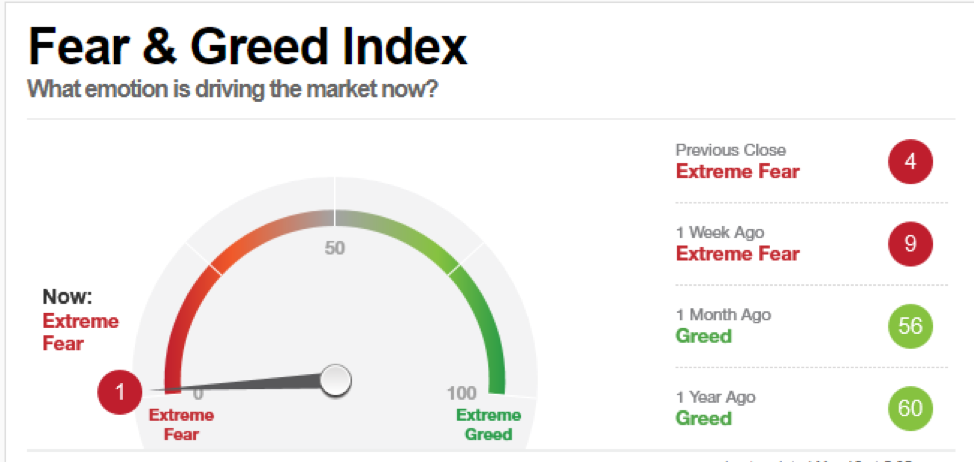
So, with the CNN Fear and Greed Index at “1” and abject terror filling the hearts of all investors (amateur and pro), I turned bullish on Thursday for the first time in over a decade. That all asset classes got smoked that day in a gut-wrenching drawdown of immense proportion is a testimonial to the leverage currently in use across the entire spectrum of financial markets. Thirty-something math geeks using sophisticated algorithms deduce that a 10-standard deviation move in a position in which they have notional value fifteen times the asset value of their fund could never occur. And yet it does. And they get wiped out.
In a manner not unlike the spread of the COVID-19 microbe across the planet, the “Sell Everything” contagion infected the vast majority of over-leveraged funds, with their prime brokers issuing margin calls at an alarming (but not surprising) pace. Remember, conditions like these are the fertile breeding grounds for new bull markets.
I began to finish the weekly missive Friday afternoon with gold down US$85 per ounce (5%) and silver down US$1.50 (9.5%), placing gold in correction territory and silver in a full-on bear market. While I have largely avoided the bulk of the drawdown by avoiding the senior and junior gold ETFs, a late-week flash crash has them all at shockingly low levels.
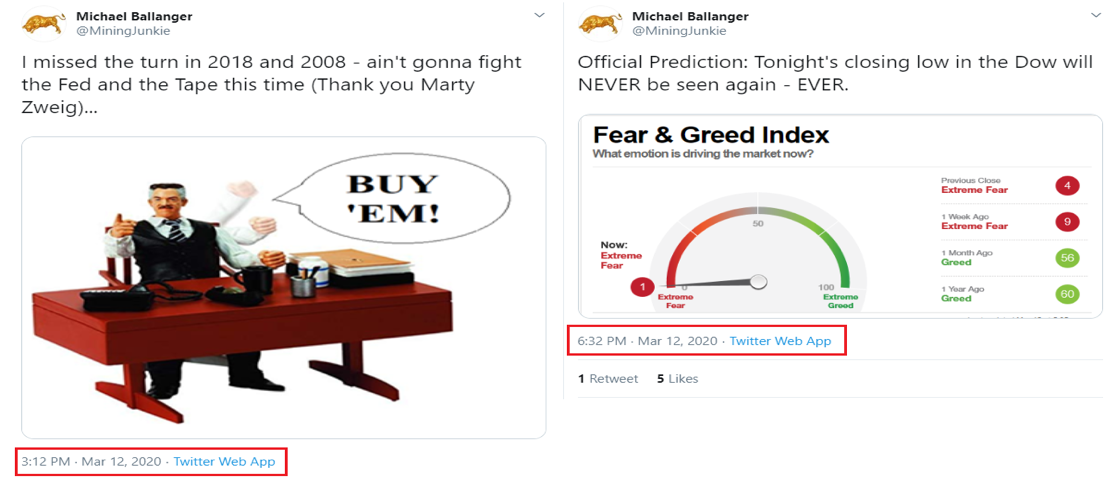
With the Dow down nearly 2,000 points on Thursday afternoon, I fired off a tweet to my followers that was, in itself, one of about five I sent out. But the one shown below was truly how I felt going into the last hour of trading. I was putting my money where my mouth was, and bought two-thirds of a large position that was bleeding from the eye sockets by the time the final bell sounded. “I missed the turn in 2018 and 2008ain’t gonna fight the Fed and the Tape this time (Thank you Marty Zweig)” was my message, and with Friday’s 1,985 pop, it had paid off in spades.
Now, if I started taking victory laps because I bought into a crashing S&P running a sub-20 relative strength index (RSI), I would be seen as somewhat disingenuous, because while my handful of SPY calls were doubling, my carefully constructed GGMA portfolio was taking a pounding. While I have been overweight the physical metals and seriously underweight the senior and junior miner ETFs, they took GLD and SLV down hard, with losses topping 3% and 8% respectively, a development I totally did not expect.
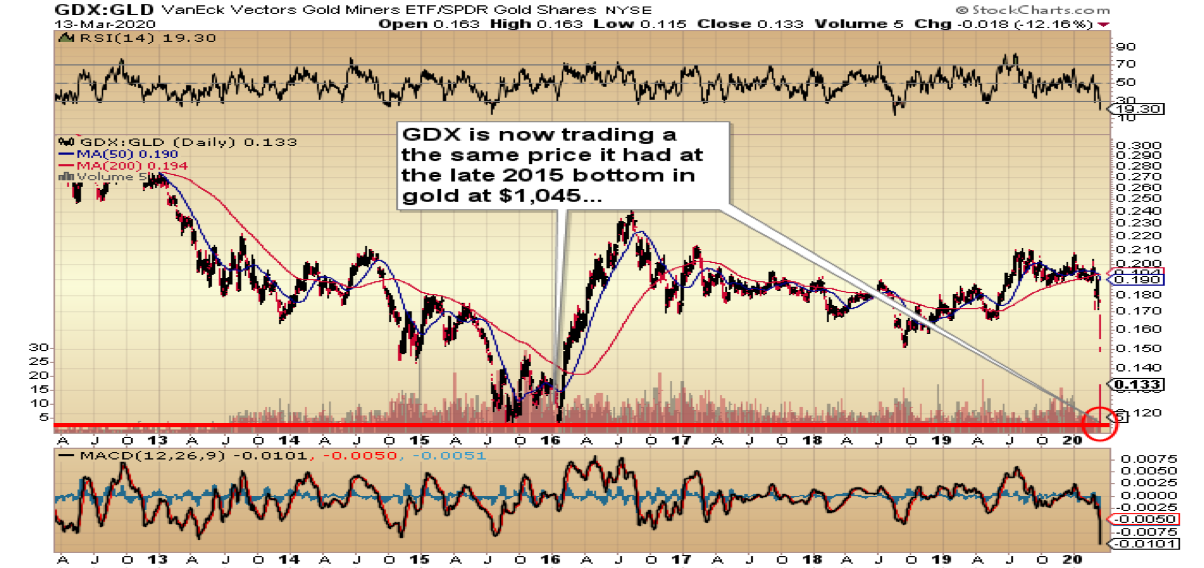
Nevertheless, the point here is that now is the time to go overweight the miners and underweight the physical metals, because of this one glaringly expressive chart, which plots the price of the senior miners (GDX:US) against the price of gold (GLD:US). I am not going to launch into a mindless rant about interference and intervention and manipulation, but just as “magical” was the reversal in stocks in the wee hours of the Friday morning (down 600 to up 700 Dow points in less than an hour), you can take to the bank the notion that part of this theatrical display of market dynamics involved sending a powerful message to the naysayers by way of an April 2013-style carpet-bombing of the precious metals, two historic adversaries of equity market cheerleaders (like Larry Kudlow).
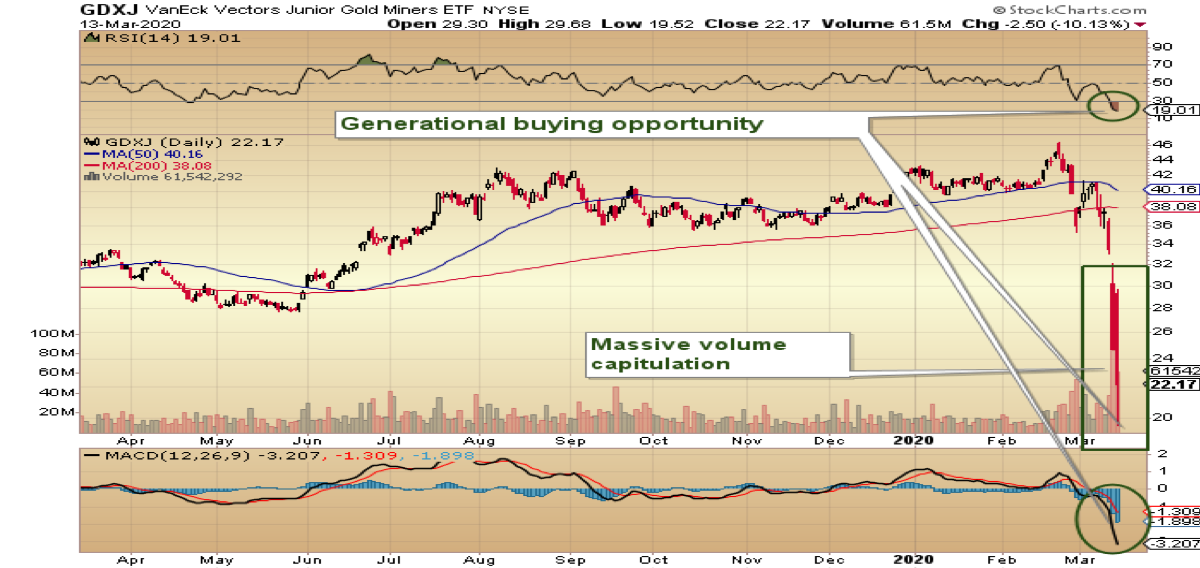
The chart shown above has the GDX plotted against the price of gold, and based upon the Friday close, the senior gold miner ETF is now back to valuation levels from January 2016, when the HUI hit 99.17 after a large European sovereign wealth fund puked out its entire gold miner holdings in one session, creating a decade-long bottom. The action in the precious metals and mining shares this week was at once both irrational and bizarre, setting up a generational opportunity for traders and conservative investors alike.
A few weeks ago, I wrote: “I don’t want to hear or read excuses that blame JP Morgan or HSBC or the Crimex or the SEC or the “cartel”; I want silver to break free of the shackles of intervention and interference and get into gear today. Period. If silver fails to launch into the slingshot effect, then the integrity and validity of the gold move is suspect and that goes for the Gold Miners as well.”
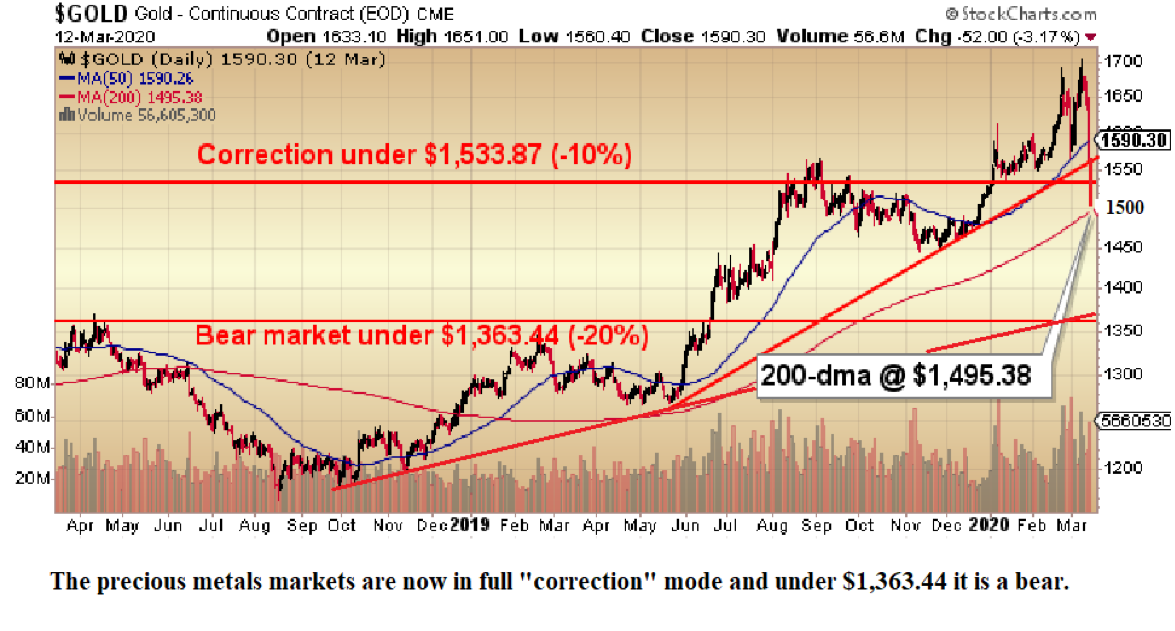
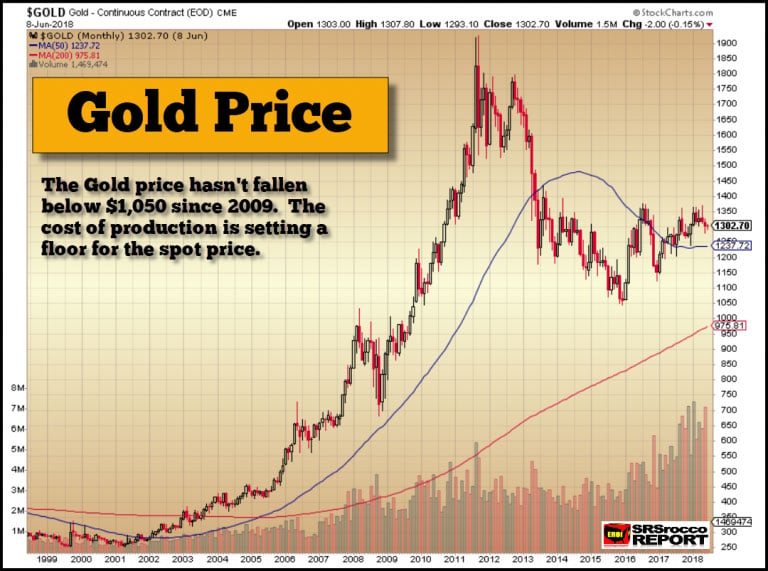
Now we know precisely what the silver market was telling us. And yet, despite the carnage, gold has not yet entered an official bear market. It is in a full-blown correction but if we hold $1,363, the bull remains alive and well, and therein lies the reason that I was a buyer of the miners on Friday, and will continue to do so this week.
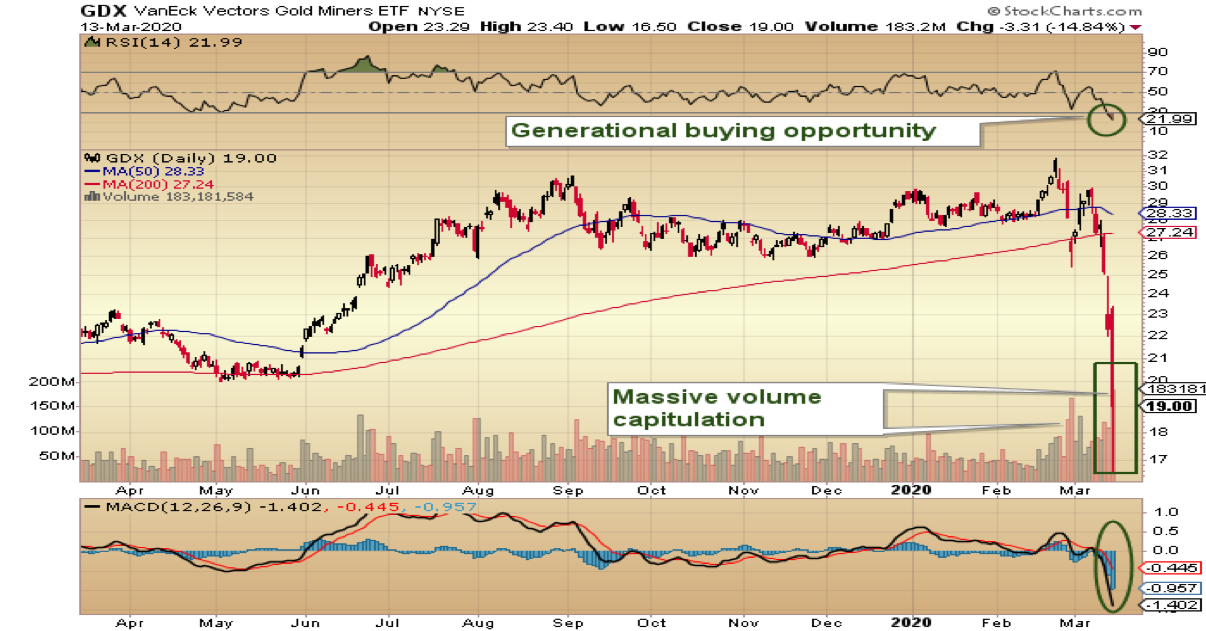
For your interest and review, I include the two charts below, of the GDX and GDXJ, which demonstrate just how egregiously oversold they are. RSI readings of 21.19 and 19.01 are synonymous with every bottom that I have ever encountered, and this time is no different. On a side note, the social media comments from all of the newsletter writers were completely consistent with prior bottoms, and I fully expect the usual gang to claim credit for forecasting the bloodbath. But in the final analysis, everyone got smoked, and the heroes are those that lost the least. That is part and parcel of market crashes, and I consider myself fortunate to have a hefty cash position in my trading account to deploy into issues representing such phenomenal value.
The chart posted above is all you need to see in order to ascertain the right course of action. The steps taken this week by the central banks to loosen monetary condition, plus the fiscal measures announced this afternoon by the POTUS, were and are designed to bolster stock prices and re-elect the incumbent. It is really that simple, and while earnings are going to be challenged due to the disruptions caused by COVID-19, the miners generate a ton of cash flow with a $1,500 gold price.
It was a difficult week for all, and it is my sincere wish that everyone stays safe and rides out the current storm in the company of healthy family and friends.
Originally trained during the inflationary 1970s, Michael Ballanger is a graduate of Saint Louis University where he earned a Bachelor of Science in finance and a Bachelor of Art in marketing before completing post-graduate work at the Wharton School of Finance. With more than 30 years of experience as a junior mining and exploration specialist, as well as a solid background in corporate finance, Ballanger’s adherence to the concept of “Hard Assets” allows him to focus the practice on selecting opportunities in the global resource sector with emphasis on the precious metals exploration and development sector. Ballanger takes great pleasure in visiting mineral properties around the globe in the never-ending hunt for early-stage opportunities.
Disclosure: 1) Statements and opinions expressed are the opinions of Michael Ballanger and not of Streetwise Reports or its officers. Michael Ballanger is wholly responsible for the validity of the statements. Streetwise Reports was not involved in any aspect of the article preparation. Michael Ballanger was not paid by Streetwise Reports LLC for this article. Streetwise Reports was not paid by the author to publish or syndicate this article. 2) This article does not constitute investment advice. Each reader is encouraged to consult with his or her individual financial professional and any action a reader takes as a result of information presented here is his or her own responsibility. By opening this page, each reader accepts and agrees to Streetwise Reports’ terms of use and full legal disclaimer. This article is not a solicitation for investment. Streetwise Reports does not render general or specific investment advice and the information on Streetwise Reports should not be considered a recommendation to buy or sell any security. Streetwise Reports does not endorse or recommend the business, products, services or securities of any company mentioned on Streetwise Reports. 3) From time to time, Streetwise Reports LLC and its directors, officers, employees or members of their families, as well as persons interviewed for articles and interviews on the site, may have a long or short position in securities mentioned. Directors, officers, employees or members of their immediate families are prohibited from making purchases and/or sales of those securities in the open market or otherwise from the time of the interview or the decision to write an article until three business days after the publication of the interview or article. The foregoing prohibition does not apply to articles that in substance only restate previously published company releases.
Charts provided by the author.
Michael Ballanger Disclaimer: This letter makes no guarantee or warranty on the accuracy or completeness of the data provided. Nothing contained herein is intended or shall be deemed to be investment advice, implied or otherwise. This letter represents my views and replicates trades that I am making but nothing more than that. Always consult your registered advisor to assist you with your investments. I accept no liability for any loss arising from the use of the data contained on this letter. Options and junior mining stocks contain a high level of risk that may result in the loss of part or all invested capital and therefore are suitable for experienced and professional investors and traders only. One should be familiar with the risks involved in junior mining and options trading and we recommend consulting a financial adviser if you feel you do not understand the risks involved.
Asian stocks are mixed, unable to capitalise on Wall Street’s lead after all three major US stock indices posted gains yesterday. Although US equities were buoyed on Tuesday by the prospects of President Trump’s US$1.2 trillion stimulus package for the world’s largest economy, investors are not getting giddy with hope that a global recession can be averted. US stock futures currently point to losses, while Gold and the Japanese Yen are seeing slight advances.
The short-lived gains in global equities show that investors remain skeptical of the huge swathes of support measures being rolled out around the world. Global economic activity has already taken a hit, judging by the hard data out of major Asian economies, with the heightened travel limitations and quarantine measures across continents adding to the dismal outlook. Unless the coronavirus outbreak can defy expectations and show it will stabilise in the immediate term, investors fear that the current economic trajectory will only point to a dreaded global recession.
Dollar eases after recent surge
The Dollar index has made a V-shaped recovery, gaining over four percent since breaking below the 95 psychological level on March 9. Despite the Fed already using up most of its conventional tool box to try and mitigate Covid-19’s impact on the US economy, with Dollar weakness typically accompanying monetary policy easing, the Greenback has instead benefited from a surge in demand for the shelter it provides amid tumultuous market and economic conditions.
Although US$ 1.2 trillion in fiscal stimulus could stem the risk of a US recession while offering some measure of calm for investors, the economic outlook remains highly uncertain at this point in time and does not yet warrant venturing out significantly into risk-on waters. Such broad caution should ensure a supportive environment for the Greenback until the coronavirus-inspired fears start to fade away.
Gold prices to find floor once market panic subsides
Gold’s safe haven status has been challenged of late, with risk-averse investors displaying a marked preference for King Dollar at the expense of Bullion. Once the liquidity squeeze eases and Gold prices find a more stable footing, investors concerned about the global economic outlook should eventually come flocking back to the precious metal and send prices back above $1600.
Supply and demand disruptions set to drag Oil lower
Brent futures are now languishing below $30/bbl, trading at levels not seen since 2016. Barring active steps by OPEC+ to intervene and rebalance the markets, the supply-demand shocks may eventually drag Brent along the $20/bbl floor. The heightened risk of a global recession, coupled with the threat of cheap supplies flooding the markets, ensures that Oil’s weakening bias remains intact for the time being.
Disclaimer: The content in this article comprises personal opinions and should not be construed as containing personal and/or other investment advice and/or an offer of and/or solicitation for any transactions in financial instruments and/or a guarantee and/or prediction of future performance. ForexTime (FXTM), its affiliates, agents, directors, officers or employees do not guarantee the accuracy, validity, timeliness or completeness, of any information or data made available and assume no liability as to any loss arising from any investment based on the same.
By TheTechnicalTraders – In this section of this multi-part research article related to the potential economic destruction of the Covid-19 virus event across the global markets (Part I, Part II).
We’re going to peer into data related to the GDP and other factors of the US economy. Remember, the US economy is the largest single economy and consumption component in the world. As we suggested in our earlier research, the US and China (combined) account for about 30% of the total global GDP each year. The top 12+ GDP nations on the planet account for just under 80% of the total annual GDP for the globe. What happens if economic activity and global GDP collapse for the next 24+ months because of the Covid-19 virus?
First, be sure to opt-in to our free market trend signals before closing this page, so you don’t miss our next special report!
The second thing we want to discuss is the real potential for economic interruption within the global markets. As of today, the US has declared an emergency status and many states and cities have already started to shut down schools, sporting events, entertainment venues and many other aspects of the US economy. Additionally, a travel ban has been set up in an attempt to prevent the spread of the Covid-19 virus and the potential of an uncontrolled global contagion. We believe these travel restrictions will stay in place for at least 60+ days and we believe the spread of this virus will continue for at least another 45+ days before potentially “leveling off”.
The third thing we want to discuss is the economic fallout that is resulting from this Covid-19 event. It has clearly become evident that exporting a large portion of our manufacturing capabilities to China and other nations puts the USA in a very dangerous situation. China has threatened to withhold vital medical supplies and other items from the USA over the past few weeks as China attempts to blame the USA for initiating this virus event. Simply put, America will not be held hostage by China under any circumstances.
Additionally, we believe other mature economies and nations are also starting to reconsider many policies and manufacturing processes related to this event. Although we don’t have any real proof that this Covid-19 virus event originated in a Chinese lab in China, the very first instance of this virus was documented in China in November 2019 and didn’t really spread to any other country until well into 2020. It makes perfect sense this Virus originated in China and spread throughout the Chinese New Year to other nations.
Debt and Banking capabilities become a real issue at times when consumers shift spending and economic habits. Large sectors of the economy become “at-risk” very quickly. The way our researchers put it is “isolated economic events may cause certain economic events to unfold, but extended economic events put greater pressure on even mostly healthy corporations and enterprises as lack of revenues and a shift in consumer activity can result in a broad market collapse”.
So, here we have the setup of the economic event and now we can speculate about the consequences. Our researchers believe the immediate needs of all nations is to attempt to contain this virus event and to reconsider policies and manufacturing processes/locations to eliminate risks related to hostile countries. Is it worth it to save a few pennies to manufacture something while putting your entire nation at risk when an event like this happens?
The funny thing about all major events, like this, is that usually cause people and nations to “shift gears”. Remember after 9/11 how America shifted away from certain policies and came together to support our military against terrorists around the world? Remember after the 2008-09 credit crisis how the US took immediate steps to attempt to prevent this type of financial event from happening again and how consumers were “shell-shocked” to re-enter the marketplace after the fallout? This same type of social constriction happens all over the world as consumers/people act in a flock-mentality.
What do our researchers believe is the most likely outcome for Q1 and Q2 of 2020?
We took the past 73 years of quarterly US GDP data and attempted to run two rolling Standard Deviations on them. The first, a 12 quarter (roughly three years) rolling Standard Deviation. The second, a full 10-year rolling Standard Deviation. The purpose of this was to determine how volatile past economic events have been related to these standard deviation ranges.
There have only been a few economic events that meet any of the criteria similar to the Covid-19 virus event. The closest was the 2008-09 Credit Crisis. All other events were isolated US types of events related to bubble events and Federal Reserve functions.
1957-1958: a collapse in GDP growth (below the 12 QTR StdDev) took place where GDP contracted by nearly 10 billion (-2%), then almost immediately rebounded back to 2x StdDev growth by 1959.
Mid 1960 to mid-1961: GDP growth collapsed to below 1x StdDev range, at one point almost stalling in Q1 1961, then immediately rebounded back to 2x StdDev growth by the end of 1961.
Q1 1982 to Q1 1983: GDP growth stalled to levels near 0.5 StdDev range for a period of 12 months before slowly rebounding back to 1x+ levels by late 1983 into 1984.
Q3 1990 to Q4 1991: GDP growth stalled to nearly 0.6 of the StdDev range, then rebounded back to 1.5x StdDev range by Q2 1992
Q4 2000 to Q3 2002: The Dot Com bubble and the 9/11 terrorist attacks resulted in an extended contraction in GDP expansion throughout this time. By Q4 2001, GDP growth was only 0.53x the StdDev range. Growth finally rebounded in late 2002.
Q1 2008 to Q1 2010: The Credit Crisis really took a toll on GDP. Throughout most of 2008, GDP levels were still positive and above 0.5x the StdDev range. Yet in Q3 2008, everything turned negative and GDP reached an extreme (-2.088x) StdDev range in Q3 2009. Gdp rebounded back to 2x StdDev range in Q1 2010.
Q3 2015 to Q3 2016: This was an election year GDP contraction. GDP continued to grow, but fell below the 1x StdDev range that seems to be very consistent. Q4 2016 returned to levels above 1x StdDev.
What this shows us is that a -2x StdDev range is not uncommon and that a bigger move could take place with the right global economic setup. A 3x or 4x GDP reversion (downside collapse) is also not out of the question if certain circumstances setup to present such an event.
In conclusion
This lengthy article and extensive research, our researchers do believe a 2x to 3x GDP reversion event is on the immediate horizon. Given current data points and the fact that we’ve had little “transition” from previous growth phases to this potential new contraction phase, we believe the GDP contraction for Q1 2020 is likely going to be -10% or more from previous levels. We believe Q2 GDP contraction may actually be higher (-12% or more). This will be the result of China’s contracting and quarantining economy as well as the fallout from the continued spread of the Covid-19 virus throughout the rest of the world.
We believe Q4 2020 may result in a positive GDP quarter before further GDP contraction takes place in early 2021. We believe this will likely be the result of extended global economic malaise, global banking issues, global credit, and corporate earnings issues and the possibility that a global asset revaluation event may be taking place (similar to the 2008-09 Credit Crisis event). This time, though, we believe it will be foreign markets engaging in a Credit Crisis and asset revaluation process that will drag the US economy into a 2021~2023 slump.
A 2x StdDev GDP event right now would be a collapse of $1.65T. A 3x StdDev GDP event right now would be a collapse of $2.486T. A 4x StdDev GDP event (God forbid), right now would be a collapse of $3.316T. Remember, it is not really the size that matters – it is the length of time this contraction takes place.
Be prepared for some really ugly earnings data in Q1 an Q2 of this year, then we’ll figure out if our expectations were accurate or not and what we should be doing to plan going forward.
The type of market condition I think we have entered could be here for a long time, and it’s going to be a traders’ market, which means you must have a trading strategy, plan your trades, and trade your plan. It’s amazing how simple a few trading rules that are written down on paper can save you thousands of dollars a week or month from locking in gains or cutting losses.
I have this mini trading strategy mastery course if you want to take control of your trades and override your emotional issues. And also if you want to start making money from home which is the only option going forward the next 3-6 months from the looks of it my trading as a business program is something to think about doing.
– If you hold winners until they turn into losers
– Taking too large of a position and get stuck with a drawdown so large that if you close the position you will lose 10-50% of your trading account
– have mastered the art of buying high and selling low repeatedly?
All these things happen to most traders, and they can easily be overcome with a logical game plan I cover in the crash courses, pun intended ?
In short, if you have lost money with your trading account this year giving back years of gains, I think it’s worth joining my trading newsletter so you can stay on top of the markets and if you really want to excel take my mini-courses. I take the loud, emotional, and complex markets and deliver simple common sense commentary and a couple of winning trades each month for you to follow.
My trading is nothing extreme or crazy exciting because I’m not an adrenaline trading junky. I only want to grow my entire portfolio 2-4% a month with a couple of conservative ETF trades. Earning a 22%-48% return on my capital every year without the stress of being caught up in this type of market, and knowing I have a proven bear market trading strategy incase this market continues to fall is a comforting thought.
As a technical analysis and trader since 1997, I have been through a few bull/bear market cycles. I believe I have a good pulse on the market and timing key turning points for short-term swing traders.
Visit my ETF Wealth Building Newsletter and if you like what I offer, and ride my coattails as I navigate these financial markets and build wealth while others lose nearly everything they own during the next financial crisis.
Coming up we have some important data that could influence the NZD. The more remarkable will probably be the release of last quarter’s GDP numbers.
At this point, many might have completely forgotten the more optimistic run-up to the end of year holidays and the potential of an end to the trade war.
Remember when the worst possible things for the markets were increases in tariffs?
Anyway, New Zealand reports its GDP relatively late into the next quarter. This means the data is rather old. However, it’s still an important guide for the NZD, and the kiwis are in a somewhat of a unique position economically.
While the rest of the world is under the dark cloud of the coronavirus pandemic, New Zealand to date has only had 8 cases. And their economy is well-positioned for a quick rebound.
No One is Completely Isolated
Of course, that’s not to say that New Zealand stocks haven’t been affected by the global pandemic fears. The country is not exempt from the tectonic shifts in the markets.
And, with most investors looking to hold liquidity, Kiwi stocks have been falling in line with the rest of the world. However, unlike in Europe, shops aren’t closing. Domestic transportation is not halting either, and more importantly, New Zealand’s main trade partner, China, is restarting after officially declaring the epidemic controlled.
There is an offset between when Chinese economic activity starts to increase – and presumably, it will take some time to return to prior levels – and demand for products from New Zealand will return to prior levels.
We shouldn’t forget that New Zealand relies heavily on Chinese tourism. And travel from the Asian Giant is still on hold.
Outlook for the Smaller Data
We can expect the first of the data later this evening, with the release of the GDT Price Index.
With the lockdown in Europe and expectations of increased travel halts in North America, demand for dairy has been on the wane. Therefore, expectations are for New Zealand’s chief export to diminish in price going forward. This could consequently cause a slight downward pressure on the currency.
The current account is likely to be overshadowed by currency flows related to general risk appetite in the market. The quarterly current account is generally the most negative in the final quarter of the year.
So, unless the figure substantially underperforms, it likely won’t be worth the market’s time. Additionally, the 75 basis point cut in the rate makes the current account situation rather moot during the easing cycle.
What We are Looking At
The data we want to keep an eye on is the quarterly GDP figure. That is usually the one that’s market-moving. And even with traders distracted by the global pandemic, it could still have an impact.
Expectations are for Q4 GDP to come in at 0.4%, a decrease in the speed of growth from 0.7% in the third quarter. Of course, the prior quarter was coming off of what was, up until that point, unprecedented monetary policy easing.
Projections indicate that the annual growth rate will increase to 2.5% from 2.3% prior. This would bring it back to the bottom of the growth rate range that New Zealand had been maintaining for several years.
In other circumstances, the RBNZ might have argued their policy was working. However, in practical terms, it might turn out to be a target for where investors hope the economy returns to after the COVID-19 situation is under control.
The last few days have been like nothing most of us have ever experienced – or are likely to experience again in our lifetimes.
Panic has spread from the streets of Wuhan to the grocery stores of America’s heartland, from nursing homes to the Federal Reserve Board, from the stock market to the gold and silver markets.
Like other asset classes, the precious metals space is being rocked by rapidly accelerating developments, some of which haven’t occurred for decades and some of which haven’t occurred ever.
These unprecedented times are testing the mettle of precious metals investors like never before.
Gold and silver are meant to provide safe haven from financial turmoil. Safe haven demand for physical bullion has indeed surged. The pace of buying has been so furious in recent days that some dealers are literally running out of product to sell, and the scarcity has driven premiums are sharply higher.
So why haven’t gold prices skyrocketed? For one thing, the bullion market is relatively small compared to the highly leveraged futures market that sets spot prices. Gold can get pulled down on any given day for no other reason than panicked traders need to sell it in order to raise cash.
When comparing gold to other assets, however, the monetary metal is performing exactly as it should during a time of crisis. Gold has risen strongly when measured against a crashing stock market over the past few weeks. It has spiked to multi-decade highs versus both crude oil and silver.
The gold:silver ratio has now entered previously uncharted territory. On Monday it spiked to 116:1. Put another way, a single ounce of gold could buy a staggering 116 ounces of silver.
Never has silver been as cheap to acquire in real terms as it is today. Never has the silver market traded so wildly disconnected from its fundamentals. Never have the silver bullion and silver futures markets diverged so greatly.
Whereas shortages and premium spikes are taking hold in American Eagles and other popular silver bullion products, the opposite is occurring on the exchanges. For example, one exchange-traded silver vehicle, Sprott Physical Silver Trust (PSLV), briefly traded down to a record 10% discount to its own net asset value.
On Monday, another inexplicable trading anomaly occurred. On a day when the general stock market suffered a 13% nosedive, the Silver Miners ETF (SIL) surged higher by 13% — and it’s surged again today. Yet spot silver prices had plunged by 12% at the same time.
If silver is down double digits and the equity market is also down double digits, how in the world do silver mining equities rise by double digits?
It makes no sense, unless the markets are completely broken and totally arbitrary at this point. Or unless big money counterintuitively flowed into the mining sector because the silver spot price has lost credibility.
Perhaps mining stock investors believe the actual physical silver market is already beginning to dictate higher prices (as reflected in surging premiums for silver coins) than what are being quoted in the paper market.
Perhaps we just witnessed a capitulation bottom in silver and at least a temporary peak in investor fear more broadly. The VIX volatility index, also known as the fear index for the stock market, spiked on Monday to exceed the fear levels registered during the depths of the financial crisis in 2008.
When markets are driven by extreme fear, they don’t produce rational outcomes.
Strange, anomalous, and unprecedented price action in certain assets creates once-in-a-lifetime opportunities to profit as investors calm down and come to their senses. For example, you may never again get an opportunity to buy silver at less than 1/100th of the quoted gold price.
Unfortunately, it’s difficult to obtain physical silver at all during moments like these. Bargain hunters have cleared out coin dealers of most of their inventories.
The upshot is that a new uptrend in silver, and a corresponding narrowing of the gold:silver ratio, can be expected to extend for years. You should have plenty of opportunities to buy on the way up before the metal becomes expensive.
There is no need to panic buy in fear of missing the bottom. We don’t know whether it will be a “V”-shaped bottom or one that drags out and gets re-tested again in the weeks ahead.
The current economic crisis is much broader in scope than previous crises centered on Wall Street and the banking system. The Fed can’t fix it by cutting rates to zero and pumping more doses of Quantitative Easing into the bond market.
This is a Main Street crisis triggered by an invisible killer that will claim many more victims. President Trump and his top medical advisors now fully expect the number of infections to grow and the strain on the medical system to get worse before it gets better.
Will the carnage on Wall Street and in metals markets get worse, too? Nobody knows for sure. Nobody could have foreseen that a black swan event like a global pandemic would trigger a near total shutdown of the economy.
What we do know is that every other panic selling event in recorded history has produced fantastic buying opportunities for investors who didn’t lose their shirts or their minds. This one will likely be no different.
The Money Metals News Service provides market news and crisp commentary for investors following the precious metals markets.
The current EURUSD structure suggests that we are near the end of a major upward impulse wave.
We see after completing the ascending cycle wave III, a decline in the correction IV initiated.
The correction wave IV structure could be a triple zigzag, consisting of primary sub-waves Ⓦ – Ⓧ-Ⓨ-Ⓧ-Ⓩ.
Wave Ⓩ, as the last part of the correction IV, is expected to be completed near 1.097 and could end in a standard zigzag pattern.
The target would respect the 78.6% Fibonacci retracement.
Looking at the structure closer provides an alternative scenario that might come into play. In this, the corrective wave IV could end earlier than expected in the main scenario.
This scenario looks at a weaker wave (C) in the zigzag Ⓩ, and also an identical low for Ⓩ and Ⓨ.
Since the impulse (C) is already under formation, we can expected the completion of this last wave near 1.1049.
Recent developments saw the Fed slashing rates further while pledging to increase its bond holdings by $700 billion.
The King Dollar fell at the start of the recent financial turmoil. After peaking up to just shy off the triple-digit mark, it nosedived to 95.30 in two weeks of trading.
It ended up forming a bottom and started a surge that turned into a massive rally since then.
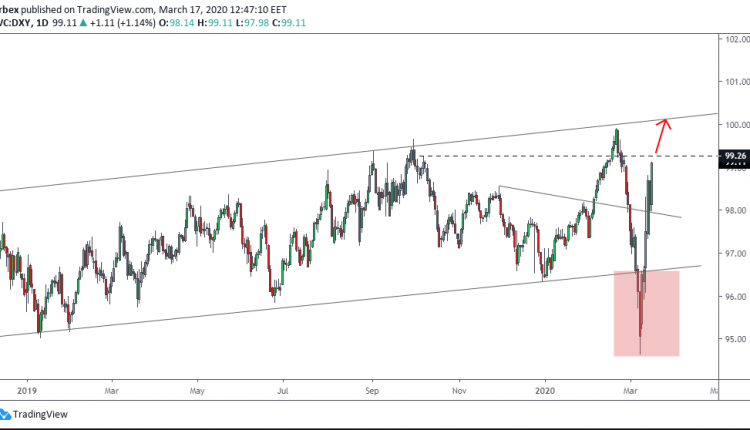
Technically, the above chart shows an ascending channel with the bottom residing on March 11 low of 96.60. The top extended slightly higher to the 100.00 round level.
We end up witnessing a false break under the base of the channel on the daily chart (see highlighted area); and we are tracking (96.60).
As seen on the 8H chart below, price managed to pull back furiously and headed the march higher.
With the daily close above the 98.00 handle, the index is poised to carry on towards the 100.00 mark and slightly higher.
The next resistance of importance comes at 99.25. A meaningful close above would place the 100.00 level mark at a striking distance.
Notice the trend line emphasizing the 99.25-30 region.
Everyone wanted a sweet piece of the Dollar today as panic surrounding the coronavirus outbreak boosted appetite for the world’s most liquid currency.
Stress in the markets for Dollar funding outside of the United States lifted the Dollar Index as money managers and businesses scrambled for a slice amid the darkening economic outlook. With the Greenback marching higher despite the Federal Reserve going all out on lowering interest rates, it is safe to say that bulls remain in the driving seat.
Looking at the technical picture, the Dollar Index is heavily bullish on the daily timeframe. A solid daily close above 99.80 should open the doors towards 100.00 before the end of Q1.
Pound drops like a stone……
Sterling tanked against a broadly stronger Dollar and weakened against most G10 currencies today.
The unsavoury mixture of coronavirus concerns and Brexit bruised buying sentiment towards the currency, resulting in the GBPUSD tumbling to levels not seen in six months below 1.2050. Focusing on the technical, prices are heavily bearish on the daily charts with the downside momentum opening a clean path towards 1.2000 in the short term.
S&P 500 attempts to nurse virus inflicted wounds
After experiencing a gut-wrenching selloff in the previous session, the S&P 500 is attmepting to nurse heavy wounds inflicted by recession fears and widening health crisis.
The Index remains heavily bearish on the daily charts with further losses on the cards as virus-related concerns intensify. Technical traders will continue to closely observe how prices behave around the 2500 level. Should prices fail to push back this level, the next key level of interest will be around 2350. If bulls are able to conquer 2500, the next key level of interest will be around 2650.
Is Oil heading towards $20?
It was another day but the same story with Oil which struggled to push back above $30 amid the coronavirus chaos.
There is a risk that demand-side fears and oversupply concerns drag Oil deeper into the abyss with $20 acting as the next major point of interest. Looking at the technical, bears still remain in control with sustained weakness below $30 opening the doors towards $25.
Currency spotlight – EURUSD
The Euro stood little chance against a resurgent Dollar today and this was reflected on the EURUSD which tumbled over 200 pips.
Technicals suggest that the trend is turning negative with bears eyeing 1.0933. A solid breakdown below this level should encourage a smooth decline towards 1.0879 and 1.0800.
Disclaimer: The content in this article comprises personal opinions and should not be construed as containing personal and/or other investment advice and/or an offer of and/or solicitation for any transactions in financial instruments and/or a guarantee and/or prediction of future performance. ForexTime (FXTM), its affiliates, agents, directors, officers or employees do not guarantee the accuracy, validity, timeliness or completeness, of any information or data made available and assume no liability as to any loss arising from any investment based on the same.
The common currency broke past the initial, steeper trend line. But it is finding support near the confluence of the major trend line and the horizontal support level. The price level near 1.1100 remains strong for the moment.As long as this holds, we could expect some upside in prices.
However, the upper resistance level near 1.1200 comes into question. Alternatively, a break down below 1.1100 and the trend line will trigger further declines. We expect the older support at 1.0958 to then come into the picture eventually.
GBPUSD Completes the Descending Triangle Pattern
GBPUSD fell to October 2019 lows near 1.2200. Price action is looking somewhat alive at this support. We expect that following the strong sell-off, the pound sterling will be retracing some of the losses.
But, for the near term, price action could remain range-bound. The upper price area at 1.2582 comes into the picture and GBPUSD could hold this corridor for the near term.
Is WTI Crude Oil Forming a Double Bottom?
Oil prices opened weaker on Monday and drifted to intraday lows near 28.44 before recovering slightly. Price action is likely to close with a double bottom forming near the March 9th close of 30.37.
If this is validated, then with the bullish divergence on the 4-hour chart, we anticipate a rebound. The unfilled gap near 41.73 becomes the immediate upside target.
Can XAUUSD Find Support at the 200-day MA?
The precious metal continued its descent, unmoved by the Fed’s actions over the weekend. Price fell to fresh lows of 1451.07 intraday before pulling back. This also coincides with the 200-day moving average which hasn’t been tested since May 2019. If moving average support along with the horizontal support at 1462 holds, we can expect some rebound. The main upside resistance is seen at 1534, followed by 1569.
 Current situation: