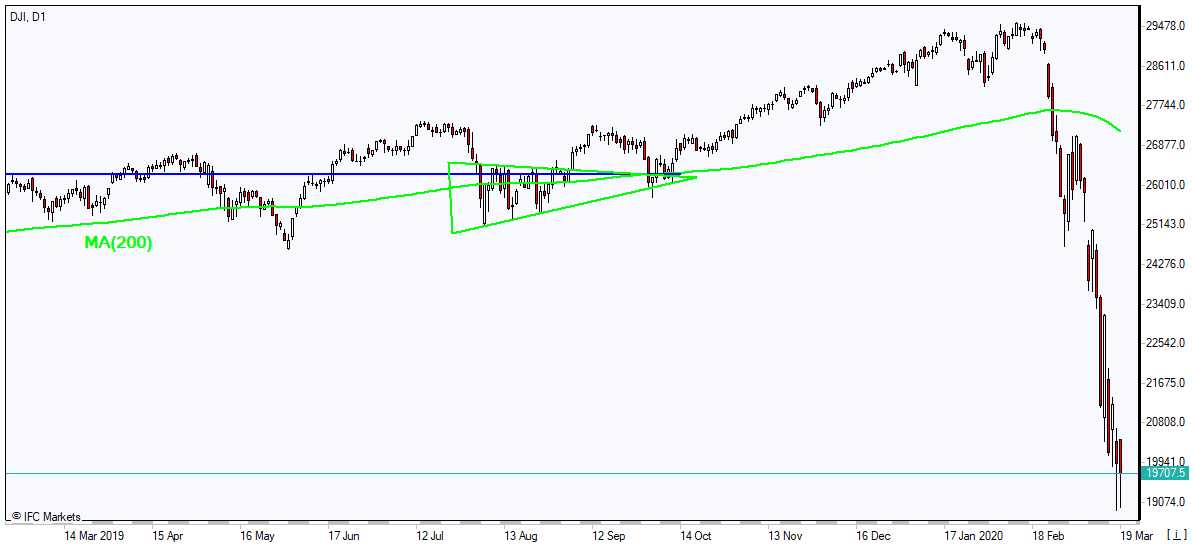
Dow erases virtually all gains since President Trump’s 2017 inauguration
US stock market erased previous session gains on Wednesday despite Congress passing the first of two planned bills providing financial aid to businesses suffering economic damage from the coronavirus pandemic, while Federal Reserve promised a liquidity program for money market mutual funds. Investors weren’t impressed by the European Central Bank announcement of new program to buy bonds worth 1.1 trillion euros throughout this year. The S&P 500 fell 5.2% to 2398.10. The Dow Jones industrial average plummeted 6.3% to 19898.92. Nasdaq slumped 4.7% to 6989.84. The dollar strengthening slowed as the consumer inflation annual rate slipped to 2.3% from 2.5% in January. The live dollar index data show the ICE US Dollar index, a measure of the dollar’s strength against a basket of six rival currencies, rose 1.3% to 100.72 and is higher currently.
CAC 40 led European indexes retreat
European stocks also pulled back on Wednesday erasing previous session gains. The European Central Bank launched new bond purchases planning to buy 1.1 trillion euros worth of bonds worth 6% of the euro area’s GDP. The EUR/USD slowed its decline yesterday while GBP/USD accelerated, with both pairs lower currently. Pound lost 3.6% hitting its lowest point since October 2016. The Stoxx Europe 600 ended down 4% led by energy shares. Germany’s DAX 30 lost 5.6% to 8441.71. France’s CAC 40 plunged 5.9% while UK’s FTSE 100 fell 4.1% to 5080.58 despite government’s pledge of nearly $400 billion aid to help businesses through the crisis.
Australia’s All Ordinaries Index leads Asian indexes slump
Asian stock indices are again on defensive after sharp losses on Wall Street overnight. Nikkei retreated 1.1% to 16546.50 despite continuing yen slide against the dollar. Markets in China are falling: Shanghai Composite Index is 1% lower while Hong Kong’s Hang Seng Index is down 2.4%. Australia’s All Ordinaries Index tumbled 3.4% despite Australian dollar’s continuing slide against the greenback as the Reserve Bank of Australia cut interest rates a quarter percentage point to 0.25%.
Brent futures prices are extending losses today. Prices fell yesterday as the Energy Information Administration reported US crude oil inventories rose by 2 million barrels last week, eighth weekly rise in a row: May Brent fell 13% to $24.88 on Wednesday.
Gold edges up
Gold prices are advancing today after a retreat on Wednesday. April gold price of an ounce of gold fell 3.1% to $1477.90 on Wednesday.
Note: This overview has an informative and tutorial character and is published for free. All the data, included in the overview, are received from public sources, recognized as more or less reliable. Moreover, there is no guarantee that the indicated information is full and precise. Overviews are not updated. The whole information in each overview, including opinion, indicators, charts and anything else, is provided only for familiarization purposes and is not financial advice or а recommendation. The whole text and its any part, as well as the charts cannot be considered as an offer to make a deal with any asset. IFC Markets and its employees under any circumstances are not liable for any action taken by someone else during or after reading the overview.
Crude oil took a 30% dive on Sunday, March 8. Yet what’s happened in oil this year is so much bigger than that headline-grabbing, one-day move. In January, oil was $64 a barrel. It hit $27.34 intraday on Monday, March 9, so the price of oil fell 57% in just two months. Talk about a swift decline.
If you turn on your favorite financial news network, the odds are good that you’ll find a pundit speculating about what this move down in oil means for stocks. To help us answer that question, let’s go back to 1973. Economists will tell you that the 1973-74 bear market was due to the infamous OPEC oil embargo. The embargo is a real thing that happened from October 1973 to March 1974, and it’s true that oil prices quadrupled over that time. But the stock market topped in January 1973. Stock prices had been falling for nine months before the embargo began, so the embargo cannot have caused the bear market in stocks. Plus, stocks continued to fall for nine months after the embargo was lifted, further destroying the embargo-caused-the-crash argument.
Although the data don’t support economists’ argument, let’s consider the logic that underlies their argument for a moment. The embargo resulted in oil shortages and pinched household and corporate budgets, ostensibly exacerbating the bear market and pushing the economy into a recession. But if drastically rising oil prices are bad for stocks and the economy, then logic demands falling oil prices must be good for stocks and the economy. Yet oil collapsed 78% in 2008 during the worst of the bear market in stocks. And the recent price slide in oil has overlapped a global selloff in stocks.
So what’s going on? The truth is that the correlation between stocks and oil swings willy nilly from positive to negative throughout history, as you can see on the chart. Pundits will try to use one market to predict the other, but the reality is that there’s no reliable relationship between the two at all. To understand each market, you have to look at each market’s Elliott waves.
Discover how Elliott waves can help you catch moves in the oil market when you watch a special video from EWI’s chief energy analyst, Steve Craig, available to ClubEWI members. Sign up for FREE and watch instantly.
Shares of Regeneron Pharmaceuticals rose to a new 52-week high price after the company reported it has identified hundreds of virus-neutralizing antibodies and plans to initiate large-scale manufacturing by mid-April of a multi-antibody therapy to treat coronavirus.
Regeneron Pharmaceuticals Inc. (REGN:NASDAQ) today announced “the latest progress in its efforts to discover and develop a novel multi-antibody cocktail that can be administered as prophylaxis before exposure to the SARS-CoV-2 virus or as treatment for those already infected.”
The company reported that its scientists have isolated hundreds of virus-neutralizing, fully human antibodies from the firms genetically-modified VelocImmune® mice which have immune systems similar to humans. In addition, the firm advised that it has isolated antibodies from humans who have recovered from COVID-19 to aid in maximizing the pool of potential antibodies. The company indicated that it will select the top two candidate antibodies for a cocktail-like treatment based on potency and binding properties to the SARS-CoV-2 spike protein as well as other specified characteristics.
The firm indicated that it will employ its VelociMab® technology to prepare manufacturing-ready cell lines as soon as lead antibodies are identified in order to rapidly ramp up clinical-scale production. The company expects that it will be able to manufacture hundreds of thousands of prophylactic doses per month by the end of summer.
The company’s Co-founder, President and Chief Scientific Officer George D. Yancopoulos, M.D., Ph.D., commented, “Our three decades of investment in our VelociSuite antibody technologies, which accelerate and improve the traditional drug discovery process, have hopefully prepared us for this critical time and to meet this important challenge…Given the tremendous interest and concern around the COVID-19 pandemic, we will be providing regular and transparent updates on our discovery and development programs.”
The company noted that “all coronaviruses have a single glycoprotein on the virus surface called the spike protein, which is the protein on the virus cell surface that binds to the host cell and is required for infectivity and its SARS-CoV-2 antibodies will target the spike protein in order to block its interaction with the host cell, and thus neutralize the virus.”
Christos Kyratsous, Ph.D., vice president of research, infectious diseases and viral vector technologies at Regeneron, added, “I’m so proud to be part of this cross-company team, which delivered a novel and effective fully human antibody treatment for Ebola in record time and is making every effort to once again rise to this unprecedented challenge.”
Regeneron Pharmaceuticals describes itself as a leading biotechnology company that invents life-transforming medicines for people with serious diseases. The company has seven FDA-approved homegrown treatments and numerous product candidates in development. The firm states that its medicines and pipeline are designed to help patients with eye disease, allergic and inflammatory diseases, cancer, cardiovascular and metabolic diseases, infectious diseases, pain and rare diseases.
Regeneron has a market capitalization of around $48.5 billion with approximately 110 million shares outstanding. REGN shares opened higher today at $452.51 (+$11.68, +2.65%) over yesterday’s $440.83 closing price and reached a new 52-week high price this morning of $512.98. The stock has traded today between $473.00 and $512.98 per share and is currently trading at $491.32 (+$50.49, +11.45%).
Disclosure: 1) Stephen Hytha compiled this article for Streetwise Reports LLC and provides services to Streetwise Reports as an independent contractor. He or members of his household own securities of the following companies mentioned in the article: None. He or members of his household are paid by the following companies mentioned in this article: None. 2) The following companies mentioned in this article are billboard sponsors of Streetwise Reports: None. Click here for important disclosures about sponsor fees. 3) Comments and opinions expressed are those of the specific experts and not of Streetwise Reports or its officers. The information provided above is for informational purposes only and is not a recommendation to buy or sell any security. 4) The article does not constitute investment advice. Each reader is encouraged to consult with his or her individual financial professional and any action a reader takes as a result of information presented here is his or her own responsibility. By opening this page, each reader accepts and agrees to Streetwise Reports’ terms of use and full legal disclaimer. This article is not a solicitation for investment. Streetwise Reports does not render general or specific investment advice and the information on Streetwise Reports should not be considered a recommendation to buy or sell any security. Streetwise Reports does not endorse or recommend the business, products, services or securities of any company mentioned on Streetwise Reports. 5) From time to time, Streetwise Reports LLC and its directors, officers, employees or members of their families, as well as persons interviewed for articles and interviews on the site, may have a long or short position in securities mentioned. Directors, officers, employees or members of their immediate families are prohibited from making purchases and/or sales of those securities in the open market or otherwise from the time of the interview or the decision to write an article until three business days after the publication of the interview or article. The foregoing prohibition does not apply to articles that in substance only restate previously published company releases. 6) This article does not constitute medical advice. Officers, employees and contributors to Streetwise Reports are not licensed medical professionals. Readers should always contact their healthcare professionals for medical advice.
Rather than focusing on individual companies, money manager Adrian Day turns his attention to the overall markets, noting “recent events are unusual, and demand some commentary.”
As everyone knows, these past couple of weeks have seen the markets on a wild ride, based on concerns about the coronavirus, culminating in the sharpest declines in most markets since 2008, and many for much longer. By Friday, no market or sector had escaped the slaughter. The S&P lost a quarter of its value over the past four weeks before Friday’s rally. Most European markets are down over 30% this year. The Brazilian market lost almost 25% of its value on just Wednesday and Thursday. Gold stocks fell 26% over the last three days. And so on.
It was a bubble in search of a pin
We have few stocks in global markets on our list. Needless to say, we were not preparing for a coronavirus to wreak havoc on global markets. But as Peter Schiff reminds us, it’s the bubble, not the pin, that’s important. Looking at any specific stock we still hold, rather than how few we hold in global markets, is missing the forest for the trees.
Gold is a different matter. We have many gold and precious metals stocks on our list and had in recent months added more. This emphasis on gold was based primarily on global monetary policy. Nothing has changed there, at least nothing to change our mind about gold being the asset of choice. As goldand gold stocksmoved up even sharper as corona took hold, we continued to hold. Gold stocks finally fell when both the broad stock market and gold fell. Gold stocks are stocks, after all, and fell with the broad market.
What is outlook for economy?
What now? We are not public health experts and lay no claim for our prognosis on likely extent of epidemic before it’s over. We can say, however, that the epidemicand more, the response to itis engendering fear, and is having and will have a devastating impact on global trade and the global economy. I am not suggesting that the epidemic is no more than a media-induced panic. Rather, the responseright or wrong, justified or not, necessary or otherwiseis the main causes of public concern. Global trade, and with it the global supply chain, has been hurt, and the impact will show up a month or two from now. A sharp economic downturn is likely, even if a short one (and we don’t know that yet). After it’s all overand they won’t ring the bells to indicate the end some sectors may see a rapid catch up from pent-up demand, some industries will take a while to recover, and some business simply will not survive.
The worst decision an investor can make now
It is too late to be sellingand certainly the very worst decision an investor can make is to liquidate in the midst of a liquidity-driven selloff. But it is too soon for aggressive, broad buying. Stock market prices do not yet reflect the worse scenario. The S&P is trading at 18 times earnings, and yielding only just a tad over 2% after the declines, hardly bargain levels. It is trading more or less where it was just a year ago. In general, rallies are to be sold rather than declines to be bought. Of course, we are looking at certain sectors and markets for extreme oversold situations, and will make recommendations. See our list of “top buys” at the end of this letter.
Among non-resources, the business development companies appear a good hunting ground, with yields over 10% and as high as 12.5%, dividends fully covered by income, and (as in the case of Ares Capital Corp. (ARCC:NASDAQ)) some companies with a large backlog of income still to be distributed. These stocks are trading at price-to-book values of 7085%. We could see some loans default and the stocks would still represent good value.
Gold and gold stocks are likely to recovery first
Gold is a different story. Gold was sold because it was a source of liquidity in a liquidity-deprived panic. The gold stocks fell as both gold and the broad stock market fell. (It is also true in the gold market that the worst possible decision is to liquidate in the middle of a liquidity-driven panic.)
If previous liquidity panics are any guide2008, 2001, 1999, 1987gold will recover very soon as the worst of the forced liquidation passes, and the gold stocks will be the first sector to recover. It may take a week or two, or more likely a month or two; gold stocks fell with the broad market into the October 2008 lows, and then started to recover. By the time the broad market had bottomed, not until March 2009, the gold stocks had more than doubled, far more. Within a year, the gold stocks were back at all-time highs.
So, it is too late to sell gold stocks as well. When they do bottom, not only will they likely be the first to move, but in the past have moved very fast off the bottom.
The new bull market in gold started well before 2020, certainly the middle of 2018, if not the end of 2015. Taking this longer view, only the run up in last several weeks has been caused by coronavirus, meaning even if that stopped in its tracks and gold gave back all its “corona gains,” it would still be in a bull market. Gold is reacting to monetary policy, stock market volatility and geopolitical concerns. The coronavirus is only one more factor.
The gold stocks are very undervalued
The gold stocks are undervalued right now. The producers are very cheap. Right now they have the benefit of higher gold prices, and lower oil prices as well as generally lower commodity currency prices (Canadian and Australian dollars, the Brazilian real and so on), making costs lower even as gold moves up. Most of them have better balance sheets now than they did few years ago. The exploration stocks are also very cheap, but they need to be cashed up. It is difficult to raise money at a reasonable level now. In addition, the producers will tend to recover before the exploration companies do.
The panic can last a while, particularly if we see further developments with the coronavirus. But, given that the gold stocks can move more rapidly when they turn, I see this as a time to get into the market and pick up some great buys, but to do so cautiously and methodically. I certainly would not be selling, aiminghoping?to buy back cheaper. You do not want to wait until it is clear the market has turned before buying.
So, this is a good time to be picking up the very best companies, and at the best prices, as they become available. In some cases, you can double up, which will provide us with the opportunity to trim as prices recover and still maintain positions.
Keep calm and carry on
In short, this is not a time to panic, not time never is to be reactive. It is too late for broad, aggressive selling, even though rallies can be sold. If it is too soon for broad aggressive buying, the best gold stocks and a few other oversold stocks can be bought.
You may be interested in some of my recent interviews for further thoughts on how I see the markets are this time. All of these were conducted at the PDAC conference in Toronto, from March 2 to March 4; that is, before the devastation of last week. But the interviews provide an idea of my general thinking on markets. There is a focus on gold because this was a gold conference.
Adrian Day, London-born and a graduate of the London School of Economics, heads the money management firm Adrian Day Asset Management, where he manages discretionary accounts in both global and resource areas. Day is also sub-adviser to the EuroPacific Gold Fund (EPGFX). His latest book is “Investing in Resources: How to Profit from the Outsized Potential and Avoid the Risks.”
Disclosure: 1) Adrian Day: I, or members of my immediate household or family, own securities of the following companies mentioned in this article: Franco-Nevada, Evrim, Osisko Gold Royalties, Midland Exploration, Lara Exploration, Altius Minerals and Gladstone Investments. I personally am, or members of my immediate household or family are, paid by the following companies mentioned in this article: None. My company has a financial relationship with the following companies mentioned in this article: None. Funds controlled by Adrian Day Asset Management hold shares of the following companies mentioned in this article: All. I determined which companies would be included in this article based on my research and understanding of the sector. 2) The following companies mentioned in this article are billboard sponsors of Streetwise Reports: None. Click here for important disclosures about sponsor fees. The information provided above is for informational purposes only and is not a recommendation to buy or sell any security. 3) Statements and opinions expressed are the opinions of the author and not of Streetwise Reports or its officers. The author is wholly responsible for the validity of the statements. The author was not paid by Streetwise Reports for this article. Streetwise Reports was not paid by the author to publish or syndicate this article. Streetwise Reports requires contributing authors to disclose any shareholdings in, or economic relationships with, companies that they write about. Streetwise Reports relies upon the authors to accurately provide this information and Streetwise Reports has no means of verifying its accuracy. 4) This article does not constitute investment advice. Each reader is encouraged to consult with his or her individual financial professional and any action a reader takes as a result of information presented here is his or her own responsibility. By opening this page, each reader accepts and agrees to Streetwise Reports’ terms of use and full legal disclaimer. This article is not a solicitation for investment. Streetwise Reports does not render general or specific investment advice and the information on Streetwise Reports should not be considered a recommendation to buy or sell any security. Streetwise Reports does not endorse or recommend the business, products, services or securities of any company mentioned on Streetwise Reports. 5) From time to time, Streetwise Reports and its directors, officers, employees or members of their families, as well as persons interviewed for articles and interviews on the site, may have a long or short position in securities mentioned. Directors, officers, employees or members of their immediate families are prohibited from making purchases and/or sales of those securities in the open market or otherwise from the time of the interview or the decision to write an article until three business days after the publication of the interview or article. The foregoing prohibition does not apply to articles that in substance only restate previously published company releases. As of the date of this article, officers and/or employees of Streetwise Reports LLC (including members of their household) own securities of Franco-Nevada, Evrim Resources, Osisko Gold Royalties, Midland Exploration, Lara Exploration and Altius Minerals, companies mentioned in this article.
Shares of Alamos Gold traded 15% higher after the firm reported that it has repurchased a 3% net smelter return royalty on its Island Gold mine located in northern Ontario.
Intermediate gold producer Alamos Gold Inc. (AGI:TSX; AGI:NYSE) today announced that “it has entered into an agreement to acquire and cancel a 3% net smelter return royalty payable on production from the Island Gold mine for total cash consideration of $54 million (CA$75 million).”
The company indicated that “the royalty was acquired from a privately held company and is payable on gold production within four patented claims that comprise the majority of currently defined Mineral Reserves and Resources within the Island Gold deposit.” The firm advised that acquiring and eliminating the royalty will immediately reduce operating costs, increase operating cash flow and provide increased exposure to significant exploration potential at the Island Gold mining project.
The firm indicated that “as of December 31, 2019, the claims subject to the royalty contained 0.9 Moz of Mineral Reserves, representing 71% of Island Gold’s total Mineral Reserves and 1.1 Moz of Inferred Mineral Resources.”
Due to the elimination of the royalty payment, the firm now expects a “$40 per ounce, or 7%, decrease in Island Gold’s 2020 total cash cost guidance to between $480 and $520 per ounce and $40 per ounce decrease in mine-site all-in sustaining cost guidance to between $740 and $780 per ounce”.
The company’s President and CEO John A. McCluskey commented, “The acquisition of the royalty further reduces costs at what is already a low-cost operation while also increasing our exposure to the tremendous exploration upside. Since we acquired Island Gold in 2017, the Mineral Reserve and Resource base has doubled with the deposit approaching four million ounces across all categories. With the deposit open laterally and down-plunge across several areas of focus, we see excellent potential for this growth to continue at a greatly reduced royalty on future production.”
Alamos is headquartered in Toronto, Ontario, and is an intermediate gold producer with diversified production from three North America operating mines. The company’s mining projects includes the Young-Davidson and Island Gold mines in northern Ontario and the Mulatos mine in Mexico. The firm employs greater than 1,700 people at all of its combined locations.
Alamos Gold has a market capitalization of around $1.5 billion with approximately 391.1 million shares outstanding. AGI shares opened at $3.41 (-$0.465, -12.00%) over Friday’s closing price of $3.875. The stock has traded today between $3.34 and $4.94 per share and is currently trading at $4.57 (+$0.68, +17.48%).
Disclosure: 1) Stephen Hytha compiled this article for Streetwise Reports LLC and provides services to Streetwise Reports as an independent contractor. He or members of his household own securities of the following companies mentioned in the article: None. He or members of his household are paid by the following companies mentioned in this article: None. 2) The following companies mentioned in this article are billboard sponsors of Streetwise Reports: None. Click here for important disclosures about sponsor fees. 3) Comments and opinions expressed are those of the specific experts and not of Streetwise Reports or its officers. The information provided above is for informational purposes only and is not a recommendation to buy or sell any security. 4) The article does not constitute investment advice. Each reader is encouraged to consult with his or her individual financial professional and any action a reader takes as a result of information presented here is his or her own responsibility. By opening this page, each reader accepts and agrees to Streetwise Reports’ terms of use and full legal disclaimer. This article is not a solicitation for investment. Streetwise Reports does not render general or specific investment advice and the information on Streetwise Reports should not be considered a recommendation to buy or sell any security. Streetwise Reports does not endorse or recommend the business, products, services or securities of any company mentioned on Streetwise Reports. 5) From time to time, Streetwise Reports LLC and its directors, officers, employees or members of their families, as well as persons interviewed for articles and interviews on the site, may have a long or short position in securities mentioned. Directors, officers, employees or members of their immediate families are prohibited from making purchases and/or sales of those securities in the open market or otherwise from the time of the interview or the decision to write an article until three business days after the publication of the interview or article. The foregoing prohibition does not apply to articles that in substance only restate previously published company releases.
SNB governing board member Andrea Maechler has stated that the bank is keeping a close eye on the current economic situation, and, that if deemed necessary, the bank will act accordingly.
Their willingness to take action depends on how the current crisis pans out. Will it be short-lived or spiral out of control?
In normal times, we wouldn’t even make a calculated assessment on whether the SNB would opt-in for a rate cut. But times right now are the farthest thing from normal there is.
Central Banks Pledge
Central banks around the world have proceeded with aggressive interest rate cuts this week.
The trend started with the Fed, which cut rates twice in less than 2 weeks by a total of 100 basis points. It then continued with other major central banks, including the RBNZ, RBA, and BOE.
So, will the SNB do their bit and announce an interest rate cut? Let’s turn the clock back a little.
Will They Cut?
The SNB has kept its interest rates at a record low of a negative 0.75% since 2015. Thus, they are reluctant to cut any further.
The SNB’s reluctance to cut is perhaps a little bolstered by the ECB’s action.
ECB president Lagarde was expected to follow on the pledge and cut interest rates by a minimum of 10 basis points, but she failed to deliver.
Therefore, the SNB is likely to follow the ECB’s lead and shy away from slashing interest rates. Swiss banks are already under pressure and any further burden would cause serious problems. Not to mention this could lead to serious cash hoarding.
The Swiss banks want the currency to weaken to make exports more lucrative. However, their attempts have yielded little to no response. They are forced to keep FX intervention on to keep euro-dominated assets in check.
Weakening their currency by keeping rates at ultra-low levels hasn’t truly worked either since 2015. The Swiss franc continued on with safe-haven flows.
This suggests that they are more interested in increasing the stimulus package than in cutting rates.
Lower Rates vs Stimulus
While monetary policy can’t really fight against a pandemic, these policies, if properly structured and deployed, can bring some kind of normalcy to business sentiment.
With the SNB looking for signals at the ECB for policy changes, they are most likely going to increase the stimulus package and FX intervention rather than cut.
This, however, could start a new feud with the US, as SNB is already on the watch list of currency manipulators.
By TheTechnicalTraders – Recently, I was asked to participate in a live radio talk with Arnold Gay and Yasmin Wonkers at Money 89.3 Asia First and was sent the following questions to prepare for the show. I thought this would be a great way to share my thoughts and expectations related to the Covid-19 virus, global economics and what the Central Banks are doing to combat this virus economic event.
The reality is that the bottom in the markets won’t set up until fear subsides and the unknowns related to this virus event are behind us. Until then, the global markets will attempt to seek out the true valuation levels based on this fear and the unknowns. This means true valuation could be much further away from current price levels as the virus event is still very fluid in nature.
I’ve included a few of our custom index charts to highlight exactly where the markets are currently situated and have attempted to explain my thinking related to these charts. Please continue reading.
First, be sure to opt-in to our free market trend signals before closing this page, so you don’t miss our next special report!
Custom Smart Cash Index Weekly Chart
This first chart is our Custom Smart Cash Index Weekly Chart. We had been expecting a breakdown in the US stock market last August/September 2019 (near the origination point of the line on the RSI pane) as our Super-Cycle system indicated a major breakdown was likely near the end of 2019 and into early 2020.
As the US Fed started pumping credit into the Repo market and the US/China trade deal settled over many months, a zombie-like price rally pushed prices higher through December 2019 and into early 2020. We alerted our members that this was likely a blow-off rally and to prepare for greater risks.
You can see how dramatic the change in trend actually is on this chart. We have broken the upward sloping price channel and moved all the way to the lower range of the GREEN downward sloping price channel. This is HUGE. Near these levels, we believe the US stock market will attempt to find support while continuing to rotate and setup additional “waterfall downside price events”. These custom indexes help us to understand the “hidden side” of the market price action.
This next Weekly chart is the Custom US Stock Market Index and we want you to pay very close attention to the fact that the recent lows have come all the way down to reach the upper range of the 2016 trading range. Once the 2018 lows were breached, we knew the markets were setting up for a deeper downside price move.
We do believe this current level is likely to prompt some type of “Dead Cat Bounce” or moderate support though. The entire range of 2016 (low, midpoint and high) are very much in play right now as these represent the current support levels for the US stock market. We do believe some moderate support will be found near these levels – yet we have to wait for the price to confirm this bottom setup.
This is our Weekly Custom Volatility Index and the extremely low price level on this chart suggests the US stock market may attempt to try to find moderate support soon. We have not seen levels this low since 2009. If the markets continue to push lower, this Custom Index will continue to stay below 6.0 as the price continues to decline. Yet, we believe this extremely low price level may set up a bit of support near recent lows (within the 2016 range) and may set up a sideways FLAG formation before the next downside price leg.
Please continue reading the questions (below) and answers/thoughts to those questions (below the questions). We certainly hope this information helps you to understand and prepare for the next 6 to 12+ months as we believe the volatility and unknowns will persist for at least another 4 to 6+ months. But keep in mind the market dynamics change on a daily and weekly basis and if you want to safely navigate them and have a profitable year follow my analysis and ETF trades here
Questions:
1. Rates at zero, massive injections and coordinated central bank action… why isn’t the market convinced the situation is under control?
2. What are investors looking for now – A peak in coronavirus infection rates? A sense that a proper healthcare response is in place and won’t be overwhelmed?
3. The main issue seems to be that this is not a slowdown, but the sudden closure of economic activity, do you see massive fiscal support coming, including bailouts for sectors like airlines?
4. Do you get a sense that the White House finally gets it, and is now moving to reassure markets and ordinary Americans?
Answers/Thoughts:
The markets are not reacting to what the global central banks are doing right now and probably won’t react positively until two things happen: fear of the unknown subsides across the globe and the total scope of the global economic destruction is assessed (think of this as TRUE PRICE VALUATION). Right now, we are in the midst of a self-actuating supply and demand-side economic contraction that will result in a renewed valuation level as markets digest the ongoing efforts to contain/stop this virus. Where is the bottom, I have an idea of where the bottom might setup – but the price will be what dictates if that becomes true.
If 2018 lows fail to hold as a support level, then we are very likely going to attempt to reach the 2016 trading range and I believe the midpoint and low price range of 2016 are excellent support levels for the market. I show the SP500, Nasdaq and Dow Jones index analysis and prediction in this video below.
What we are looking for in terms of closure of this event (or at least a pathway out of it) is some type of established containment of the event, the spread of the infections and the ability for governments and economies to begin to advance forward again. As long as we are stuck in reverse and do not have any real control of the forward objective (meaning consumers, corporations and governments are reacting to this event), then we will have no opportunity to properly estimate forward expectations and advancement in local and global economies – and that is the real problem.
The White House and most governments get it and are not missing any data with regards to this virus event. I truly believe that once this virus event ends and the general population gets back to “business as normal”, the world’s economy will, fairly quickly, return to some form of normal – with advancing expectations, new technology and continued global economic and banking functions. Until that happens, which is the effective containment and control of this virus event, then no amount of money or speech writing is going to change anything.
Far too many people are acting emotionally and afraid right now. The facts are simple; until we get a proper handle on this virus event, there will continue to be extended threats to our economy, people, families and almost every aspect of our infrastructure, banking, society and more. Once the virus event is mostly contained and settled, then we can get back to business cleaning up this mess and finding our way forward.
I’m not worried too much, my research team and I advised our clients to move into bonds and cash before the drop in equities and have been warning our members of a “zombie-rally) for the past 5+ months which took place as expected. We called for a “volatile 2020 with a very strong potential for a breakdown in global markets” near August 2019. This is playing out almost exactly like we expected (except we had no idea a virus event would be the cause).
I firmly believe the global leaders and dozens of technology firms will have a vaccine and new medical advancements to address the Covid-19 virus. I believe this event will be mostly behind us in about 90+ days. What happens at that point is still unknown, but I believe we will be able to see a pathway forward and I believe all nations will work together to strengthen our future.
In closing, I urge everyone to try to relax a bit and understand this is a broad (global) market event with a bunch of unknowns. It is not like the Fed can just throw money at this problem and make it go away. This is going to be a process where multiple nations and various industries and groups of people will have to work together to reduce and eliminate this threat. Because of that, there are no real clear answers right now – other than to be prepared for a few months of quarantine to be safe.
As a technical analysis and trader since 1997, I have been through a few bull/bear market cycles. I believe I have a good pulse on the market and timing key turning points for short-term swing traders.
Visit my ETF Wealth Building Newsletter and if you like what I offer, and ride my coattails as I navigate these financial markets and build wealth while others lose nearly everything they own during the next financial crisis.
Australia hasn’t been immune to the wide swings in the market lately, largely due to liquidity fears.
Even countries like Australia who have not taken major economy-altering measures to combat the pandemic are seeing significant drops in capital markets.
While fundamentals might be looking up due to the restart of the Chinese economy, the issue of a looming credit crunch is weighing on markets. That’s why Australian jobs numbers are even more important than before.
The fate of the AUD is closely linked with what the RBA does next. Especially since the bank was already paying close attention to the jobs data before the current turmoil anyway!
The logic was that the economy needed to maintain near structural full employment in order to support inflation. Hence, the RBA’s policy is geared towards supporting job growth.
Things Change
Liquidity is drying up as the markets are plunging due to economic uncertainty. Meanwhile, the RBA has been pumping cash into the market, buying up assets.
The bank has not declared its actions as quantitative easing. However, nearly quintupling normal asset purchases is the textbook definition of QE.
The issue is that the RBA has not set out a defined policy and easing regime. So, while its actions are having the effect of increasing available funds for the market, there is no certainty that it will continue. This leaves investors wondering how much support they can expect.
A majority of economists in Australia are predicting that the RBA will cut rates before their next meeting. Not only as a response to the economic situation but also because most other major central banks have done so.
This would put the reference rate at the bottom of the policy range, at which Lowe has repeatedly said that non-traditional measures would come into play.
Importantly, Lowe will be giving a speech tomorrow. So we expect people will pay extra attention to any hints about what the bank might do.
Especially Relevant Now
Jobs data is extra relevant now because Australian banks are heavily invested in the real estate sector. This had seen consistently climbing prices thanks, in part, to investment from China.
However, the housing market already took a turn for the worst last year. And, with the potential of Australians losing jobs as an effect of the COVID-19 outbreak, those mortgages could come under increased pressure.
We should look out for the RBA taking a keen interest in supporting maintaining jobs, and the government as well.
What About the Data?
The consensus is that Australia added 11.6K jobs last month, a further decrease from the 13.5K in January. Job losses typically lag behind the economic situation. So, it might be that the full effect of the drop in demand from China during the virus outbreak isn’t fully reflected in the figures.
Even so, the projection is for the lower end of the “normal” range that labor creation has been maintaining for years.
Expectations are for unemployment to tick down to 5.2% from 5.3%, at least remaining consistent with the trend. Even a slight improvement in jobs figures might not be enough to calm the markets. This is because we expect more layoffs in March.
Pension funds were already in a highly precarious position before the DJIA’s February 12 high and the subsequent start of the high drama in stock moves.
The 2018 edition of Robert Prechter’s Conquer the Crash noted:
The bull market in stocks has gone on so long that pension funds, formerly boasting conservative portfolios, have embraced stocks as a safe investment. … This is a setup for disaster.
Fast forward to Nov. 5, 2019 when the Wall Street Journal said:
Public Pension Plans Continue to Shift Into U.S. Stocks
Discussing the same theme, our January 2020 Elliott Wave Financial Forecast showed this chart and said:
At the end of the third quarter, alternative investments such as private equity and who-knows-what made up 5.6% of [U.S.] public pension fund portfolios, a new record. At 47.3% in 2019, equities exceed the allocation at the stock market peak of 2007. ” … As in 2008, pension funds are doubling down. Once again, the strategy will prove a miserable failure.
Yes, deficit-plagued pension funds were nearly half invested in stocks — just when the main indexes started to plunge a few weeks ago.
On March 9, the Guardian, a British newspaper, put a positive spin on pensions and the market’s rapid downturn:
How badly has my pension been hit?
It’s bad, but not as grim as the headline falls in the FTSE or Dow suggest. As a rule of thumb, for every 10% fall in the FTSE, the value of your pension investments falls by about 5% to 6%.
Well, whether one chooses to call it “bad” or “grim,” one thing’s for sure: the British and U.S. stock markets have fallen even more since that article published.
Many observers believe the coronavirus “triggered” the big plunge in stock values. However, you may be interested in knowing that the Elliott wave model pointed to a big decline in the equity market well before the coronavirus became widespread frontpage news.
As example, our January 2020 Elliott Wave Financial Forecast (published Jan. 10) said:
The new year has coincided with new highs in the Dow Jones Industrial Average, but key pieces of evidence indicate that the rally is at or very near an end. … Now is the time to be prepared for a change of trend, which very few investors are currently anticipating.
Indeed, that “change of trend” did occur.
Now is the time to find out what EWI’s analysts anticipate for the stock market in the weeks ahead.
Elliott Wave International has been guiding investors through bull and bear markets since 1979. From that long experience, we know that at certain market junctures, we can help the most by giving everyone our latest analysis free.
Now is one of those market junctures.
Elliott Wave International has just made the entire “Stocks” section of our flagship market letter, the monthly Elliott Wave Financial Forecast, available to all Club EWI members, free. Your membership in Club EWI is also free.
It’s a rare opportunity to see what EWI’s subscribers are reading.
The current GBPUSD structure hints at a bearish zigzag consisting of primary waves Ⓐ-Ⓑ-Ⓒ.
The first two waves of the structure are fully completed: wave Ⓐ- formed a 5-wave impulse, wave Ⓑ has taken the form of a triangle, wave Ⓒ is still under development and expected to have to maintain wave Ⓐ- ‘s pattern; a 5-wave impulse.
The bearish 5-wave impulse is expected to be completed near 1.1595. At that level, prices will reach the 261.8% extension of wave Ⓐ.
Without a meaningful retracement so far though, we must consider an alternative scenario.
In this scenario, the i primary impulse Ⓒ formed as we speak, is seen as an intermediate impulse wave (1). This suggests further weakness than the first scenario does.
This wave can find an intermediate bottom near 1.1618, in which case, minor wave 5 will be at the 150% extension of minor bearish impulse 3.
After the completion of the impulse (1), we could see a small correction in minor (2) near the 1.2400 area. This target would respect the tenancy prices retracing 50% of wave (1).