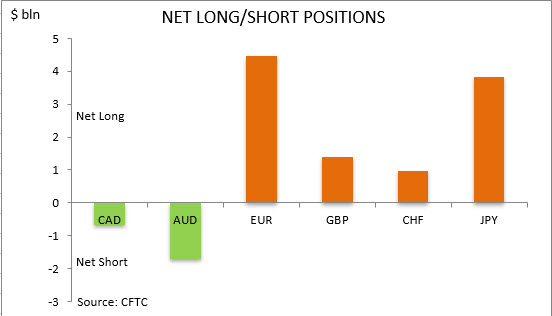
US dollar bullish bets more than tripled to $8.28 billion from $2.28 billion against the major currencies during the one week period, according to the report of the Commodity Futures Trading Commission (CFTC) covering data up to March 17 and released on Friday March 20. The ICE US dollar index gained more than 3% during that period after Fed’s emergency full percentage point rate cut Sunday, March 15, and the start of the purchase program in the magnitude of $700 billion in Treasurys and mortgage-backed securities. Later on March 17 the Fed launched the Commercial Paper Funding Facility – CPFF program, and began to buy directly short term corporate bonds in order to help companies affected by the coronavirus pandemic.
Note: This overview has an informative and tutorial character and is published for free. All the data, included in the overview, are received from public sources, recognized as more or less reliable. Moreover, there is no guarantee that the indicated information is full and precise. Overviews are not updated. The whole information in each overview, including opinion, indicators, charts and anything else, is provided only for familiarization purposes and is not financial advice or а recommendation. The whole text and its any part, as well as the charts cannot be considered as an offer to make a deal with any asset. IFC Markets and its employees under any circumstances are not liable for any action taken by someone else during or after reading the overview.
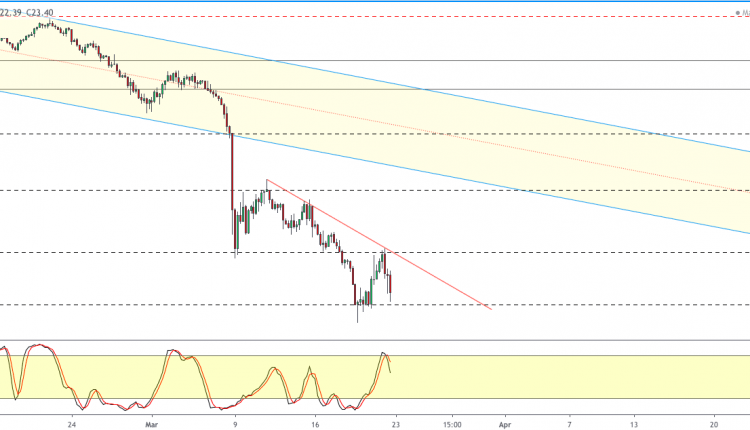
Gold prices marked a modest recovery, rising 1.71% into Friday’s session close.
With the lower levels seeing higher demand, XAUUSD is firmly trading above the 1462 and 1483 levels.
The upside correction in the near term could see XAUUSD rising back to test the 1534 region, with further breakout likely to send gold towards the 1570 region.
For the moment, the downside looks to be solid in holding the commodity from further declines.
– Despite China’s success in containment, the novel coronavirus is exploding in the US and Europe. The contraction will shake economies, politics and governments worldwide.
As the accumulated confirmed cases of the novel coronavirus (Covid-19) continue to soar, there is no immediate deceleration in sight. The official figures are just the tip of the iceberg. In the US and Europe, mobilization is 1-2 months late.
In China, the impact of the coronavirus is easing, but imported cases have only begun. Outside China, epidemiologists currently anticipate a peak around June. If that’s the case, economic damage in China would be largely limited to the first quarter, but international economic damage would endure into the second quarter, and in the most affected countries well beyond.
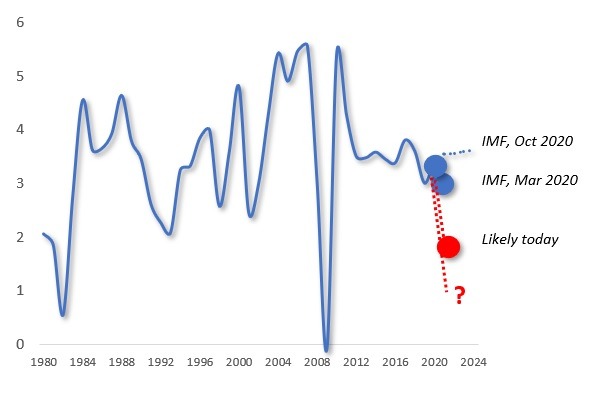
In early March, the International Monetary Fund (IMF) projected global growth to fall 0.1 percentage points from the expected 3.3%. The estimate was too optimistic. In view of current data, a global contraction could cause economic growth prospects to plunge closer to 2% and below. The explosive growth of virus cases in the US and Europe will compound those rates in the rest of the world – which, in turn, could further undermine the year-end outlook (Figure).
FigureGlobal growth projections, 2020
Source: IMF/WEO data, Difference Group
Depending on the outcome of the virus battle in Europe and particularly the U.S., one plausible but dark scenario is that the battle against the coronavirus may last through the ongoing year and possibly through 2021.
China toward rebound
Thanks to China’s draconian measures, reported cases peaked and plateaued between January 23 and 27, and have largely declined since then.
Before the crisis, Chinese economy was benefiting from a mild recovery. In early March, IMF projected China’s growth to fall to 5.6% in 2020. Now estimates in the West anticipate baseline growth of less than 5%, with significant downside risk of less than 3%. In January, factory activity did contract at the fastest pace on record, as did the services activity. Yet, both plunges were only to be expected.
Economic shocks translate to contractions. The real question involves the strength of the post-shock rebound between mid-March and April, given the low starting-point.
As the populous country is moving from containment to the mitigation stage, the challenge will be to contain new imported cases in the borders, while quickly extinguishing potential new virus clusters at home. That will be the key challenge in Asian countries that are likely to prove relatively successful in containment.
In economic terms, China and the rest of Asia must prepare for the negative feedback effect from the world economy. In North America and Europe, the plunges of the 1st quarter are only a prelude to the carnage in the 2nd quarter.
Contraction in US…
Despite elevated warnings since mid-January, uncertainty began to grip the rest of the world only at the end of February. Instead of mobilizing against the virus, complacency in advanced economies led to a series of missteps, including faulty and belated local testing, failures in evacuations and quarantines, lax enforcement of self-quarantines. Hence the consequent multi-trillion-dollar market corrections.
Worse, thanks to a misguided and ill-timed price war, oil prices have plunged a whopping 60% since January 1, down to $20 per barrel. As the virus impact has not yet been fully factored into the prices, crude oil could fall even further.
Recently, the IMF projected US growth to suffer a slowdown from 2.0% to 1.6%. But the estimate is too optimistic. If the second quarter carnage proves limited, U.S. growth could still stay close to 0.2%-5%. But the risks are on the downside and, after a series of policy mistakes, the margin of error is slim.
After the White House’s delays in the outbreak management, the Fed cut interest rates close to zero, starting $700 billion quantitative easing, while pushing for liquidity. That is likely to be coupled with a $1.3 trillion fiscal stimulus. In the short-term, these moves are understandable. In the long-term, they will compound new risks. Under Trump, U.S. sovereign debt has soared faster than in decades – and now it will accelerate even more.
Despite their indebted economies, central banks in Europe, the UK and Japan will follow US footprints into more monetary and fiscal accommodation. In 2008-9, that worked. But if infection rates continue to soar, even these measures will not pacify virus fears, anxious markets and uncertain economies.
… Eurozone
Before the virus, the Eurozone quarterly growth was 0.1%; the weakest in seven years. Now things will get a lot worse. German GDP will stall further, France and Italy will remain in contraction. In the UK, annualized growth is likely to fall fast from 1% to contraction territory.
Soaring infection rates have already reversed Spain’s growth pickup. With sovereign debt at 134% of its economy, Italy is struggling against infections and deaths that are climbing faster than in any other major economy.
If the virus cases continue to soar in the Eurozone, regional growth prospects are likely reverse fully into contraction territory. In the most affected countries, the failure of timely containment is likely to foster a recession through the first half of the year.
If the virus cases continue to climb in the second quarter, the contraction will prove steeper. A potential protracted appreciation of the euro – a déjà vu of the sovereign debt crisis in the early 2010s – could penalize growth even into 2021.
If the virus is not managed appropriately, the consequent hit will cast a shadow over the hoped-for rebound in the second half of 2020 and beyond.
… And Japan
Prior to the coronavirus, Japanese growth contracted 0.7% in the fourth quarter of 2019, thanks to last fall’s consumption tax. With or without the Olympics, the outcome will further weaken the world’s most rapidly aging major economy that’s been in secular stagnation since the mid-90s.
In 2019, South Korea’s economy grew 2%, the slowest in a decade. With some 9,000 confirmed cases, expansion is reversing, and growth is plunging. Additionally, Australia and the regional financial hubs Singapore and Hong Kong are on their way to or in contraction. Since these countries are significant investors in Southeast Asia, their challenges will reverberate across emerging Asia.
Amid the struggle to restore their pre-virus output level, emerging economies will face an economic tsunami from the West. That will cause huge pressures on weaker healthcare systems and cast a dark economic shadow over countries depending on capital inflows and commodity reliance (Indonesia, Mexico and South Africa) or excessive debt (Turkey).
————-
What is urgently needed is multipolar cooperation among major economies and across political differences. Otherwise, worse nightmare scenarios will loom ahead.
About the Author:
Dr. Dan Steinbock is an internationally recognized strategist of the multipolar world and the founder of Difference Group. He has served at the India, China and America Institute (USA), Shanghai Institutes for International Studies (China) and the EU Center (Singapore). For more, see https://www.differencegroup.net
This is a short version of Dr Steinbock’s COVID-19 briefing on March 16, released as “The Global Coronavirus Contraction” by the World Financial Review (March/April) on March 23, 2020
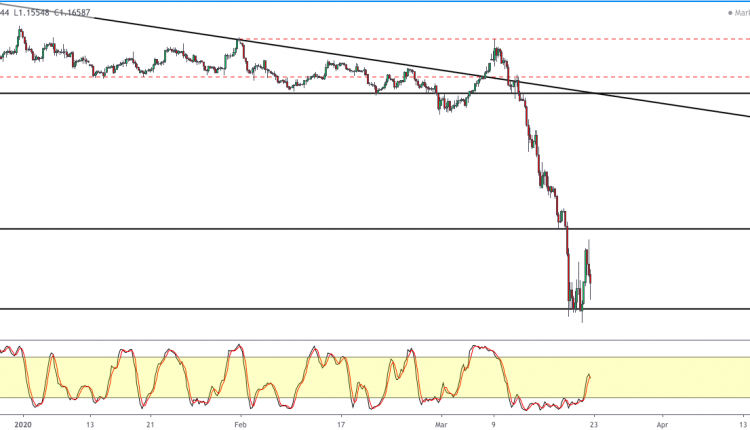
The pound sterling gave back some of the gains from last Thursday as a result of the BoE rate cut.
Price action is lower again, but a bottom looks to be in place at 1.1497.
With the resistance level at 1.2000, we expect the GBPUSD to consolidate with these levels for now.
The pound managed to rise over 1.52% into Friday’s close, but the hidden bearish divergence suggests downside for now. This indicates that the floor at 1.1497 will be tested once again.
The pound sterling went into a stiff sell-off as Britain grapples with its colossal public health crisis. As the economy is coming to a virtual halt amid the COVID-19 outbreak, the Bank of England cut interest rates to 0.1% to calm nerves.
The government has pledged “whatever it takes” to rescue battered industries. Markets responded favourably with the pound recouping some losses.
The pair pulled back after it broke below last August’s low of 126.50. The bounce is likely to run into selling pressures near the moving averages around 135.00.
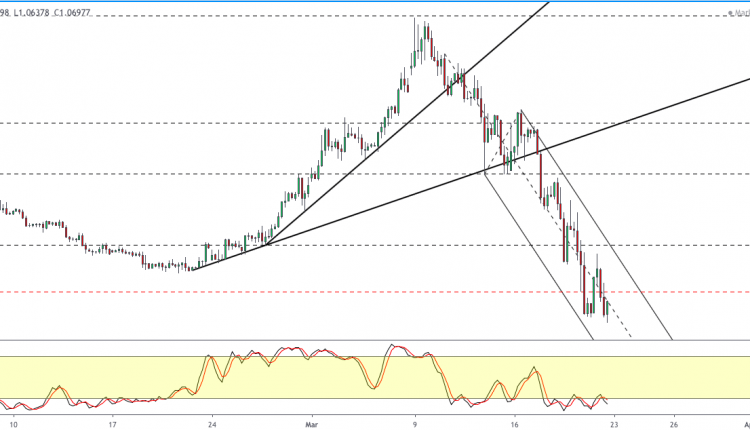
USDCHF Aims for Parity
Fears of the economic fallout from the coronavirus have put the greenback under the spotlight. Heightened uncertainty has led investors to exit global markets and convert their assets into the US dollar, bidding up its exchange rate in the process.
There is no sign of stabilization yet across markets and it is reasonable to believe that the dollar fever may carry on. The breakout above the major resistance of 0.9850 has put the pair on a reversal course.
0.9700 is the immediate support, and after a potential retracement, the rally may extend towards the parity.
NZDCAD Breaks Last October’s Low
The New Zealand dollar saw some buying interests at the end of last week as traders welcomed a new set of stimulus measures. The government has unveiled a $NZ12.1bn fiscal package to shore up the economy, while the Reserve Bank has committed to provide additional liquidity and ensure the integrity of the financial system.
In the meantime, a recovering Chinese economy is likely to provide further support to the Kiwi. 0.8540 is the key resistance ahead. A failure to close above it could send the pair to the psychological level of 0.8000.
WTI sinks to 2016 low
After the US oil price hit the symbolic mark of $20 a barrel, the question is whether we have seen the bottom. The commodity rose after the US sought to buy up to 30 million barrels for its emergency stockpile.
However, the rally may well be short-lived as the pandemic is yet to peak in developed countries.
Meanwhile, the price war between Saudi Arabia and Russia can only add fuel to the fire. 33 near the moving averages is a critical resistance level should the price find enough momentum. Otherwise, renewed pressure could push the oil below 20.
By TheTechnicalTraders– The current global Covid-19 virus event has upended everyone’s forward expectations related to the US and global economy. Recently, President Trump has announced a 12-month reprieve for homeowners who find themselves without income, or a job, because of the US National Emergency related to the Covid-19 pandemic (source: https://www.npr.org). All of the recent repositionings of the global markets and forward expectations got us thinking about “what happens after 8 to 12+ months? How will the US and global markets attempt a recovery process – if at all?”. Today, we are going to try to start digging into the data that we believe is relevant to the future in terms of hard asset prices (home and other property) and more liquid asset prices (global financial markets).
First, we want to preface this article by stating that humans are somewhat predictable in terms of how they will react in emergency or panic situations like this current Covid-19 pandemic. Initially, they will react to protect what is vital to them (family, assets, safety). This same thing happened in the 2008-09 credit market crisis market collapse. Then, after a bit more time, people change their thinking and start to adapt to the situation as it unfolds. We believe that 30 to 60 days from now, as more information becomes available and consumers globally are more capable of addressing the true longer-term risks of this virus event, a social process will begin to take place where valuations and expectations will adjust to the new perceived outcome (whatever that may be).
The global stock market has collapsed nearly -35% based on our Custom Indexes. The SPY has collapsed -32.25% since February 23, 2020. During the 2008-09 Credit Crisis, the SPY collapsed -57.50% before finding a bottom near $67.10. We believe this initial price decline in the global markets is just the first downside price collapse of what may become many. Ultimately, we believe the 2015/2016 lows will become the ultimate support for this downside move in the US markets.
Be sure to opt-in to our free market trend signals before closing this page, so you don’t miss our next special report!
SPY Weekly Chart
Custom Real Estate Index Weekly Chart
Custom European Index Weekly Chart
The data that is currently being reported and posted is data from January and February 2020. Current expectations for March data look grim (at best). Jobless claims, hours worked, and other economic data for the US and global markets may shock investors and the general public for many months to come. In 2008-09, these types of large economic contraction numbers were not uncommon. We want to prepare all of our friends and followers that we believe the next 6 to 12+ months could somewhat mirror what we saw in 2008-09 – be prepared.
If our assumptions are correct, the reprieve in Foreclosures and Mortgage repayments for US consumers may not do much to resolve the ultimate problem. The problem will quickly revolve around the issue of how quickly the US economy can resume somewhat normal functions after the virus event subsides. We believe the reprieve offered to US consumers will assist in making the data a bit more tolerable for a short period of time, but ultimately any extended disruption in the US and global economy will result in extended risks in hard assets like homes, commercial property, and future valuation expectations.
This multi-part research article will dig deeper into the data and expected data to help you prepare for what may be likely in the markets (hard and soft). Now is the time to prepare for what could become one of the biggest disruptions in the global markets and global society we’ve ever seen.
As a technical analysis and trader since 1997, I have been through a few bull/bear market cycles. I believe I have a good pulse on the market and timing key turning points for short-term swing traders.
Visit my ETF Wealth Building Newsletter and if you like what I offer, and ride my coattails as I navigate these financial markets and build wealth while others lose nearly everything they own during the next financial crisis.
The latest data out of the US last week showed a dramatic surge in unemployment claims. Claims shot higher to 281k from the prior week’s 211k. The figure was well above the 220k figure forecast and paints an alarming picture of the state of the US economy amidst the ongoing coronavirus outbreak.
To put this figure in context, last week’s increase in jobless claims was the largest weekly spike in unemployment since late 2017. With many major cities in the US now on lockdown, these figures are likely to continue increasing over the coming weeks.
This will put further pressure on both the Fed and the government to support the economy.
Fed to Increase Liquidity For Banks & Corporates
Over the weekend, the Fed announced that it will offer a further $1 trillion in overnight loans to banks through to the end of March. This will be in addition to the $1 trillion 14-day loans they offer on a weekly basis.
This is the latest in a series of uniquely aggressive moves from the Fed which has been taking swift action to help backstop the economy during the severe disruption caused by the coronavirus outbreak.
Fed Cuts Rates & Announces QE Package
In response to the outbreak, the Fed has now cut interest rates from 1.75% to 0.25%. It also announced a massive $700 billion in fresh stimulus. The Fed announced that it will purchases at least that amount in Treasuries and mortgage-backed securities in an effort to maintain liquidity in the economy.
The Fed also announced that it will use emergency powers to create a Commercial Paper Funding Facility in partnership with the Treasury to allow it to buy bonds issued by corporates.
The Treasury has announced that it will be offering $10 billion in credit protection for the CPFF via its Exchange Stabilisation Fund. This mechanism was last used in response to the 2008 Global Financial Crisis. And, again, this draws eery similarities between conditions now and then.
Emergency Coronavirus Bill
The US government is also acting to help buffer the economy. Congress is finalizing a bill that will free up an extra $4 trillion in liquidity for the Federal Reserve to use.
The emergency COVID-19 relief package will also include a one-time $3000 payment for families impacted by the virus outbreak.
With around 25% of the country impacted by work closures and or lockdowns, the need for swift economic relief has ballooned in recent days. Both the Fed and the US government are now scrambling to address the situation in an effective manner.
Technical Perspective
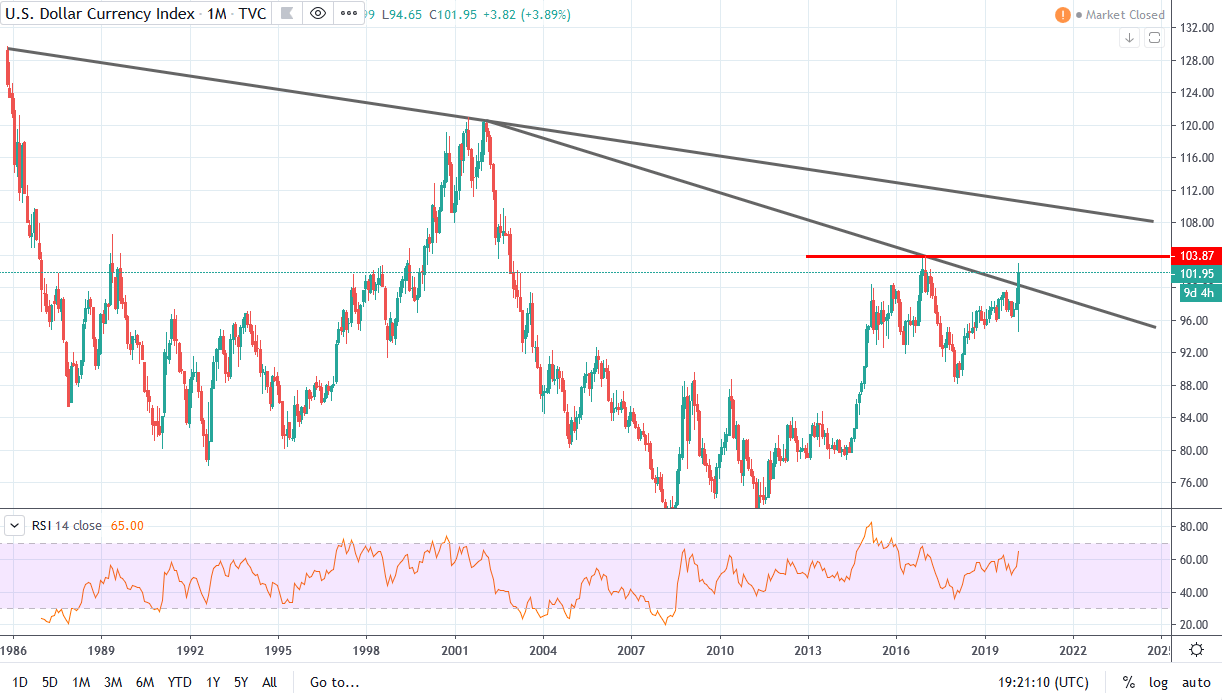
The heavy increase in USD safe-haven buying has seen the USD index surging above the bearish trend line from 2001 highs. Price is now very close to testing the 2016 highs at 103.87. A break of this level will be firmly bullish, putting focus on a test of the long term bearish trend line from 1986 highs next.
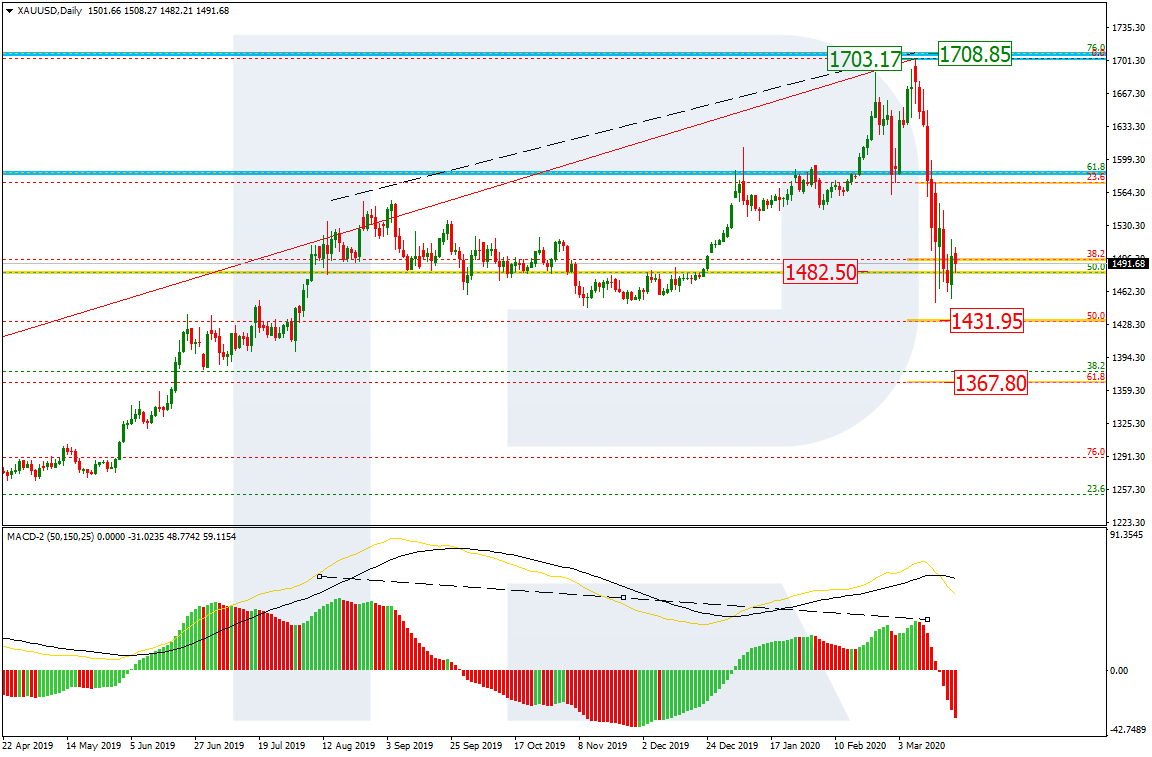
As we can see in the daily chart, the divergence made the pair form a new wave to the downside; the wave broke 38.2% fibo but later stopped not fare from 50.0% fibo at 1431.95. After finishing the correction, XAUUSD may resume trading downwards to reach 50.0% and 61.8% fibo at 1431.95 and 1367.80 respectively. The resistance is the high at 1703.17.
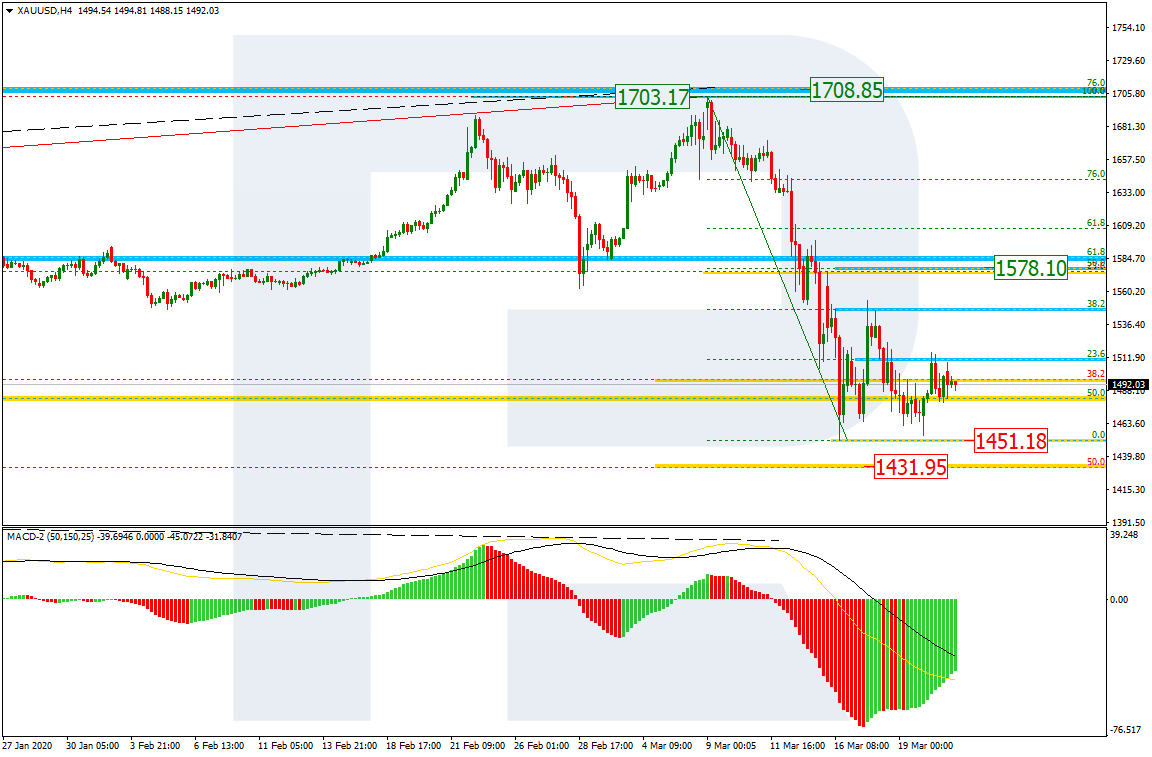
In the H4 chart, the first rising impulse has corrected the previous descending wave by 38.2%. Later, the pair may continue growing towards 50.0% fibo at 1578.10. After completing the pullback and breaking the low at 1451.18, the price may continue its mid-term descending tendency.
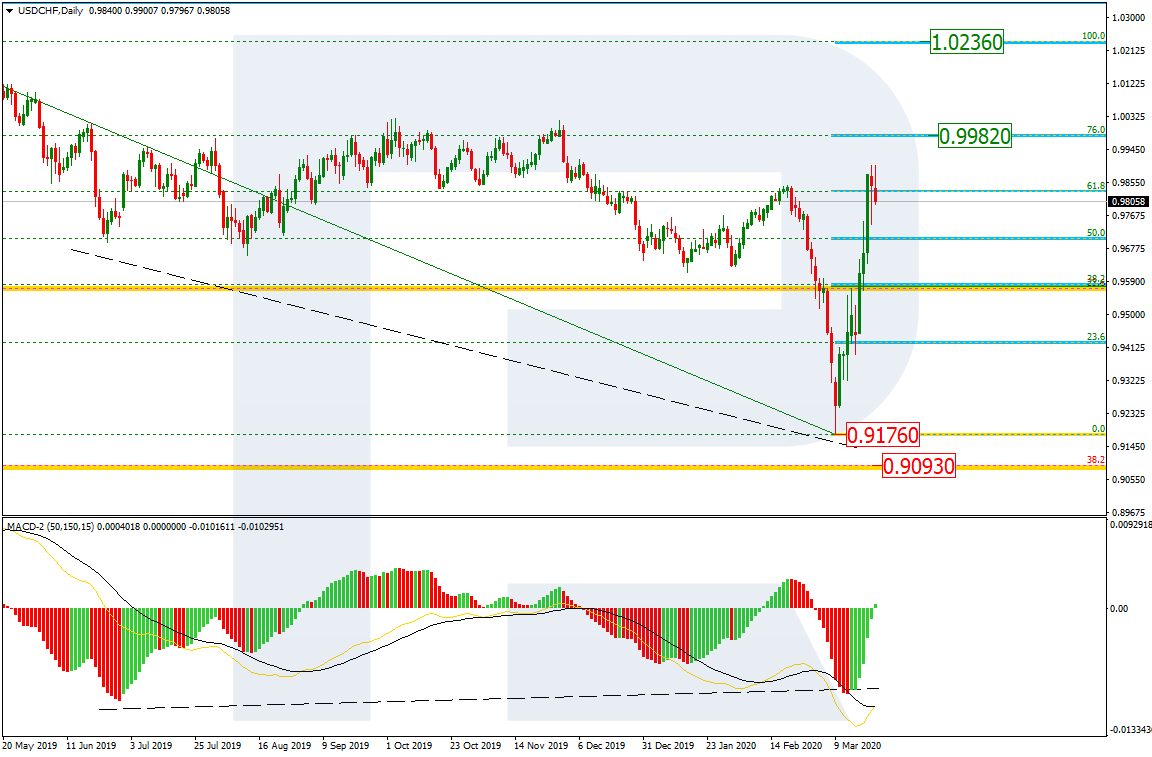
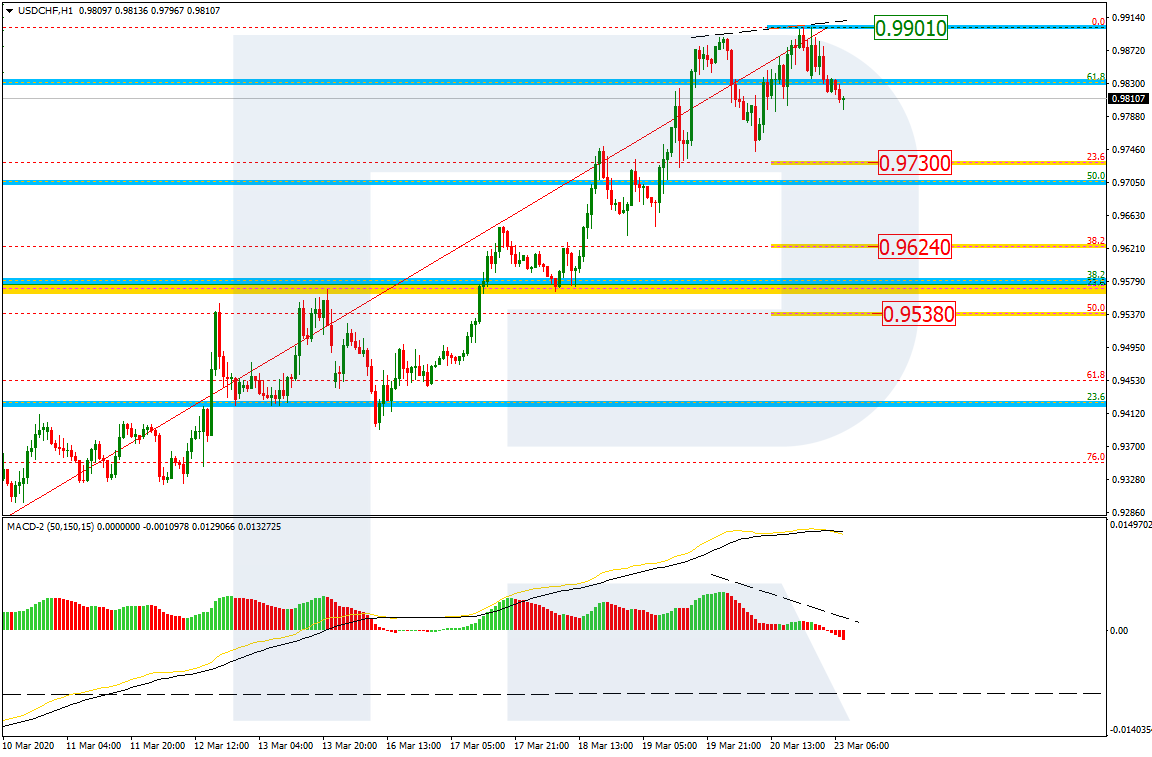
USDCHF, “US Dollar vs Swiss Franc”
In the daily chart, the rising impulse has completely corrected the previous descending wave, which means that the pair may continue growing towards 76.0% fibo at 0.9982 and the fractal high at 1.0236. In the mid-term, USDCHF is expected to trade between 0.9176 and 1.0236.
In the H1 chart, we can see a local divergence and a new pullback. The descending wave may be heading towards 23.6%, 38.2%, and 50.0% fibo at 0.9730, 0.9624, and 0.9538 respectively. The resistance is at 0.9901.
Attention! Forecasts presented in this section only reflect the author’s private opinion and should not be considered as guidance for trading. RoboForex LP bears no responsibility for trading results based on trading recommendations described in these analytical reviews.