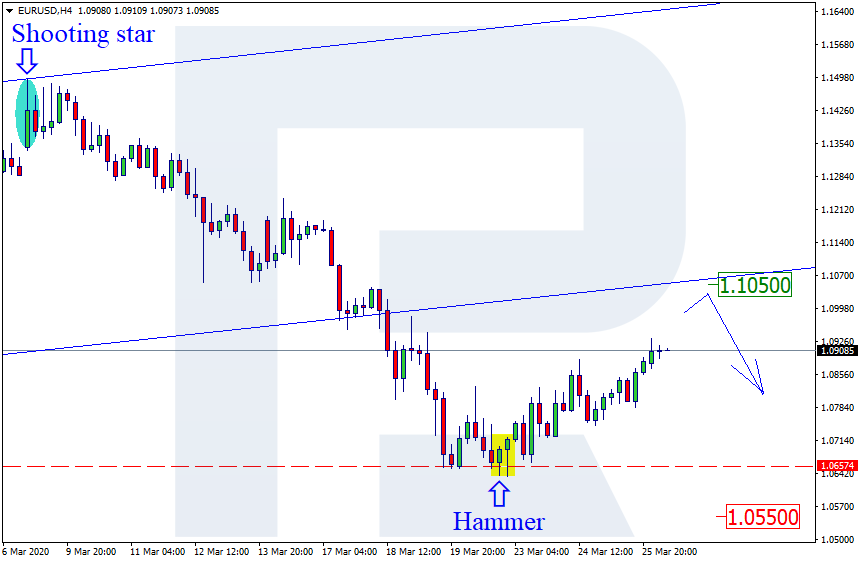
As we can see in the H4 chart, the pair continues the correction within the descending tendency; by now, EURUSD has formed several reversal candlestick patterns, such as Hammer, not far from the support level. At the moment, EURUSD is reversing. We may assume that later the price may correct to reach 1.1050. However, one shouldn’t exclude a possibility that the price may continue falling towards 1.0550 without testing 1.1050.
USDJPY, “US Dollar vs. Japanese Yen”
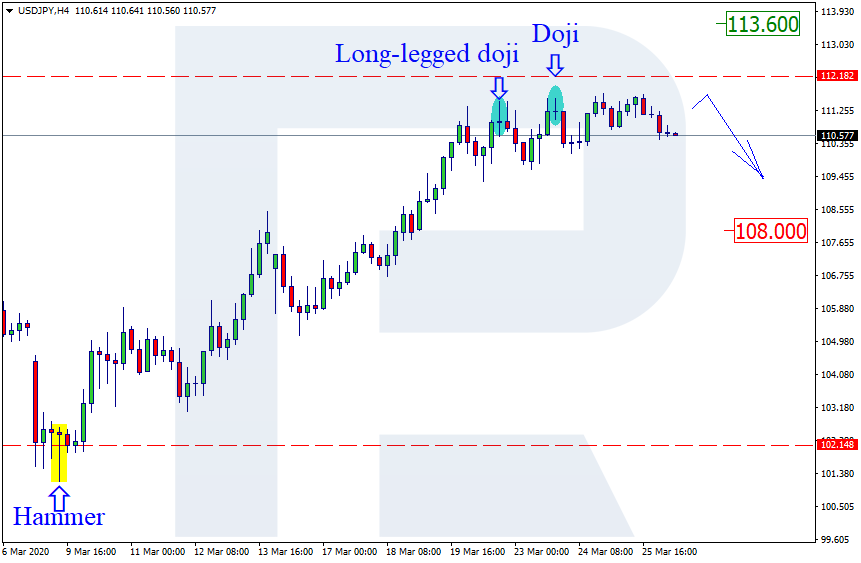
As we can see in the H4 chart, USDJPY is still recovering after the fall. Right now, the pair continues testing the resistance level, where it has formed several reversal patterns, such as Doji, Hanging Man, and Long-Legged Doji. Possibly, the price may reverse and reach 108.00. The current situation implies that after finishing the correction the price may grow towards the target at 113.60.
EURGBP, “Euro vs. Great Britain Pound”
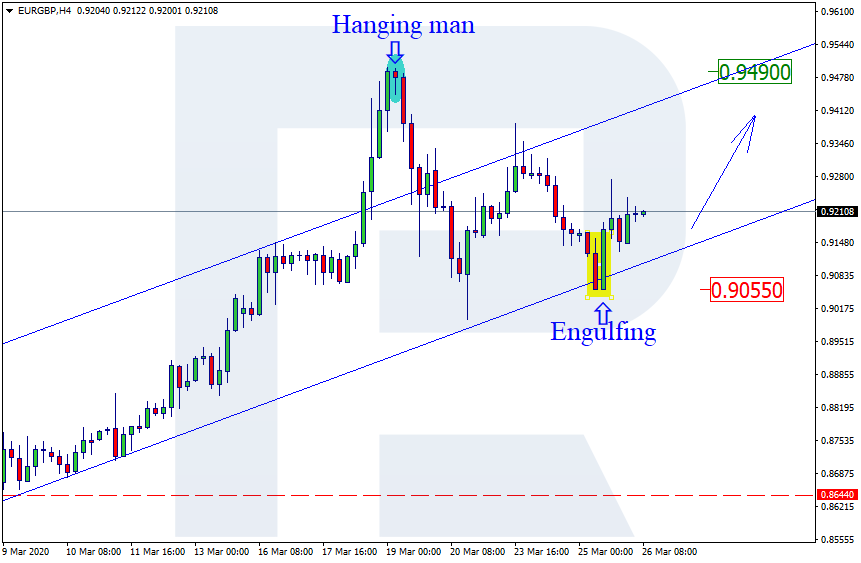
As we can see in the H4 chart, after finishing the correction within the rising tendency and then testing the support level, EURGBP has formed an Engulfing reversal pattern there. At the moment, the pair is reversing. We may assume that later the market may start a new growth towards 0.9490 and continue the ascending tendency. However, one shouldn’t exclude an opposite scenario, which implies that the instrument may continue falling with the target at 0.9055.
Attention! Forecasts presented in this section only reflect the author’s private opinion and should not be considered as guidance for trading. RoboForex LP bears no responsibility for trading results based on trading recommendations described in these analytical reviews.
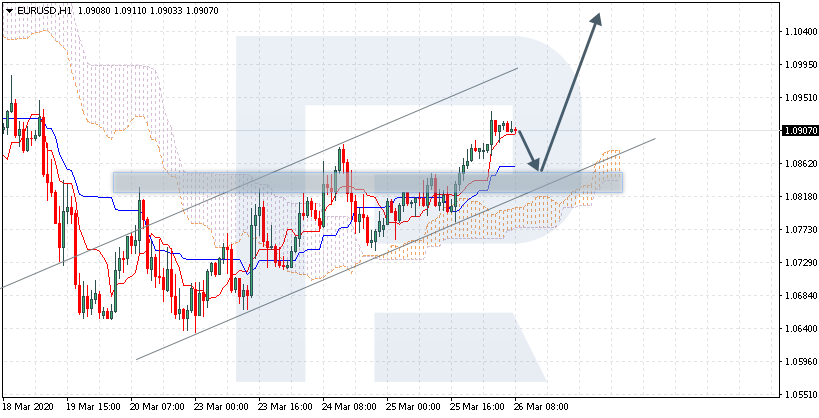
EURUSD is trading at 1.0907; the instrument is moving above Ichimoku Cloud, thus indicating an ascending tendency. The markets could indicate that the price may test Tenkan-Sen and Kijun-Sen at 1.0865 and then resume moving upwards to reach 1.1065. Another signal to confirm further ascending movement is the price’s rebounding from the rising channel’s downside border. However, the scenario that implies further growth may be canceled if the price breaks the cloud’s downside border and fixes below 1.0750. In this case, the pair may continue falling towards 1.0685.
USDCHF, “US Dollar vs Swiss Franc”
USDCHF is trading at 0.9745; the instrument is moving above Ichimoku Cloud, thus indicating an ascending tendency. The markets could indicate that the price may test the cloud’s upside border at 0.9720 and then resume moving upwards to reach 1.0025. Another signal to confirm further ascending movement is the price’s rebounding from the downside border of a Wolfe Wave pattern. However, the scenario that implies further growth may be canceled if the price breaks the cloud’s downside border and fixes below 0.9545. In this case, the pair may continue falling towards 0.9465. After breaking the trendline and fixing above 0.9835, the price may resume moving upwards.
USDTRY, “US Dollar vs New Turkish Lira”
USDTRY is trading at 6.4593; the instrument is moving above Ichimoku Cloud, thus indicating an ascending tendency. The markets could indicate that the price may test the cloud’s downside border at 6.3955 and then resume moving upwards to reach 6.6455. Another signal to confirm further ascending movement is the price’s rebounding from the rising channel’s downside border. However, the scenario that implies further growth may be canceled if the price breaks the cloud’s downside border and fixes below 6.3000. In this case, the pair may continue falling towards 6.2000.
Attention! Forecasts presented in this section only reflect the author’s private opinion and should not be considered as guidance for trading. RoboForex LP bears no responsibility for trading results based on trading recommendations described in these analytical reviews.
The EUR/USD currency pair went up after a long consolidation. The trading tool has updated local highs. At the moment, EUR/USD quotes are consolidating in the range of 1.08800-1.09550. The technical pattern signals a further recovery of the EUR. The US Senate supported the $2 trillion bill, which aims to help the unemployed and industries affected by the epidemic of the COVID-19 virus. Today, investors will evaluate the data on the number of initial jobless claims in the United States. According to forecasts, the indicator grew by more than 3.5 times. We recommend opening positions from key levels.
The Economic News Feed for 26.03.2020:
– GDP Report (US) – 14:30 (GMT+3:00);
– Initial Jobless Claims (US) – 14:30 (GMT+3:00);
Indicators signal the power of buyers: the price has fixed above 50 MA and 100 MA.
The MACD histogram is in the positive zone, indicating a bullish sentiment.
The Stochastic Oscillator is in the neutral zone, the %K line crossed the %D line. There are no signals at the moment.
Trading recommendations
Support levels: 1.08800, 1.08150, 1.07500
Resistance levels: 1.09550, 1.10600
If the price consolidates above 1.09550, expect further correction to 1.10000-1.10500.
Alternatively, the quotes could descend toward 1.08200-1.07800.
The GBP/USD currency pair
Technical indicators of the currency pair:
Prev Open: 1.17432
Open: 1.18744
% chg. over the last day: +1.09
Day’s range: 1.17755 – 1.19609
52 wk range: 1.1466 – 1.3516
An ambiguous technical picture has developed on the GBP/USD currency pair. The Pound is currently consolidating. The local support and resistance levels are 1.17800 and 1.19750, respectively. Investors took a wait and see attitude before the meeting of the Bank of England. We recommend you to pay attention to the comments and rhetoric of the representatives of the regulator. Open positions from the key levels.
UK National Statistics Service released weak UK retail sales data for February. At 14:00 (GMT + 2: 00) the Bank of England will announce its decision regarding the key interest rate.
Indicators signal the power of buyers: the price has fixed above 50 MA and 100 MA.
The MACD histogram is in the positive zone, indicating a bullish sentiment.
The Stochastic Oscillator is in the neutral zone, the %K line crossed the %D line. There are no signals at the moment.
Trading recommendations
Support levels: 1.17800, 1.16500, 1.14500
Resistance levels: 1.19750, 1.21350, 1.22800
If the price consolidates above 1.19750, GBP/USD is expected to rise to 1.21000-1.21500.
Alternatively, the quotes could descend toward 1.16500-1.16000.
The USD/CAD currency pair
Technical indicators of the currency pair:
Prev Open: 1.45076
Open: 1.44658
% chg. over the last day: -0.25
Day’s range: 1.42955 – 1.44830
52 wk range: 1.2949 – 1.4668
The USD/CAD currency pair went down. The trading tool has updated local lows. CAD is currently testing a round level of 1.43000. 1.44500 is the nearest resistance. The technical picture signals a further correction of the USD/CAD quotes. We recommend you to pay attention to the dynamics of black gold prices. Open positions from key levels.
The Economic News Feed for 26.03.2020 is pretty calm.
Indicators signal the power of sellers: the price has fixed below 50 MA and 100 MA.
The MACD histogram is in the negative zone and continues to decline, indicating a bearish mood.
The Stochastic Oscillator is in the oversold zone, the% K line crossed the% D line. There are no signals at the moment.
Trading recommendations
Support levels: 1.43000, 1.41500, 1.40000
Resistance levels: 1.44500, 1.45550, 1.46600
If the price consolidates below 1.43000, expect further correct toward 1.42000-1.41000.
Alternatively, the quotes could grow toward 1.45000-1.46000.
The USD/JPY currency pair
Technical indicators of the currency pair:
Prev Open: 111.222
Open: 111.328
% chg. over the last day: +0.05
Day’s range: 110.752 – 111.568
52 wk range: 101.19 – 112.41
The USD/JPY currency pair is still in a flat. There is no defined trend. Participants in financial markets expect additional drivers. At the moment, the following local support and resistance levels can be distinguished: 110.200 and 111.600, respectively. In the near future, technical correction of the trading instrument is not ruled out. We recommend you to pay attention to the dynamics of yield on US government bonds. Open positions from key levels.
The Economic News Feed for 26.03.2020 is calm.
Indicators do not give accurate signals: the price is consolidating near 50 MA.
The MACD histogram is in the positive zone, indicating a bullish sentiment.
The Stochastic Oscillator is in the neutral zone, the% K line crossed the% D line. There are no signals at the moment.
Trading recommendations
Support levels: 110.200, 109.300, 108.500.
Resistance levels: 111.600, 112.000
If the price consolidates below 110.200, expect a correction toward 109.300-108.500.
Alternatively, the quotes could grow toward 112.000-112.500.
By Hussein Sayed, Chief Market Strategist (Gulf & MENA), ForexTime
Over the past two days, US and global stocks have made an astonishing bounce back with the Dow Jones Industrial Average rallying 16.4% from Monday’s trough. That is more than double the average yearly return on the index going back to 1921.
The return to risk has been due to the US Senate’s negotiations of a $2 trillion package designed to cushion the impact of the virus on the US economy, which finally got approved late Wednesday and passed the House overnight.
US stocks recorded their first back-to-back daily gains since February 6, when the index was hovering near its record highs. While such a move may be considered a positive signal to risk assets and welcomed by many, investors need to treat it with caution.
Following Lehman Brother’s collapse on September 15, 2008, US stocks saw similar moves after steep falls. On October 10 of the same year, the Dow Jones Industrial Average rallied from a low of 7,882 to a high of 9,794 in two days. That was a 24% recovery following a 31% decline from September 15th. However, it then took the index 98 more trading days to find the bottom at 6,469, after which the longest bull run in US history occurred.
The $2 trillion package along with the Federal Reserve’s unlimited stimulus plans, and the ECB made a historic announcement overnight that there will be no limits to their QE program, these measures will undoubtedly ease financial conditions for now and prevent a credit crisis. That might also be translated into less volatility in asset classes. But, history tells us it may only offer short-term relief.
Today’s biggest test is likely to be at 12:30 GMT following the release of the weekly initial jobless claims figures. Economist expectations are varying widely, with some anticipating up to four million new claims which would comfortably be the highest on record. This is expected to be just the start of a streak of terrible economic data to come in the following weeks. Depending on how bad the numbers are, we may see a sell-off of the same magnitude in stocks.
At this stage, it doesn’t seem all the bad news is already discounted and the latest rally in US stocks was irrational with the most beaten-up stocks rallying the most, a sign of irrational behavior and not smart stock picking. While the upcoming data in the next two weeks will begin reflecting the economic damage due to the virus spread, investors still need to assess the impact on corporate earnings.
Until we get a clear assessment of the damage to the economy and earnings, it’s difficult to make rational investment decisions. That’s why the most critical factor in this crisis is still when the peak in infections becomes evident and the pandemic ends.
Disclaimer: The content in this article comprises personal opinions and should not be construed as containing personal and/or other investment advice and/or an offer of and/or solicitation for any transactions in financial instruments and/or a guarantee and/or prediction of future performance. ForexTime (FXTM), its affiliates, agents, directors, officers or employees do not guarantee the accuracy, validity, timeliness or completeness, of any information or data made available and assume no liability as to any loss arising from any investment based on the same.
US stock market posted back to back gains on Wednesday. However indexes ended off daily maximums as few Senators said they wanted amendments to be made to $2 trillion economic rescue package before they would vote for it. The S&P 500 gained 1.2% to 2475.56. The Dow Jones industrial average rose 2.4% to 21200.55, first back to back gain since February 6. Nasdaq however slipped 0.5% to 7384.30. The dollar weakening continued despite report the durable goods orders jumped 1.2% in February when 1% decline was expected. The live dollar index data show the ICE US Dollar index, a measure of the dollar’s strength against a basket of six rival currencies, fell 0.6% to 100.99 and is lower currently. The Senate passed the coronavirus bill later Wednesday, which is expected to provide $1,200 direct payments to many Americans, offer more than $360 billion in loans to small businesses and $500 billion to industries, cities and states. Futures point to lower market openings today.
CAC 40 led European indexes advance
European stocks also booked successive gains on Wednesday despite weak economic reports. The EUR/USD and GBP/USD continued their climbs yesterday, with both pairs higher currently. The Stoxx Europe 600 ended up 2.5% led by energy shares. Germany’s DAX 30 added 1.8% to 9874.26 despite an Ifo Institute for Economic Research report the business sentiment in Germany suffered its steepest fall in March since the country’s reunification in 1990. France’s CAC 40 advanced 4.47% while UK’s FTSE 100 rose 4.45% to 5688.20 as consumer inflation ticked lower to 1.7% in February from 1.8% in January.
Australia’s All Ordinaries Index up while Asian indexes slump
Asian stock indices are mixed today after Dows first back-to-back gain in 7 weeks overnight. Nikkei fell 4.5% to 18664.60 as yen accelerated its climb against the dollar. Markets in China are falling: Shanghai Composite Index is 0.6% lower while Hong Kong’s Hang Seng Index is down 1.2%. Australia’s All Ordinaries Index however rose 2.3% despite Australian dollar’s resumed climbing against the greenback.
Brent down after ninth weekly build in US crude inventory
Brent futures prices are pulling back today. Prices rose yesterday as the Energy Information Administration reported US crude oil inventories rose by smaller than expected 1.6 million barrels last week, nineth weekly rise in a row: May Brent added 0.9% to $27.39 on Wednesday.
Gold edges down despite weaker Dollar
Gold prices are extending losses today after a retreat on Wednesday. April gold price of an ounce of gold fell 1.7% to $1633.40 on Wednesday.
Note: This overview has an informative and tutorial character and is published for free. All the data, included in the overview, are received from public sources, recognized as more or less reliable. Moreover, there is no guarantee that the indicated information is full and precise. Overviews are not updated. The whole information in each overview, including opinion, indicators, charts and anything else, is provided only for familiarization purposes and is not financial advice or а recommendation. The whole text and its any part, as well as the charts cannot be considered as an offer to make a deal with any asset. IFC Markets and its employees under any circumstances are not liable for any action taken by someone else during or after reading the overview.
– In this last segment of our multi-part research article, we want to highlight our expectations of the Covid-19 virus event and how the next 6+ months of global market activity may play out. We’ve covered some of the data points we believe are important and we’ve touched on the collateral damage that may be unknown at this time. Today, we’ll try to put the bigger picture together for investors to help you understand what we believe may be the 12+ month outcome.
As the global central banks and US Fed attempt to come to the rescue, the reality is that monetary policy works better when consumers are able to actually go out and engage in spending and economic activity. If the Covid-19 virus event contracts global consumer activity, as it has recently, for an extended period of time (4 to 6+ months), then we have a real issue with how QE efforts and consumer activity translate into any real recovery attempt.
The real risks to the global markets is an extended risk that the Covid-19 virus creates a contracting economic environment for many months/quarters and potentially fosters an environment where extensive collateral damage to corporations, consumer activity, credit/debt markets, and other massive financial risks boil over.
Before you continue, be sure to opt-in to our free market trend signals before closing this page, so you don’t miss our next special report!
News is already starting to hit that QE is not helping the deteriorating situation in the Mortgage banking business. Remember, this is the same segment of the financial industry that started the 2007-08 credit crisis event. News that mortgage lenders and bankers are already starting to experience margin-calls and have attempted to contract their exposure to the risks in the markets (a bit late) are concerning. This is a pretty big collateral damage risk for the global markets.
Additionally, as we expected, applications for new mortgages have collapsed to their lowest level since 2009. Until consumers feel confident in their ability to get out, engage in real economic growth and take on home loans they know are relatively secure in their ability to repay – there is going to be a continued market contraction. The next phase of this contraction is a price reduction, forced selling/foreclosures and a glut of assets waiting for a bottom.
“Home-purchase applications dropped by 14.6% while
I think the most important aspect of this global virus event is to remember that we will survive it (in some form) and we will live to rebuild after this event completes. Yet, the reality is that we were not prepared for this event to happen and we don’t know the total scope of this Covid-19 virus event. We simply don’t know how long it will take to remove the threat of the virus and for societies to reengage in normal economic activity – and that is the key to starting a real recovery.
Hong Kong has recently reported a “third wave” of Covid-19 infections. I believe we should attempt to learn from places like Hong Kong, where news is moderately accurate and reported via social media and other resources. If we want to learn what to expect in the US and how the process of containing this virus may play out, we need to start learning from other nations that are ahead of us in the curve.
It appears that any attempt to resume somewhat normal economic activities while the virus is still active spouts a new wave of infections. This would suggest that the only way to attempt to reengage in any somewhat normal economic activity would be when a vaccine or true medical cure is in place to allow nations to attempt to eradicate the virus as these waves continue. (Source: https://www.marketwatch.com/story/third-wave-hong-kong-thought-it-had-a-handle-on-coronavirus-it-doesnt-2020-03-23 )
The price collapse in 2008-09 represented a -56% decline from top to bottom. Currently, the S&P has fallen by just over 35%. We don’t believe the bottom in the US stock market has setup just yet and we do believe there is a greater downside price risk ahead. We don’t believe the housing market will be able to sustain any of the current price levels for much longer. We believe the collateral damage of this event is just starting to be known and we believe a greater economic contraction is unfolding not only in the US but throughout the globe.
Skilled traders need to understand the total scope of this event. We’ve attempted to highlight this risk in this article and in our “Crunching Numbers” research article (PART III). An economic contraction, like the Covid-19 virus event, could contract global GDP by as much as 8 to 15% over an extended 16 to 36+ month span of time. Are we concerned about the Real Estate market? You Bet! Are we concerned about global markets? You Bet! Are we prepared for this as traders? You Bet! Are the central banks global nations prepared for this? We certainly hope so.
As a technical analysis and trader since 1997, I have been through a few bull/bear market cycles. I believe I have a good pulse on the market and timing key turning points for short-term swing traders.
Visit my ETF Wealth Building Newsletter and if you like what I offer, and ride my coattails as I navigate these financial markets and build wealth while others lose nearly everything they own during the next financial crisis.
Money manager Adrian Day looks at business development companies.
Business development companies (BDCs) have been hit particularly hard, on concerns that small businesses to which they lend will not be able to repay loans. That concern is legitimate. The stocks have fallen far more than the broad market, several large ones down 60% over the past month, compared with 32% for S&P. BDCs themselves are leveraged; lending used to be limited to twice assets, but recently the restriction was loosened. Most BDCs, however, have kept their leverage under control, far below what is permitted, with many still well below the old 2-to-1 limit.
We do expect to see many portfolio companies of the BDCs unable to repay loans, some perhaps going out of business. However, many BDCs have strong balance sheets and will be able to assist their portfolio companies, if they see fit. Many also have collateral on their loans, which may not see 100 cents on the dollar, will help. Our two holdings has spillover income to be distributed, so couldagain, should they choosecontinue to pay their current dividends for a few quarters, even if they see a sharp decline in income for that period. And lastly, at present valuations there is a thick cushion; even if book value was cut in half, and the dividend likewise, the valuations would still be on historical norm for the respective companies.
The largest and one of the strongest BDCs can continue to pay
Ares Capital Corp. (ARCC:NASDAQ) (10.39) is the largest of the publicly traded BDCs and one of the more conservative. In recent months, it had been cautious in new lending even ahead of the coronavirus. Core income remains above the dividend and the company has spillover income of around $0.95 per share, equivalent to nearly 70% of next year’s dividend. Its total debt is just under half the fair value of investments.
The stock traded above $18/share for virtually all of the past year. At the current price, the stock is trading at just less than 0.6x earnings, about 0.6x book value and yielding 15.98%. Now, there will be some defaults no doubt in the economic downturn that lies ahead, and the leverage will compound the effect. But will earnings be cut so that the yield is cut in half, to 8% (still a healthy yield in the current environment)? I don’t think so.
Buy Ares Capital. But in this volatile market it is essential to be very disciplined with prices. I doubt if Friday’s price will be the bottom. In this market, also, we would trim stocks on strong rallies, looking to buy more on another drop, thus accumulating a position in a strong company with a high yield, but always reducing your cost basis.
Gladstone has strong backlog of income
Gladstone Investment Corp. (GAIN: NASDAQ) (7.72) similarly has fallen considerably, has low valuation, income exceeding the dividend, and a backlog of undistributed income. Unlike most BDCs, Gladstone looks for both dividend income in its loans and for capital gains from the equity kickers it generally gets with its investments. It aims for 7075% of its investments to be in loans, the rest in equity. It pays two separate dividends, a steady monthly dividend from its loan incomerecently boosted to $0.07 per monthplus it pays bonus dividends funded from capital gains. These have added $0.21 over the past year, for a total yield at today’s price of over 13%.
Net investment income$0.23 in the latest quarteris exceeding distributions, and the company currently has$1.76 per share in undistributed net income, equal to the regular monthly dividend for more than two years. This provides a cushion against a dividend cut.
There is ongoing insider buying, both as the stock price appreciated over the last year, and as it collapsed in the last two weeks. This is a strong vote of confidence.
Low valuations gives cushion
Down from north of $15 at year-end, and over $11.50 for most of the past year, Gladstone is down sharply over the past month. The current yield, including the anticipated semi-annual additional distributions, is 13.4%. The stock is trading at 0.6x book, with a price to free cash flow of less than 3x. So again, Gladstone has a pretty good cushion to survive some damaging news at its portfolio companies.
Buy Gladstone, but again be very disciplined with limit in these volatile markets, and if there is a strong short-term rally, trim holdings so you can add more if it drops again.
Adrian Day, London-born and a graduate of the London School of Economics, heads the money management firm Adrian Day Asset Management, where he manages discretionary accounts in both global and resource areas. Day is also sub-adviser to the EuroPacific Gold Fund (EPGFX). His latest book is “Investing in Resources: How to Profit from the Outsized Potential and Avoid the Risks.”
Disclosure: 1) Adrian Day: I, or members of my immediate household or family, own securities of the following companies mentioned in this article: Gladstone Investments. I personally am, or members of my immediate household or family are, paid by the following companies mentioned in this article: None. My company has a financial relationship with the following companies mentioned in this article: None. Funds controlled by Adrian Day Asset Management hold shares of the following companies mentioned in this article: All. I determined which companies would be included in this article based on my research and understanding of the sector. 2) The following companies mentioned in this article are billboard sponsors of Streetwise Reports: None. Click here for important disclosures about sponsor fees. The information provided above is for informational purposes only and is not a recommendation to buy or sell any security. 3) Statements and opinions expressed are the opinions of the author and not of Streetwise Reports or its officers. The author is wholly responsible for the validity of the statements. The author was not paid by Streetwise Reports for this article. Streetwise Reports was not paid by the author to publish or syndicate this article. Streetwise Reports requires contributing authors to disclose any shareholdings in, or economic relationships with, companies that they write about. Streetwise Reports relies upon the authors to accurately provide this information and Streetwise Reports has no means of verifying its accuracy. 4) This article does not constitute investment advice. Each reader is encouraged to consult with his or her individual financial professional and any action a reader takes as a result of information presented here is his or her own responsibility. By opening this page, each reader accepts and agrees to Streetwise Reports’ terms of use and full legal disclaimer. This article is not a solicitation for investment. Streetwise Reports does not render general or specific investment advice and the information on Streetwise Reports should not be considered a recommendation to buy or sell any security. Streetwise Reports does not endorse or recommend the business, products, services or securities of any company mentioned on Streetwise Reports. 5) From time to time, Streetwise Reports and its directors, officers, employees or members of their families, as well as persons interviewed for articles and interviews on the site, may have a long or short position in securities mentioned. Directors, officers, employees or members of their immediate families are prohibited from making purchases and/or sales of those securities in the open market or otherwise from the time of the interview or the decision to write an article until three business days after the publication of the interview or article. The foregoing prohibition does not apply to articles that in substance only restate previously published company releases.