XAUUSD Attempts To Move To The Upside

By Orbex

Gold prices are slightly bullish, rising over 1.50% on the day. Price action reclaimed the resistance level of 1594.

This puts the upside bias into the picture. In the event that prices pullback lower, then we expect the 1594 level to hold out as support.

To the upside, the next target is at 1655 handle. Alternately, if price fails at 1594, then we expect a move lower.

By Orbex


The Analytical Overview of the Main Currency Pairs on 2020.04.03

by JustForex

The EUR/USD currency pair

Technical indicators of the currency pair:
  • Prev Open: 1.09615
  • Open: 1.08554
  • % chg. over the last day: -0.97
  • Day’s range: 1.07984 – 1.08648
  • 52 wk range: 1.0777 – 1.1494

EUR/USD quotes continue to show negative dynamics. The trading instrument has updated local lows. The coronavirus epidemic continues to impact the global economy negatively. The number of infections in the world exceeded 1 million. The jobless claims in the US exceeded historic highs and counted to more than 6.6 million. Currently, EUR/USD quotes are consolidating in the range of 1.08000-1.08700. Financial market participants have taken a wait-and-see attitude before the publication of US labor statistics for March. We recommend paying attention to the difference between the actual and forecasted values. Positions should be opened from key levels.

The Economic News Feed for 03.04.2020:

  • – Indicators on economic activity in the Eurozone at 11:00 (GMT+3:00);
  • – Report on the US labor market at 15:30 (GMT+3:00);
  • – ISM non-manufacturing PMI at 17:00 (GMT+3:00).
EUR/USD

Indicators signal the power of sellers: the price has fixed below 50 MA and 100 MA.

The MACD histogram is in the negative zone and continues to decline, that gives a strong signal to sell EUR/USD.

Stochastic Oscillator is in the neutral zone, the %K line is below the %D line, which also indicates the bearish sentiment.

Trading recommendations
  • Support levels: 1.08000, 1.07200
  • Resistance levels: 1.08700, 1.09200, 1.09700

If the price fixes below the round level of 1.08000, a further fall in the EUR/USD currency pair is expected. The movement is tending to 1.07500-1.07000.

An alternative could be the growth of EUR/USD quotes to 1.09200-1.09700.

The GBP/USD currency pair

Technical indicators of the currency pair:
  • Prev Open: 1.23771
  • Open: 1.23997
  • % chg. over the last day: +0.11
  • Day’s range: 1.23252 – 1.24023
  • 52 wk range: 1.1466 – 1.3516

The GBP/USD currency pair is still being traded in a prolonged flat. There is no defined trend. The key support and resistance levels are 1.23000 and 1.24800, respectively. Financial market participants have taken a wait-and-see attitude. Today, the US labor market report for March is in the focus of attention. Positions should be opened from key levels.

At 11:30 (GMT+3:00), composite PMI will be published in the UK.

GBP/USD

Indicators do not give accurate signals: the price has crossed 50 MA.

The MACD histogram is near the 0 mark.

Stochastic Oscillator is in the neutral zone, the %K line has crossed the %D line. There are no signals at the moment.

Trading recommendations
  • Support levels: 1.23000, 1.21450, 1.20150
  • Resistance levels: 1.24800, 1.25500

If the price fixes below the round level of 1.23000, GBP/USD quotes are expected to fall. The movement is tending to 1.22000-1.21000.

An alternative could be the growth of the GBP/USD currency pair to 1.25500-1.26000.

The USD/CAD currency pair

Technical indicators of the currency pair:
  • Prev Open: 1.41923
  • Open: 1.41358
  • % chg. over the last day: -0.40
  • Day’s range: 1.41163 – 1.41972
  • 52 wk range: 1.2949 – 1.4668

The technical pattern on the USD/CAD currency pair is still ambiguous. The loonie is in a sideways trend. The local support and resistance levels are 1.40800 and 1.42000, respectively. The recovery of “black gold” prices supports the Canadian dollar. Today we recommend paying attention to economic releases from the US. Positions should be opened from key levels.

The news feed on Canada’s economy is calm.

USD/CAD

Indicators do not give accurate signals: the price has crossed 50 MA and 100 MA.

The MACD histogram is near the 0 mark.

Stochastic Oscillator is in the neutral zone, the %K line is below the %D line, which indicates the bearish sentiment.

Trading recommendations
  • Support levels: 1.40800, 1.40100, 1.39250
  • Resistance levels: 1.42000, 1.42700, 1.43350

If the price fixes below 1.40800, USD/CAD quotes are expected to fall. The movement is tending to 1.40100-1.39500.

An alternative could be the growth of the USD/CAD currency pair to 1.42500-1.43000.

The USD/JPY currency pair

Technical indicators of the currency pair:
  • Prev Open: 107.154
  • Open: 107.886
  • % chg. over the last day: +0.13
  • Day’s range: 107.808 – 108.292
  • 52 wk range: 101.19 – 112.41

USD/JPY quotes have been growing. The trading instrument has updated local highs. At the moment, the “safe haven” currency is testing the resistance level of 108.250. The 107.600 mark is the nearest support. Today, investors will assess US labor statistics for March. We also recommend paying attention to the dynamics of US government bonds yield. Positions should be opened from key levels.

The news feed on Japan’s economy is calm enough.

USD/JPY

Indicators do not give accurate signals: the price has fixed between 50 MA and 100 MA.

The MACD histogram is in the positive zone, which indicates the growth of USD/JPY quotes.

Stochastic Oscillator is in the neutral zone, the %K line is above the %D line, which gives a signal to buy USD/JPY.

Trading recommendations
  • Support levels: 107.600, 107.000, 106.500
  • Resistance levels: 108.250, 108.700, 109.600

If the price fixes above 108.250, further growth of USD/JPY quotes is expected. The movement is tending to 108.700-109.200.

An alternative could be a decrease in the USD/JPY currency pair to a round level of 107.000.

by JustForex

Ichimoku Cloud Analysis 03.04.2020 (BTCUSD, XAUUSD, EURUSD)

Article By RoboForex.com

BTCUSD, “Bitcoin vs US Dollar”

BTCUSD is trading at 6750.00; the instrument is moving above Ichimoku Cloud, thus indicating a bullish tendency. The markets could indicate that the price may test the cloud’s upside border at 6555.00 and then resume moving upwards to reach 7445.00. Another signal to confirm further ascending movement is the price’s rebounding from the rising channel’s downside border. However, the scenario that implies further growth may be canceled if the price breaks the cloud’s downside border and fixes below 6325.00. In this case, the pair may continue falling towards 5825.00.

BTCUSD
Risk Warning: the result of previous trading operations do not guarantee the same results in the future

XAUUSD, “Gold vs US Dollar”

XAUUSD is trading at 1610.00; the instrument is moving above Ichimoku Cloud, thus indicating an ascending tendency. The markets could indicate that the price may test Tenkan-Sen and Kijun-Sen at 1600.00 and then resume moving upwards to reach 1635.00. Another signal to confirm further ascending movement is the price’s rebounding from the rising channel’s downside border. However, the scenario that implies further growth may be canceled if the price breaks the cloud’s downside border and fixes below 1580.00. In this case, the pair may continue falling towards 1535.00.

GOLD
Risk Warning: the result of previous trading operations do not guarantee the same results in the future

EURUSD, “Euro vs US Dollar”

EURUSD is trading at 1.0847; the instrument is moving below Ichimoku Cloud, thus indicating a descending tendency. The markets could indicate that the price may test the cloud’s downside border at 1.0895 and then resume moving downwards to reach 1.0705. Another signal to confirm further descending movement is the price’s rebounding from the descending channel’s upside border. However, the scenario that implies further decline may be canceled if the price breaks the cloud’s upside border and fixes above 1.0975. In this case, the pair may continue growing towards 1.1065.

EURUSD

Article By RoboForex.com

Attention!
Forecasts presented in this section only reflect the author’s private opinion and should not be considered as guidance for trading. RoboForex LP bears no responsibility for trading results based on trading recommendations described in these analytical reviews.

Crude Oil Rises To A 2-Week High

By Orbex

Oil prices are caught in a bid, rising to a two-week high. The gains came after President Trump’s announcement about a possible OPEC supply cut.

WTI crude oil rose to intraday highs of 27.31 before retracing some of the gains.

Despite the short term gains, the hidden divergence suggests that price action will be forming a bottom in the near term.

In the event of a break down below 22.00, then we expect further consolidation or a possible decline further.

By Orbex


Fibonacci Retracements Analysis 03.04.2020 (BITCOIN, ETHEREUM)

Article By RoboForex.com

BTCUSD, “Bitcoin vs US Dollar”

As we can see in the H4 chart, the correctional uptrend has reached 50.0% The next upside target may be at 61.8% fibo (7987.75) but the divergence on MACD indicates a possible reverse soon. After completing the correction, the instrument may resume falling to break the support – the low at 3929.75.

BTCUSD
Risk Warning: the result of previous trading operations do not guarantee the same results in the future

In the H1 chart, the convergence on MACD made the pair start a new rising wave. The short-term upside targets may be inside the post-correctional extension area between 138.2% and 161.8% fibo at 7410.00 and 7685.00 respectively. The support is the low at 5851.00.

BITCOIN
Risk Warning: the result of previous trading operations do not guarantee the same results in the future

ETHUSD, “Ethereum vs. US Dollar”

In the H4 chart, ETHUSD has broken the consolidation range to the upside; right now, it is moving towards 38.2% and 50.0% fibo at 166.13 and 189.40 respectively. The support is the low at 89.80.

ETHEREUM
Risk Warning: the result of previous trading operations do not guarantee the same results in the future

The H1 chart shows a short-term rising wave towards 38.2% fibo at 166.13.

ETHUSD

Article By RoboForex.com

Attention!
Forecasts presented in this section only reflect the author’s private opinion and should not be considered as guidance for trading. RoboForex LP bears no responsibility for trading results based on trading recommendations described in these analytical reviews.

GBPUSD Continues To Maintain A Sideways Range

By Orbex

The British pound continues to trade flat, maintaining a sideways range since March 27.

The Stochastics also remains rather flat in the near term. This suggests that the momentum is still weak at the moment.

However, we expect to see a breakout off this level. We expect this breakout to be strong.

The bias remains mixed at the moment, opening the risk on either side.

By Orbex


Euro Maintains Declines Amid A Strong USD

By Orbex

The euro is down another 0.8% on the day. The declines could likely see a move to the lower support level at 1.0787.

There is scope for a modest rebound ahead of the decline to the support level. However, the resistance level at 1.1030 will be coming under a second retest.

As long as this resistance holds, the downside is likely. In the event that the support fails at 1.0787, then we expect a move lower to 1.0663.

By Orbex


Metals Rally Amidst Market Stabilisation

By Orbex

 Gold

– It’s been a much quieter week for the yellow metal on the back of the recent volatility we have seen in prior weeks. The ongoing coronavirus situation continues to dominate market news-flow and remains the key catalyst for price action currently.

Gold prices have recovered strongly off the March lows are now sitting in a holding pattern not far of the year to date highs.  With central banks around the world having announced fresh easing in recent weeks, gold prices have been supported. The Fed, in particular, has made the historic move of curing rates to just above 0% while also making the move into unlimited QE. This recent announcement has helped pull the Dollar back from the highs seen in March (index reached highs of 102.95), also helping support gold.

For now, the outlook remains mixed, but upside risks are clear. As gold reverts back to traditional safe-haven status following the stabilisation in asset markets over the last week, focus is on a further push higher. Incoming US data will be closely watched and could weigh further on USD. Traders should also keep an eye on equities prices here as the moves in gold are broadly tracking the moves we are seeing on the key US indices.

Gold Prices Holding Above Channel Top

Gold prices are trading back above the bull channel top, with the retest of the broken channel top providing support. While price remains above here, the focus is on a further push higher with a test of the year to date highs around 1700 the next technical marker to watch. To the downside, any break lower should find support into the structural support level around 1450.

Silver

Silver prices have been higher this week, benefiting from the pull-back in USD as well as the improvement in the equities landscape. Despite some loss of upside momentum, asset markets have stabilised over recent sessions, improving the outlook for silver. Silver prices also received a boost this week from Chinese manufacturing data. The Caixin manufacturing PMI saw the sector recovering into positive territory over March following a record plunge over the prior month.

Silver Prices Back Above 2019 Lows

The rally off the lows in silver has seen price breaking back above the 2015 lows of 13.6219 with the market currently challenging the 2019 lows around 14.3722. If price can establish a higher low here and move above the current highs there is a good chance of a more sustained recovery developing which would put the focus on a move back up to the 16.3502 level next.

By Orbex


EURUSD: bears gaining momentum

By Alpari.com

On Thursday the 2nd of April, trading on the euro closed down, with the EURUSD pair dropping to 1.0821. The US dollar ignored the record number of new unemployment benefit claims, which hit 6.6 million against a forecast of 3.5 million. Markets were already shaken after US President Donald Trump warned Americans on Tuesday to expect a tough two weeks ahead.

The number of confirmed coronavirus cases has surpassed 1 million. Demand for safe haven assets remains high, which is helping the dollar hold its own against the other major currencies.

Day’s news (GMT+3):

  • 10:50 France: Markit services PMI (Mar).
  • 10:55 Germany: Markit services PMI (Mar).
  • 11:00 Eurozone: Markit services PMI (Mar).
  • 11:30 UK: Markit services PMI (Mar).
  • 12:00 Eurozone: retail sales (Feb).
  • 15:30 US: unemployment rate (Mar), nonfarm payrolls (Mar).
  • 16:45 US: Markit services PMI (Mar).
  • 17:00 US: ISM non-manufacturing PMI (Mar).
  • 20:00 US: Baker Hughes US oil rig count.

Pic. 1Current situation:

At 6.6 million, the number of initial jobless claims in the last week was double the amount expected. The dollar, however, ignored this, and the bulls failed to induce a rebound from 1.0875. The pair continues its downwards trajectory along the D3 line.

There’s no prediction in today’s review, since all eyes are on the US employment market, particularly the nonfarm payrolls report. We don’t make predictions on payrolls day,  but we’re inclined to believe that the market will largely ignore employment data for March, since it hasn’t been having much of an effect over the last couple of weeks.

The pair is declining within a downwards channel. The LB line is acting as a dynamic support level. Pressure on the euro could increase ahead of the weekend as the bears set their sights on 1.0768 and 1.0697.

By Alpari.com

Will bad NFPs push the USD/JPY towards 105.00?

By Admiral Markets

Economic Events

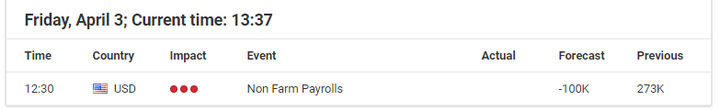
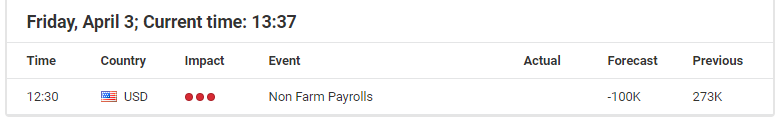
Source: Economic Events April 3, 2020 – Admiral Markets’ Forex Calendar

For weekly close, the eyes of forex traders around the globe will on the US employment report and the Non-Farm Payrolls (NFPs).

The ADP data on Wednesday, usually a good indication for today’s NFP’s, came in at only -27,000, while market participants expected it to be around -154,000 (and thus better than expected), but what counts can be read between the lines.

The ADP data only covered the period through March 12, being the period before the worst of the Coronavirus-induced economic freeze took place.

With that in mind, this new ADP dataset carries no good NFP-indication, and the risk of an acceleration of the bearish momentum in the USD/JPY in response to a print below expectations (currently at -100,000), driven by an even further drop in 10-year-US Treasury yields, seems a serious option.

On the other hand: if a new wave of risk-off hits global financial markets, under “normal” circumstances this would usually be a driver to lower the USD/JPY, this time such a risk-off has the potential to result in a sharp USD/JPY reversal. This being because we expect such a risk-off wave to go hand-in-hand with increasing demand for the US dollar given the global USD shortage.

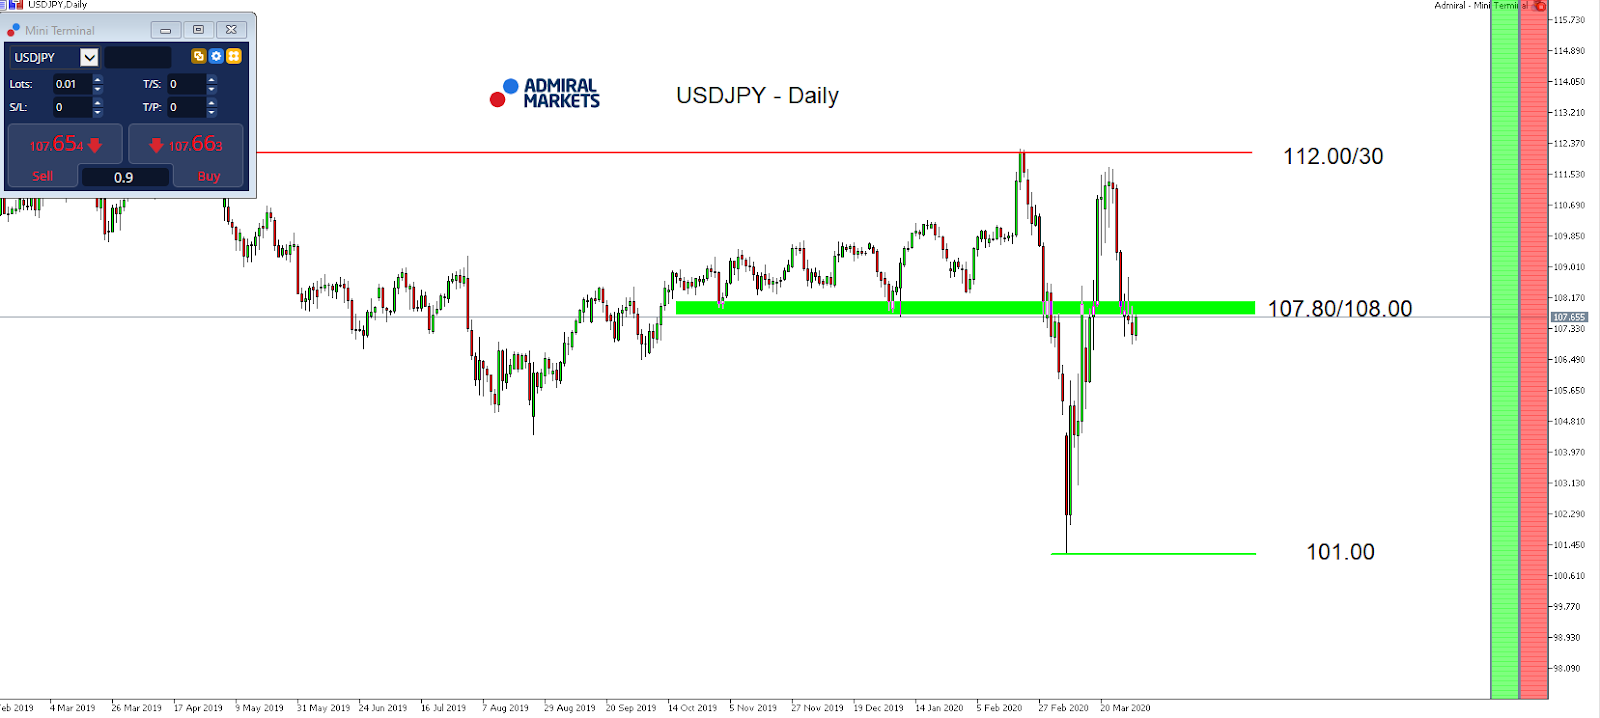
So, while we need to wait to see if such a risk-off hits the markets and result in a strong USD demand; a test, or probably even break of the region around 112.00/30 is still on the table.

Nevertheless, given the recent bearish momentum in the USD/JPY, we currently favour further bearish momentum, especially with a disappoint NFP print, bringing a test of the region around 105.00 into play:

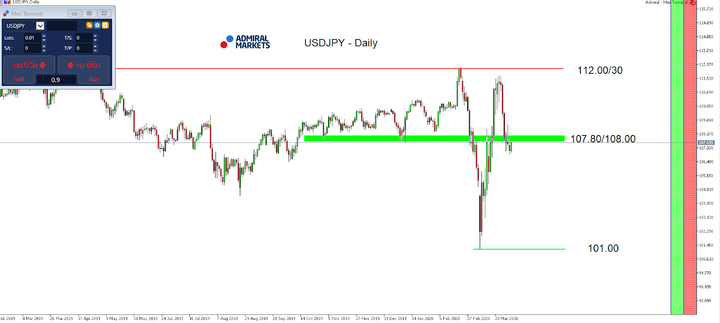
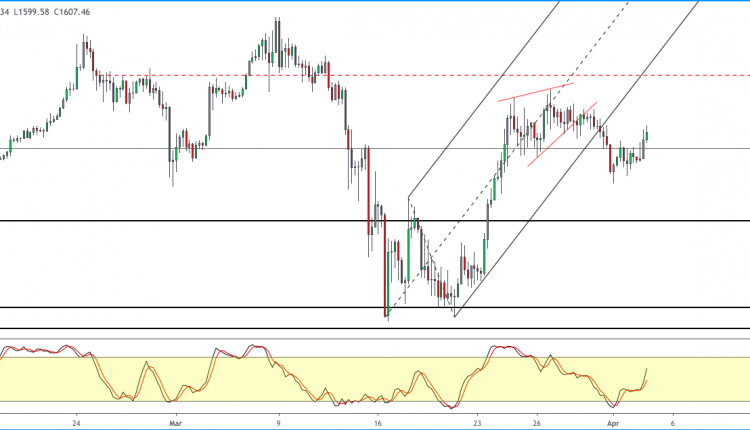
Source: Admiral Markets MT5 with MT5-SE Add-on USD/JPY Daily chart (between February 8, 2019, to April 2, 2020). Accessed: April 2, 2020, at 9:00pm GMT – Please note: Past performance is not a reliable indicator of future results, or future performance.

In 2015, the value of the USD/JPY increased by 0.5%, in 2016, it fell by 2.8%, in 2017, it fell by 3.6%, in 2018, it fell by 2.7%, in 2019, it fell by 0.85%, meaning that after five years, it was down by 9.2%.

Discover the world’s #1 multi-asset platform

Admiral Markets offers professional traders the ability to trade with a custom, upgraded version of MetaTrader 5, allowing you to experience trading at a significantly higher, more rewarding level. Experience benefits such as the addition of the Market Heat Map, so you can compare various currency pairs to see which ones might be lucrative investments, access real-time trading data, and so much more. Click the banner below to start your FREE download of MT5 Supreme Edition!

Download MetaTrader 5 and begin trading today!

Disclaimer: The given data provides additional information regarding all analysis, estimates, prognosis, forecasts or other similar assessments or information (hereinafter “Analysis”) published on the website of Admiral Markets. Before making any investment decisions please pay close attention to the following:

  1. This is a marketing communication. The analysis is published for informative purposes only and are in no way to be construed as investment advice or recommendation. It has not been prepared in accordance with legal requirements designed to promote the independence of investment research, and that it is not subject to any prohibition on dealing ahead of the dissemination of investment research.
  2. Any investment decision is made by each client alone whereas Admiral Markets shall not be responsible for any loss or damage arising from any such decision, whether or not based on the Analysis.
  3. Each of the Analysis is prepared by an independent analyst (Jens Klatt, Professional Trader and Analyst, hereinafter “Author”) based on the Author’s personal estimations.
  4. To ensure that the interests of the clients would be protected and objectivity of the Analysis would not be damaged Admiral Markets has established relevant internal procedures for prevention and management of conflicts of interest.
  5. Whilst every reasonable effort is taken to ensure that all sources of the Analysis are reliable and that all information is presented, as much as possible, in an understandable, timely, precise and complete manner, Admiral Markets does not guarantee the accuracy or completeness of any information contained within the Analysis. The presented figures refer that refer to any past performance is not a reliable indicator of future results.
  6. The contents of the Analysis should not be construed as an express or implied promise, guarantee or implication by Admiral Markets that the client shall profit from the strategies therein or that losses in connection therewith may or shall be limited.
  7. Any kind of previous or modeled performance of financial instruments indicated within the Publication should not be construed as an express or implied promise, guarantee or implication by Admiral Markets for any future performance. The value of the financial instrument may both increase and decrease and the preservation of the asset value is not guaranteed.
  8. The projections included in the Analysis may be subject to additional fees, taxes or other charges, depending on the subject of the Publication. The price list applicable to the services provided by Admiral Markets is publicly available from the website of Admiral Markets.
  9. Leveraged products (including contracts for difference) are speculative in nature and may result in losses or profit. Before you start trading, you should make sure that you understand all the risks.

By Admiral Markets