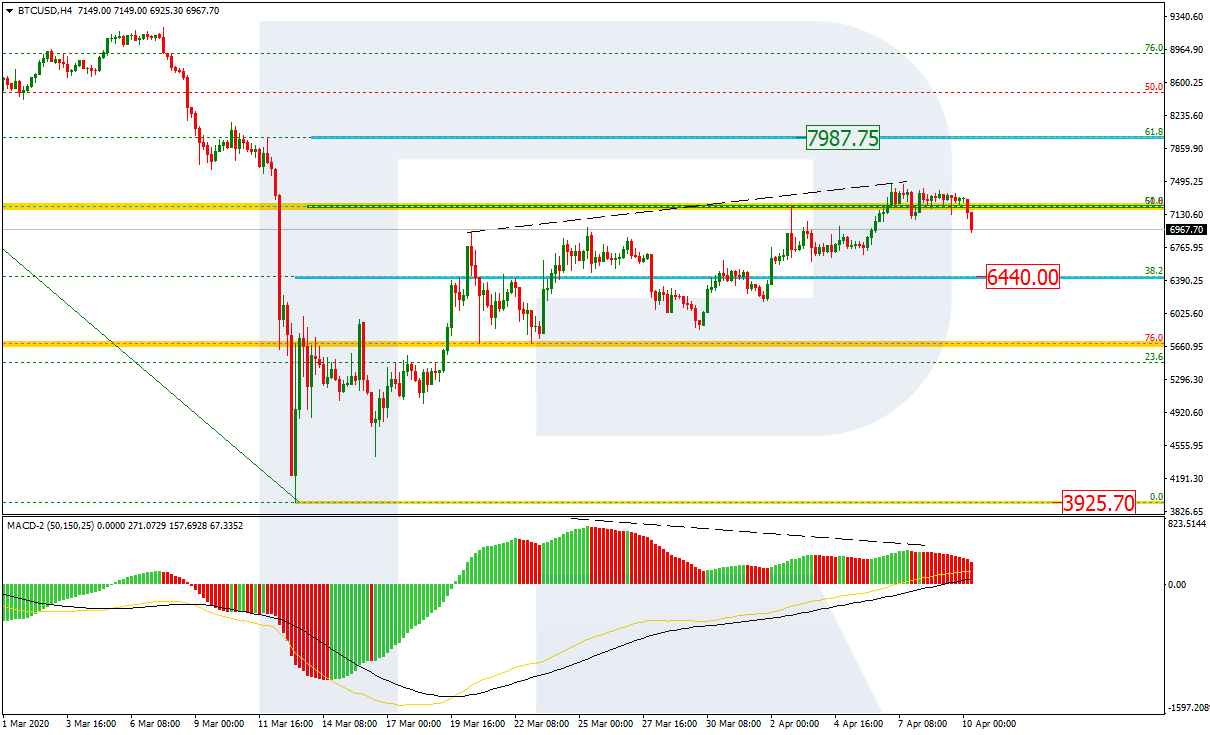
As we can see in the H4 chart, BTCUSD has completed the correction at 50.0% fibo. Another signal to confirm a reversal is a divergence on MACD. However, as long as there is no “Black Cross” and the pair doesn’t break the support at 6440.00, there might be a possibility of further growth towards 61.8% fibo at 7987.50. Still, after breaking the current support, the instrument may continue trading downwards to reach the low at 3929.70.
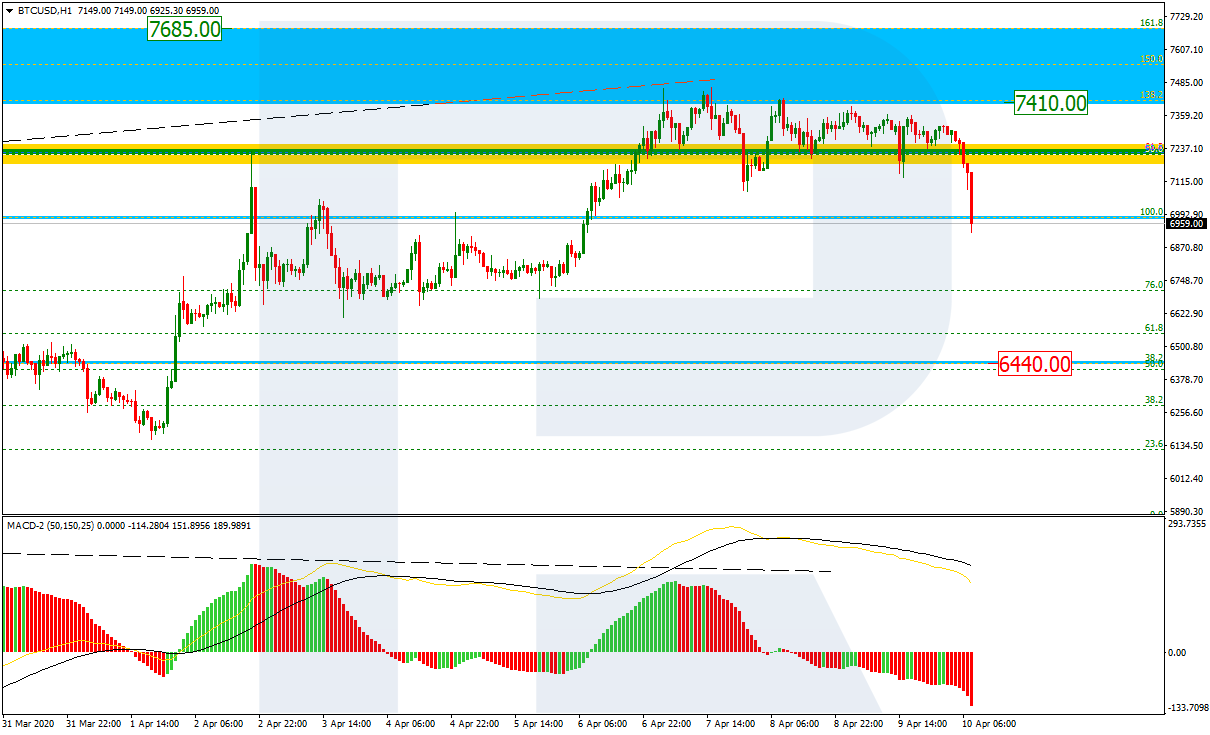
In the H1 chart, the previous rising only “touched” the post-correctional extension area between 138.2% and 161.8% fibo at 7410.00 and 7685.00 respectively, but couldn’t go any further. After the divergence, the instrument started a new decline towards the support at 38.2% fibo (6440.00).
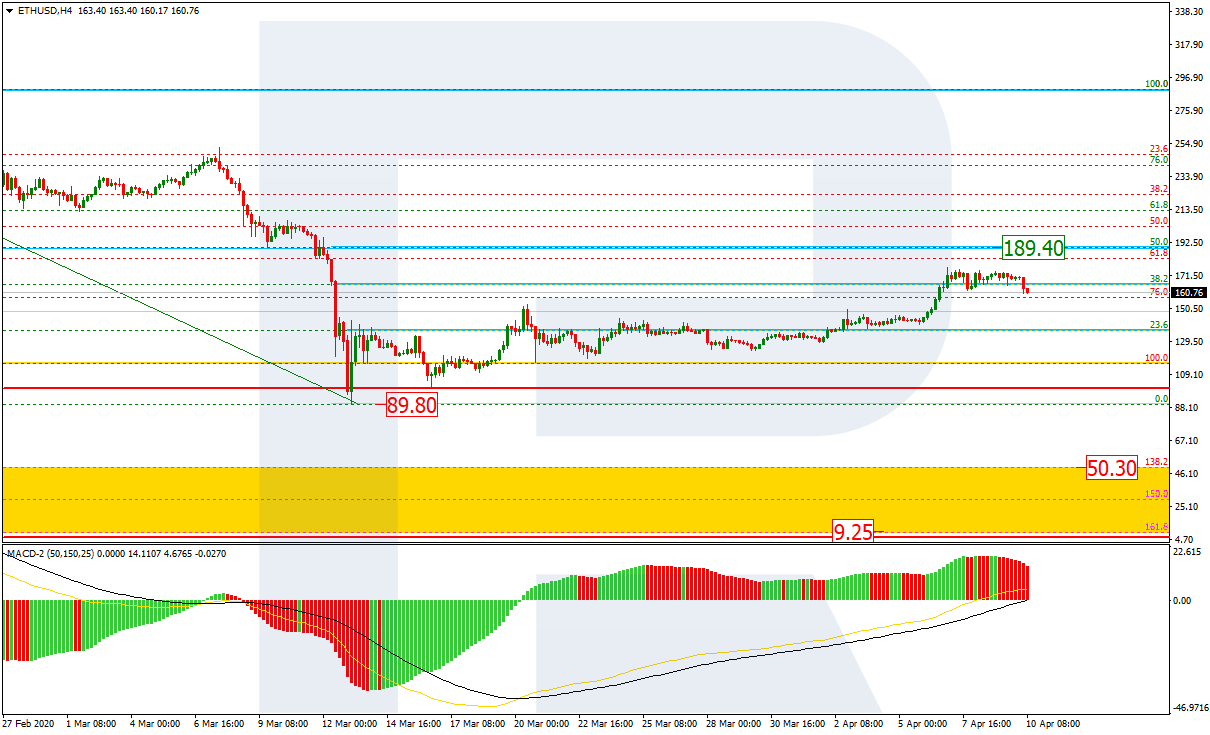
ETHUSD, “Ethereum vs. US Dollar”
As we can see in the H4 chart, after reaching 38.2% fibo, ETHUSD is starting a new decline. However, it’s too early to call this decline a reversal, because the price may yet grow towards 50.0% fibo at 189.40. If the pair does reverse, the first downside target will be the low at 89.90. After breaking the low, the pair may fall to reach the post-correctional extension area between 138.2% and 161.8% fibo at 50.30 and 9.25 respectively.
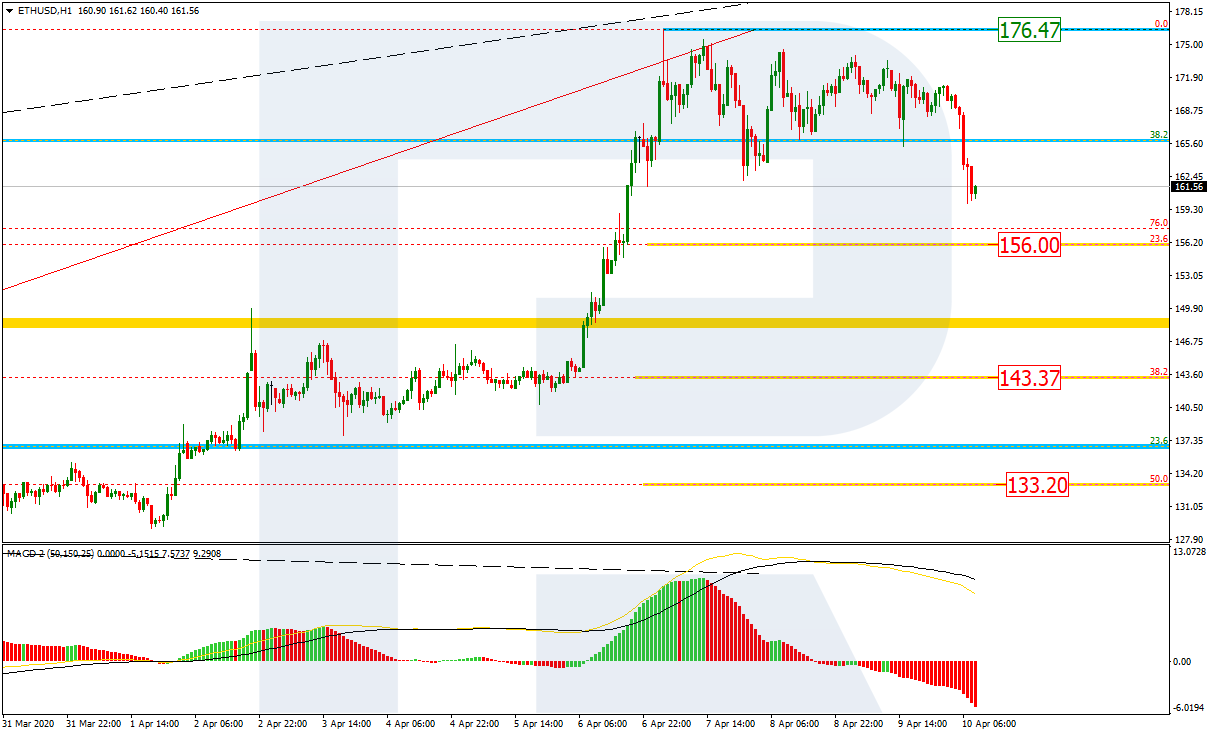
The H1 chart shows a new decline after the divergence. The downside targets may be 23.6%, 38.2%, and 50.0% fibo at 156.00, 143.37, and 133.20 respectively.
Attention! Forecasts presented in this section only reflect the author’s private opinion and should not be considered as guidance for trading. RoboForex LP bears no responsibility for trading results based on trading recommendations described in these analytical reviews.
Purchases prevail on the EUR/USD currency pair. Quotes have updated local highs. Greenback demand has weakened amid Fed stimulus measures, as well as amid an increase in initial jobless claims. The regulator has launched a large-scale program $2.3 trillion worth to support local administrations, small and medium-sized businesses, to help the US economy cope with the COVID-19 epidemic. At the moment, the trading instrument is consolidating in the range of 1.09000-1.09500. The single currency has the potential for further growth. We expect economic reports from the US. Positions should be opened from key support and resistance levels.
The Economic News Feed for 10.04.2020
At 15:30 (GMT+3:00), the core consumer price index will be published in the United States. Trading activity may be reduced due to holidays in most countries of the world.
Indicators do not give accurate signals: 50 MA has crossed 200 MA.
The MACD histogram is in the positive zone, indicating the bullish sentiment.
Stochastic Oscillator is near the overbought zone, the %K line has crossed the %D line. There are no signals at the moment.
Trading recommendations
Support levels: 1.09000, 1.08350, 1.07750
Resistance levels: 1.09500, 1.10100, 1.10350
If the price fixes above the level of 1.09500, further growth of the EUR/USD currency pair is expected. The movement is tending to 1.10000-1.10200.
An alternative could be a drop in the EUR/USD quotes to 1.08600-1.08400.
The GBP/USD currency pair
Technical indicators of the currency pair:
Prev Open: 1.23753
Open: 1.24480
% chg. over the last day: +0.52
Day’s range: 1.24391 – 1.24786
52 wk range: 1.1466 – 1.3516
The GBP/USD currency pair shows positive dynamics. The British pound has reached key extremes. At the moment, GBP/USD quotes are testing the resistance of 1.24800. The 1.24250 mark is already a “mirror” support. Greenback demand is still at a fairly low level. A trading instrument has the potential for further growth. We recommend opening positions from key levels.
The news feed on the UK economy is calm.
Indicators point to the power of buyers: the price has fixed above 50 MA and 100 MA.
The MACD histogram is in the positive zone, indicating the bullish sentiment.
Stochastic Oscillator is in the neutral zone, the %K line has crossed the %D line. There are no signals at the moment.
Trading recommendations
Support levels: 1.24250, 1.23550, 1.22900
Resistance levels: 1.24800, 1.25500
If the price fixes above 1.24800, further growth of GBP/USD quotes is expected. The movement is tending to 1.25300-1.25600.
An alternative could be a decrease in the GBP/USD currency pair to 1.23900-1.23500.
The USD/CAD currency pair
Technical indicators of the currency pair:
Prev Open: 1.40137
Open: 1.39720
% chg. over the last day: -0.18
Day’s range: 1.39442 – 1.40086
52 wk range: 1.2949 – 1.4668
The USD/CAD currency pair is being traded in a flat. The technical pattern is ambiguous. At the moment, quotes are testing the support level of 1.39400. The 1.40100 mark is the nearest resistance. Investors expect additional drivers. Demand for the US dollar has weakened. A trading instrument is tending to decline. We recommend paying attention to the dynamics of oil quotes. Positions should be opened from key levels.
The news feed on Canada’s economy is calm.
Indicators signal the power of sellers: the price has fixed below 50 MA and 100 MA.
The MACD histogram is in the negative zone, indicating the bearish sentiment.
Stochastic Oscillator is in the oversold zone, the %K line has crossed the %D line. There are no signals at the moment.
Trading recommendations
Support levels: 1.39400, 1.39000
Resistance levels: 1.40100, 1.40800, 1.41450
If the price fixes below 1.39400, a further drop in the USD/CAD quotes is expected. The movement is tending to 1.39000-1.38800.
An alternative could be the growth of the USD/CAD currency pair to 1.40500-1.40800.
The USD/JPY currency pair
Technical indicators of the currency pair:
Prev Open: 108.824
Open: 108.430
% chg. over the last day: -0.24
Day’s range: 108.328 – 108.587
52 wk range: 101.19 – 112.41
USD/JPY quotes have been declining after a prolonged consolidation. The trading instrument has updated local lows. At the moment, the following key support and resistance levels can be identified: 108.200 and 108.600, respectively. The USD/JPY currency pair has the potential for further decline. We recommend paying attention to the dynamics of the US government bond yield. Positions should be opened from key levels.
The news feed on Japan’s economy is calm.
Indicators do not give accurate signals: the price has crossed 100 MA.
The MACD histogram is in the negative zone, indicating the bearish sentiment.
Stochastic Oscillator is in the neutral zone, the %K line has crossed the %D line. There are no signals at the moment.
Trading recommendations
Support levels: 108.200, 107.800, 107.500
Resistance levels: 108.600, 109.000, 109.350
If the price fixes below 108.200, a further drop in the USD/JPY quotes is expected. The movement is tending to 107.900-107.700.
An alternative could be the growth of the USD/JPY currency pair to 108.900-109.200.
With onshore storage becoming increasingly scarce, the volume of oil being stored on ships will continue to rise, delivering a once-in-a-generation opportunity for oil tankers, according to McAlinden Partners.
The oil market flipped into contango in January, indicating an oversupply of the commodity. On January 30, while February futures were priced at $52.14, May Nymex crude settled at $52.23, creating a 9-cent per barrel contango. Since then, the 3-month contango has ballooned to a whopping $7.03 per barrel. With onshore storage becomes increasingly scarce, the volume of oil being stored on ships will continue to rise, delivering a once-in-a-generation opportunity for oil tankers.
There are now roughly 3 billion people in some form of a lockdown around the world, resulting in an unprecedented drop in global demand for jet fuel, gasoline and diesel. That alone would have been enough to send oil prices plunging, but Saudi Arabia’s decision to start a price war with rival producers and flood the market with crudejust as U.S. output had hit a recordhas made things a lot worse.
The occurrence of a supply surge in the midst of a demand shock has created such a pronounced structural imbalance that the world is awash in oil. An estimated 20 million barrels a day, one in five produced, isn’t being consumed.
The Contango Opportunity
When the market for a storable commodity like oil is balanced, a contract for today’s delivery will be priced higher than a contract for next month’s delivery. The contract for next month’s delivery has a lower price to account for the cost of storing and insuring the cargo until it is delivered to the buyer. The futures curve for a balanced oil market is therefore downward-sloping. When there’s a surplus of oil, the futures curve flips into contango, whereby a contract for deferred delivery is priced higher than a nearby contract. This results in an upward-sloping forward curve.
Oil went into contango some time in January. On January 30, for example, while February futures were priced at $52.14, May Nymex crude settled at $52.23, creating a 9-cent per barrel contango. At April 1’s close, crude futures for May delivery were trading at $21.20 while August futures settled at $28.18. This means the 3-month contango has ballooned from $0.09 per barrel to $7.03 per barrel in just a couple of months.
The biggest reason for this jump is skyrocketing storage costs.
In a deep contango market, like the one we are currently experiencing, a trader can make money by buying an oil contract at the discounted spot price and then selling for future delivery, which commands a higher price. As long as the price spread between the two contracts is greater than the cost of storage, the trader can make a profit. But, as that trade gets repeated, storage costs will invariably rise.
Many oil producers too have decided to put their oil in storage and wait for prices to go up before selling. All of that oil has to be stored somewhere. The same goes for oil importers who are taking advantage of low prices to top up their inventories. They too need to put the oil somewhere.
The sudden wave of storage demand by traders, producers and importers, and the limited storage capacity available globally are factors contributing to the surge in storage costs, both onshore and offshore. Massive storage tanks are filling up in locations as diverse as Italy and the United Arab Emirates; The most important storage areas in the United States were already half full in mid-March; Western Canada’s 40 million barrels of storage is more than three quarters full. Meanwhile, the volume of oil stored on ships increased by 25% in March.
Data intelligence company Kpler has been using satellite images to calculate how much oil is on ships and in tank farms. Over a recent weekend, the company detected 10 million barrels of oilabout 10% of the world’s daily consumption in normal timesflowing into storage facilities.
Consulting firm IHS Markit is predicting the world will run out of places to store oil in as little as three months. This is based on the supposition that inventories are set to increase by 1.8 billion barrels in the first half of 2020 and there are only 1.6 billion barrels of storage capacity still available.
A Winning Quarter for Oil Tankers
The growing oil glut is proving to be a “once-in-a-generation” opportunity for ships that are in the business of transporting as well as storing oil. Onshore storage is typically cheaper than floating storage. But as onshore space has become scarcer, demand has shifted towards floating storage, driving up prices in that segment of the shipping industry.
VLCC time charter rates for floating storage cost about $40,000 per day at the start of March. By the end of March, rates had tripled to $120,000 per day. The astounding thing is that, even at these freight rates, traders can still lock in a hefty profit if they buy oil at current prices.
The scramble for storage is just part of the story. Oil purchased by importers has to be transported to destination, and that has also contributed to the run on tankers. Reuters reports that freight rates for a VLCC or “Very Large Crude Carrier” along the Middle East Gulf to China route were assessed at about $180,000 a day toward the end of March, up from a daily rate of $90,000 earlier that month. If these rates can be sustained for a couple more months, 2Q 2020 could turn out to be one of the most profitable quarters in history for tanker owners.
How to Gain Exposure to Oil Tankers
The most popular vessel for long-haul trading and floating storage is the VLCC because it is capable of transporting up to 2M barrels of oil. The companies with the greatest concentration of VLCC fleets are DHT Holdings (DHT), Euronav (EURN), International Seaways (INSW) and Frontline (FRO).
Over the past month, their stocks have returned +38% for DHT, +21% for EURN, +20% for INSW, and +17% for FRO. In comparison, the S&P 500 has returned -17%.
Surging demand for VLCC is also firming up demand for midsize tonnage tankers such as Suezmax and Aframax vessels, which respectively hold about 1 million barrels and 750,000 barrels per ship. Some companies with strong exposure in this category include Nordic American Tankers (NAT), Teekay Tankers (TNK) and Diamond S Shipping (DSSI).
What Happens When Storage is Full
The upshot of the storage problem is that as space becomes harder to find, some producers will be forced to shut off wells which should provide some support for oil prices in the future. That’s already starting to happen.
This content was delivered to McAlinden Research Partners clients on April 2. To receive all of MRP’s insights in your inbox Monday – Friday, follow this link for a free 30-day trial.
McAlinden Research Partners (MRP) provides independent investment strategy research to investors worldwide. The firm’s mission is to identify alpha-generating investment themes early in their unfolding and bring them to its clients’ attention. MRP’s research process reflects founder Joe McAlinden’s 50 years of experience on Wall Street. The methodologies he developed as chief investment officer of Morgan Stanley Investment Management, where he oversaw more than $400 billion in assets, provide the foundation for the strategy research MRP now brings to hedge funds, pension funds, sovereign wealth funds and other asset managers around the globe.
Disclosure: 1) McAlinden Research Partners disclosures are below. 2) The following companies mentioned in this article are billboard sponsors of Streetwise Reports: None. Click here for important disclosures about sponsor fees. The information provided above is for informational purposes only and is not a recommendation to buy or sell any security. 3) Statements and opinions expressed are the opinions of the author and not of Streetwise Reports or its officers. The author is wholly responsible for the validity of the statements. The author was not paid by Streetwise Reports for this article. Streetwise Reports was not paid by the author to publish or syndicate this article. Streetwise Reports requires contributing authors to disclose any shareholdings in, or economic relationships with, companies that they write about. Streetwise Reports relies upon the authors to accurately provide this information and Streetwise Reports has no means of verifying its accuracy. 4) This article does not constitute investment advice. Each reader is encouraged to consult with his or her individual financial professional and any action a reader takes as a result of information presented here is his or her own responsibility. By opening this page, each reader accepts and agrees to Streetwise Reports’ terms of use and full legal disclaimer. This article is not a solicitation for investment. Streetwise Reports does not render general or specific investment advice and the information on Streetwise Reports should not be considered a recommendation to buy or sell any security. Streetwise Reports does not endorse or recommend the business, products, services or securities of any company mentioned on Streetwise Reports. 5) From time to time, Streetwise Reports and its directors, officers, employees or members of their families, as well as persons interviewed for articles and interviews on the site, may have a long or short position in securities mentioned. Directors, officers, employees or members of their immediate families are prohibited from making purchases and/or sales of those securities in the open market or otherwise from the time of the interview or the decision to write an article until three business days after the publication of the interview or article. The foregoing prohibition does not apply to articles that in substance only restate previously published company releases.
McAlinden Research Partners: This report has been prepared solely for informational purposes and is not an offer to buy/sell/endorse or a solicitation of an offer to buy/sell/endorse Interests or any other security or instrument or to participate in any trading or investment strategy. No representation or warranty (express or implied) is made or can be given with respect to the sequence, accuracy, completeness, or timeliness of the information in this Report. Unless otherwise noted, all information is sourced from public data.
McAlinden Research Partners is a division of Catalpa Capital Advisors, LLC (CCA), a Registered Investment Advisor. References to specific securities, asset classes and financial markets discussed herein are for illustrative purposes only and should not be interpreted as recommendations to purchase or sell such securities. CCA, MRP, employees and direct affiliates of the firm may or may not own any of the securities mentioned in the report at the time of publication.
– In this section of our multi-part research post centered around our Adaptive Fibonacci Price Modeling system’s expectations, we are focusing on the NQ (NASDAQ futures) and the future expected price rotations. As we discussed earlier, in Part I, Fibonacci price theory teaches us that price must always attempt to establish new price highs or new price lows within a trend. Reversals happen when price fails to continue establishing new price highs or new price lows and breaks above or below a recent critical price level.
First, we’ll focus on the major Fibonacci Price Pivots and how to identify and use them with the Fibonacci Price Theory. Major Price Pivots are points in time where a major new High or Low price is established that becomes a critical price top or bottom. Often, within extended trending, a minor price pivot will become a major price pivot simply because the price trend has extended for many weeks or months without establishing any type of moderate price rotation. The reason we could consider a minor price pivot as a major price pivot is that, within the extended trend, we attempt to identify where price setup a “unique low” or “unique high” as a point of support or resistance within the trend.
Before we continue, be sure to opt-in to our free market trend signals before closing this page, so you don’t miss our next special report!
Weekly Nasdaq Chart – MAJOR PIVOTS
Here is a Weekly NQ chart highlighting the major Fibonacci Price Pivots. Notice the Major Low Pivot in late November 2019 that was identified as a “minor to major” pivot. These major price pivots become a road map telling us where price MUST go in order to establish a new trend or to change trend direction.
Currently, the bearish trend is clearly identifiable because the price has recently broken below the last major Fibonacci Low Price Pivots and established a “new price low”. In order for us to consider this bearish trend is completed or over, the price would have to rally all the way back to break the move recent major Fibonacci High Price Pivot (near the recent peak). A couple of weeks go I published a PDF guide on how to identify market trends both short-term and long-term using some basic indicators.
Nasdaq Weekly Chart – MINOR PIVOTS
Now, let’s learn about the minor Fibonacci Price Pivots…
This next Weekly NQ chart highlights the minor Fibonacci Price Pivots. These are the price lows and highs that do not constitute a “critical price high or low” on the chart. They are still valid for us in our understanding of Fibonacci price theory and where future price may attempt to rally or selloff to and they help skilled traders in understanding the true nature of price activity and structure.
Minor Fibonacci Price Pivots are intermediate unique high or low price levels that set up the “wave structure” in price that we are attempting to illustrate to you. When price moves higher, a series of new higher highs and higher lows usually sets up within that trend. When price moves lower, a series of new lower lows and lower highs usually set up within that trend. These minor pivots are a method of tracking this type of price activity and a process of learning the major and minor price levels that usually become very important in determining what is really happening in price structure.
Combining Both Minor and Major Pivots
Now, we’ll combine these major and minor pivots onto one chart to grasp the bigger price structure.
Once we combine these major and minor Fibonacci Price Pivots onto one chart, you should be able to see the “road-map” of the structure of price fairly easily. You should be able to see how Major Pivots setup massive critical price structures (tops and bottoms) that establish the major support and resistance levels in price. These also become major trigger levels for broader trends and reversals in price. You should also be able to see how the Minor Pivot Levels offer intermediate price guidance and shorter-term support and resistance as price attempts to work through the Fibonacci Price Theory Structure.
Remember, the Fibonacci Price Theory suggests that price is always attempting to reach new highs or new lows within a trend. Thus, if it is not attempting to reach new highs, then it must be an attempt to reach new lows. These pivot structures are the keys to understanding the true Fibonacci price theory.
Concluding Thoughts:
Currently, The NQ would have to rally all the way back above 9750, the most recent Major Fibonacci Pivot High, in order to qualify for a new Longer-term Bullish trend. We expect the price of the NQ will rotate lower in the near future simply because the most recent confirmed price trend was the breakdown low in early 2020 that broke below the past three major Fibonacci Low Price Pivots.
Remember the Fibonacci Price Theory tells us that Price is always attempting to establish new price highs or lows – all the time. Thus, if the newest price low has broken below the past Major Low Price Pivots, then the trend is considered Bearish until price confirms it has broken above the most recent Major High Price Pivot.
As you continue to learn Fibonacci Price Theory and apply these techniques, remember that these types of price structures are fundamental components to the much broader technical analysis techniques and modeling systems we use every day for our clients. We want to help you learn to become a better trader and learn to identify solid trading signals.
As a technical analyst and trader since 1997, I have been through a few bull/bear market cycles in stocks and commodities. I believe I have a good pulse on the market and timing key turning points for investing and short-term swing traders. 2020 is going to be an incredible year for skilled traders. Don’t miss all the incredible moves and trade setups.
I hope you found this informative, and if you would like to get a pre-market video every day before the opening bell, along with my trade alerts. These simple to follow ETF swing trades have our trading accounts sitting at new high water marks yet again this week, not many traders can say that this year. Visit my Active ETF Trading Newsletter.
We all have trading accounts, and while our trading accounts are important, what is even more important are our long-term investment and retirement accounts. Why? Because they are, in most cases, our largest store of wealth other than our homes, and if they are not protected during a time like this, you could lose 25-50% or more of your entire net worth. The good news is we can preserve and even grow our long term capital when things get ugly like they are now and ill show you how and one of the best trades is one your financial advisor will never let you do because they do not make money from the trade/position.
If you have any type of retirement account and are looking for signals when to own equities, bonds, or cash, be sure to become a member of my Long-Term Investing Signals which we issued a new signal for subscribers.
Ride my coattails as I navigate these financial markets and build wealth while others lose nearly everything they own during the next financial crisis.
The euro currency is rising back following a pullback from the earlier session.
Price action broke past the previous highs near 1.0905. This could potentially confirm further upside that could push prices toward the resistance level of 1.1055 and 1.1030.
To the downside, we could expect the price level near 1.0905 will be coming out as support in the short term.
But a breakdown below this level will signal a move back to the 1.0787 level.
Recent Japanese economic data were mixed. Current account surplus widened in February while machinery orders decline accelerated. The Tankan index for big manufacturers’ sentiment fell to a seven-year low of -8 in the first quarter of 2020 from 0 in the prior period, though it still came above market expectations of -10. At the same time large firms indicated plans to rase capital expenditures by 1.8%, down from 6.8% in the previous quarter but above a 1.1% expected decline. And while machinery orders decline accelerated in March to 2.4% over year from 0.3% in February, the decline was smaller than feared. Meanwhile machine tool orders decline accelerated sharply next month to 40.8% over year from 29.6% in February. However, Japan’s government unveiled a monetary and fiscal stimulus package on April 7 to combat coronavirus impact. The total package is worth 108 trillion yen ($990 billion), equal to 20% of Japan’s gross domestic product, with direct fiscal spending amounting to 39.5 trillion yen, or about 7% of the GDP. These measures, together with monetary stimulus program by other developed economies including the US and European Union, buoyed investors’ confidence, leading to recovery in equity market.
– Brent fell by 4.1 percent and is struggling to keep its head above the psychological $30 level, while WTI edged closer to the $20 line plunging 9.3 per cent, as markets expressed their misgivings over the tentative OPEC+ deal to cut supply by 10 million barrels per day (b/d) over the next two months. Such cuts are also conditioned on Mexico following suit, but it has refused outright to comply with the proposed reduction to its production levels.
Even if Mexico were to perform an about-turn and agree to lower its production by the prescribed 400,000 b/d, the 10+ million b/d reduction in global supplies won’t be enough to fully offset the huge drop in demand, which is estimated to be more than 30 million b/d.
Price action in the Oil markets indicates that hope is diminishing over the collective ability of the major producing nations to trigger a meaningful supply-side intervention over the near-term. The case for a forceful attempt to rebalance global Oil markets remains as strong as ever, at a time when demand has been left decimated by the coronavirus. Unless there are coordinated supply cuts on a global scale, Oil prices will be left subject to demand-side woes with declines likelier than gains in the interim and an inevitable drop to test the recent 18-year lows.
Markets lackluster ahead of looming tests to risk appetite
The upward momentum seen in US stocks, enjoying their best week since 1974, failed to carry over into Asian markets as regional indexes are mixed amid subdued market activity on Good Friday. The easing US Dollar is alleviating the recent pressure on Asian currencies and Gold, with the latter climbing towards the psychological level of $1700.
Global investors are still weighing up signs of economic turmoil against the support measures rolled out across major economies. News of the Fed’s latest round of emergency aid worth $2.3 trillion, along with Europe’s proposed $590 billion economic rescue package, may still tide over risk assets into the coming week. However, the recent gains in US stocks are set to be tested when earnings season kicks off on Tuesday. Dire warnings of Wall Street’s earnings outlook could ultimately prove the unravelling of the stock market’s nascent bull run.
The staggering buildup in US jobless claims, now numbering 16.8 million in the past three weeks, is a stark reminder to the markets that at least from an economic perspective, things are set to get worse before they get better. The coming week’s data releases of US retail sales, manufacturing and especially the weekly jobless claims could hold significant sway over broader risk sentiment amid despairing questions over the depth and breadth of the economic fallout due to Covid-19.
Disclaimer: The content in this article comprises personal opinions and should not be construed as containing personal and/or other investment advice and/or an offer of and/or solicitation for any transactions in financial instruments and/or a guarantee and/or prediction of future performance. ForexTime (FXTM), its affiliates, agents, directors, officers or employees do not guarantee the accuracy, validity, timeliness or completeness, of any information or data made available and assume no liability as to any loss arising from any investment based on the same.
US stock market extended gains on Thursday as optimism over Fed’s announcement of $2.3 trillion expansion of its financing program offset concerns after dismal job loss claims data. The S&P 500 rose 1.4% to 2789.82. The Dow Jones industrial average advanced 1.2% to 23719.37. Nasdaq composite index added 0.8% to 8153.58. The dollar weakening resumed as Labor Department reported 6.6 million Americans filed for unemployment insurance for the first time last week, while Federal Reserve announced a new lending program to provide $600 billion support for midsize businesses and $500 billion for states, counties and cities. The live dollar index data show the ICE US Dollar index, a measure of the dollar’s strength against a basket of six rival currencies, fell 0.6% to 99.55 and is lower currently. US exchanges are closed today in observance of Good Friday, and those in Europe will also be closed for Easter Monday.
FTSE 100 led European indexes’ advance
European stocks recovered on Thursday. EUR/USD joined GBP/USD’s accelerated climbing yesterday with both pairs higher currently. The Stoxx Europe 600 index advanced 1.4% led by travel and leisure shares. Germany’s DAX 30 gained 2.2% to 10564.74. France’s CAC 40 added 1.4% while UK’s FTSE 100 rose 2.9% to 5842.66 as the Bank of England agreed to temporarily finance UK government borrowing.
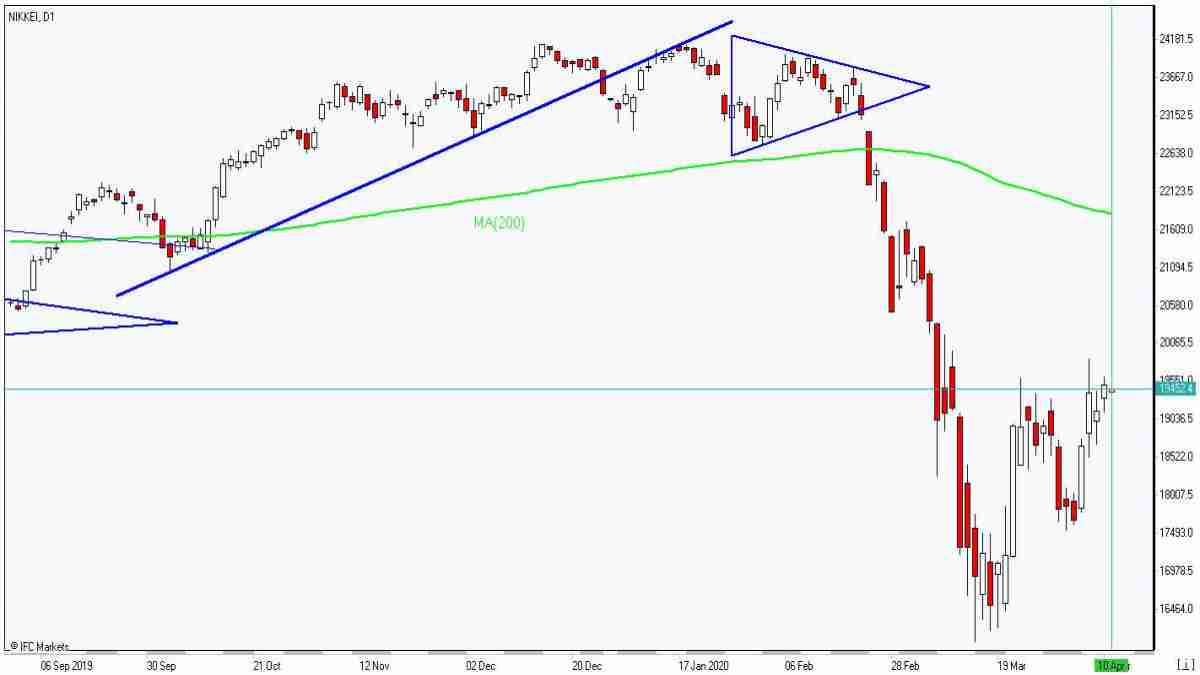
Nikkei rises while China’s stocks fall
Asian stock indices are mixed today in light trading after markets shrugged off an additional 6.6 million jobless claims in US. Nikkei ended 0.8% higher at 19498.50 despite continuing yen slide against the dollar. Markets in China are falling as China’s consumer inflation slowed in March: the Shanghai Composite Index is down 1% while markets in Hong Kong and Australia are closed for Good Friday.
Brent futures prices ended lower yesterday erasing earlier gains after reports Mexico is holding up a deal by the world’s largest oil producers to curb production. The Organization of the Petroleum Exporting Countries and its allies agreed to cut production by 10 million barrels a day in May and June in the teleconference meeting. Saudi Arabia and Russia will each limit their production levels to 8.5 million barrels a day, with all members agreeing to cut supply by 23%. However Mexican officials disagreed with the proposed cuts to its production, and walked out of videoconference negotiations. Delegates still hope to convince Mexico in further talks today. June Brent crude lost 4.1% to $31.48 a barrel on Thursday. Exchanges are closed today in US and Europe.
Gold rallies as Dollar pulls back
Gold prices are extending gains today. Prices jumped yesterday: gold for June delivery rose 4.1% to $1752.80 an ounce on Thursday.
Note: This overview has an informative and tutorial character and is published for free. All the data, included in the overview, are received from public sources, recognized as more or less reliable. Moreover, there is no guarantee that the indicated information is full and precise. Overviews are not updated. The whole information in each overview, including opinion, indicators, charts and anything else, is provided only for familiarization purposes and is not financial advice or а recommendation. The whole text and its any part, as well as the charts cannot be considered as an offer to make a deal with any asset. IFC Markets and its employees under any circumstances are not liable for any action taken by someone else during or after reading the overview.
Jordan Trimble of Skyharbour Resources lays out the reasons why the uranium bear market is coming to an end, and why his company is poised to take advantage of the upturn, in this conversation with Maurice Jackson of Proven and Probable.
Maurice Jackson: Today we highlight a preeminent uranium and thorium explorer in Canada’s Athabasca Basin. Joining us for conversation is Jordan Trimble of Skyharbour Resources Ltd. (SYH:TSX.V; SYHBF:OTCQB).
Always a pleasure to have you on our program, sir. You have some exciting updates for us regarding drilling. But before we begin, Mr. Trimble, please introduce Skyharbour Resources and the opportunity the company presents to the market.
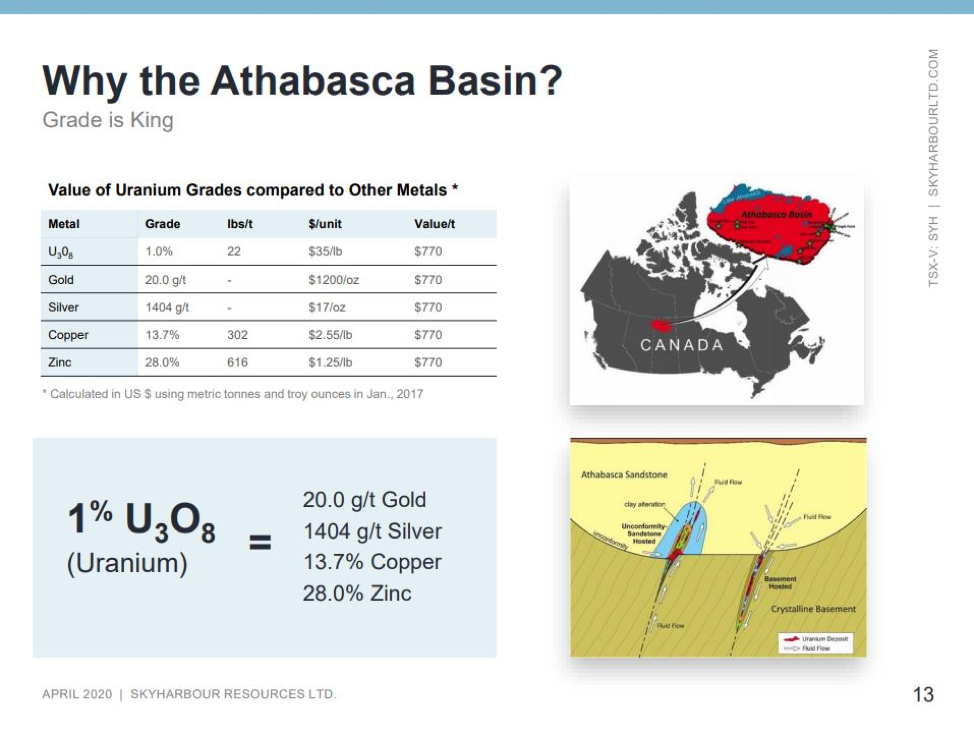
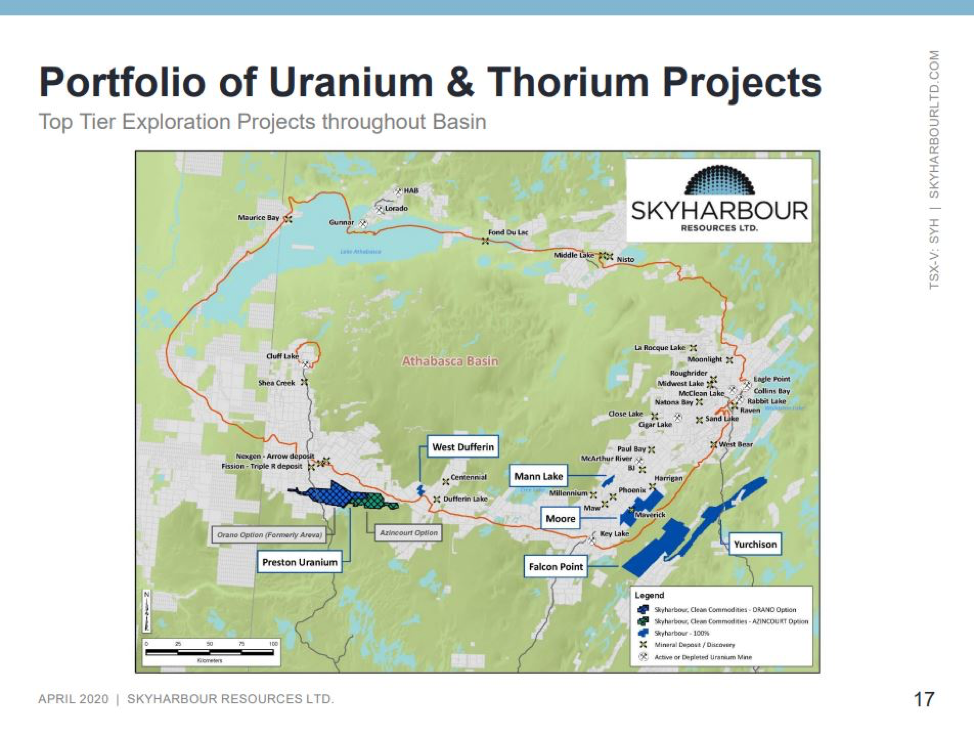
Jordan Trimble: Skyharbour Resources is a high-grade uranium exploration and early-stage development company. We have six projects in the Athabasca basin, which is in northern Saskatchewan in Canada. It’s the highest grade depository of uranium in the world. It’s one of the top ranked mining jurisdictions in the world, as ranked by the Fraser Institutethe Saudi Arabia, if you will, of uranium.
We have spent the last seven years building up a project portfolio. And we’ve done a good job being opportunistic in a bear uranium market. It has been a depressed market for an extended period of time, since Fukushima, that’s created and presented the opportunity to acquire the asset base that we put together. The projects host a couple of uranium depositshigh-grade mineralization at various stages of exploration and development, ranging from earlier stage, more grassroots projects to more advanced-stage exploration.
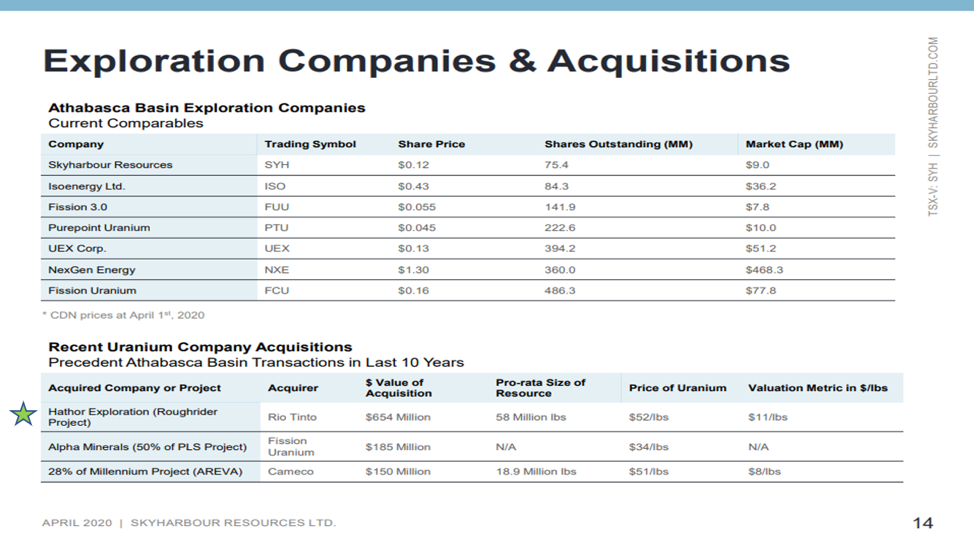
Skyhabour has been able to amass its portfolio by spending just under CA$5 million, a good chunk of that being paid in stock and in exploration expenditures. And to shed some light on the potential rerating for this asset base as we come into a better uranium market, there’s been about $90 million spent in historical exploration, invested into the projects. And, at one point, two of the projects were in a company that was valued at over $300 million in the last uranium bull market we saw, in 20062007.
At the current spot prices, these are significant discounted valuations. Skyhabour is excited to have this project portfolio, which we’re now advancing both with programs and exploration, and with drilling that we’re carrying out and funding at our flagship project, but as well with partner companiesstrategic partners that we brought in to help advance some of our secondary projects.
We do have two strategic partners, one of which is Denison Mines Corp. (DML:TSX; DNN:NYSE.MKT). They’re our largest strategic shareholder. They’re listed on the New York stock exchange and on the TSX, a larger uranium development company. The president and CEO, David Cates, is on our board.
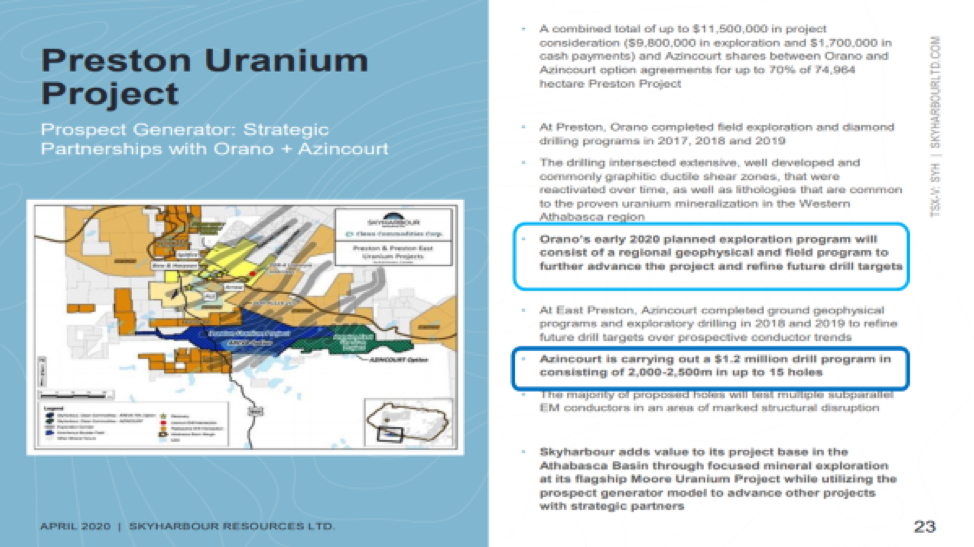
And secondly, we have a partner in Orano SA, which is France’s largest uranium mining and nuclear company, headquartered in Paris. They’re partners with us at our Preston Project, whereby they’re earning in up to 70% of the project by spending $8 million over a six-year period. I will just note, as well: We’re one of the few remaining active uranium junior mining companies out there.
We’ve seen a major contraction in both the number of uranium companies and their equity valuations. Uranium is a niche market, which is not followed as well as other larger market metals, but it does present a very unique opportunity with a very distinct set of fundamentals.
Maurice Jackson: Can you provide us with an example?
Jordan Trimble: For example, in the [past] two weeks, we’ve started to see the price of the uranium move almost 20% off its lows. And I think there’s good reason to believe that will continue, despite what’s happening in the broader market. And again, as one of the few remaining companies in the sector, we do offer investors exposure to that rise in uranium price, as we will highlight later in our discussion.
Maurice Jackson: Jordan, how does Skyharbour’s dual-prong strategy as a high-grade uranium exploration company, as well as a prospect generator, place shareholders in a competitive advantage among your peers?
Jordan Trimble: First and foremost, we are an exploration and discovery story. And there’s some notable recent high-grade uranium discoveries that have been made in our neck of the woods in the Athabasca Basinwithin the last, call it, 12 years. You look at Hathor back in 20082009; it was ultimately acquired in a bidding war between Cameco Corp. (CCO:TSX; CCJ:NYSE) and Rio, and was bought by Rio Tinto Plc (RIO:NYSE; RIO:ASX; RIO:LSE; RTPPF:OTCPK) in 2012 for over $600 million. And that discovery, which became the Rough Rider deposit, was a highly accretive transaction, and generously rewarded early investors in that story.
Recently in the Athabasca, we’ve seen new discoveries made by NexGen Energy Ltd. (NXE:TSX; NXE:NYSE.MKT), Fission Uranium Corp. (FCU:TSX; FCUUF:OTCQX; 2FU:FSE) and Denison. And these are all perfect examples of what high-grade uranium discoveries offer investors. It’s really unprecedented value creation in short periods of time. We are attempting to emulate the successes for our shareholders.
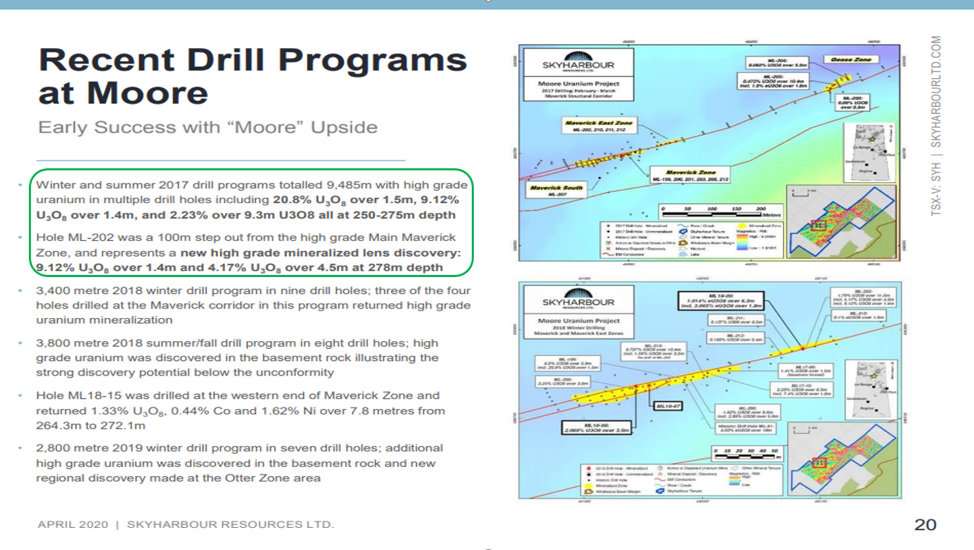
Skyharbour is currently conducting drilling at our100%-owned flagship Moore Project. It’s an interesting asset that we acquired back in 2016, and has a fair bit of historical drilling and exploration, along with high-grade uranium mineralization that was discovered there in the early 2000s.
Interesting to note [that] most of the historical work was focused in one or two geological settings in the Athabasca sandstone, which overlies the underlying basement rocks. And the contact between the sandstone and the underlying basement rocks is called the unconformity. Most of the high-grade mineralization that was discovered historically was either in the sandstone or at the unconformity, with very little drilling being done into the underlying basement rocks. More recently, the notable and major discoveries. . .have been made in the underlying basement rocks. This is truly exciting for us right now, because we’re now testing these underlying basement rocks with recent drill programs and upcoming planned drill programs. We think there’s much more uranium to be found in these basement rocks, in the feeder zones where the uranium comes up.
Allow me to share with readers that in a previous program we intersected a zone of 21% U3O8 uranium over about a meter and a half. We’ve had other zones of multi-percent over good widths, and that’s high-value rock on a dollar-per-ton basis at some of the most valuable ore out there.
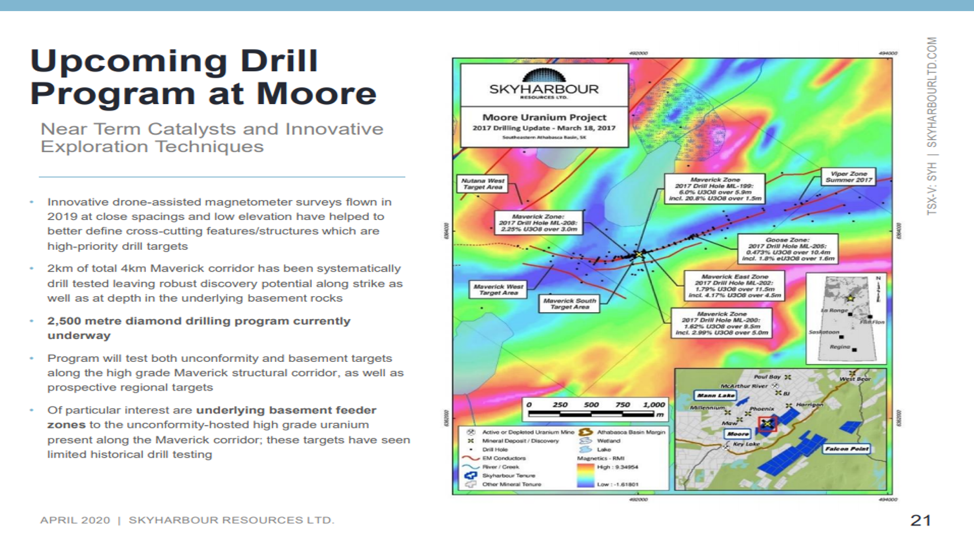
Skyharbour has proven there is high-grade in the sandstone and the unconformity. But again, most of the historical work, and the work that we’ve done to date, has not been focused on testing the underlying basement rocks. It’s really been some new geophysical techniques and methodologies, as well as a better understanding of the geologysome new geological modeling that we’ve carried out over the last yearthat has refined these basement-hosted targets. Our current winter program, which is just wrapping up, was predominantly focused on drill testing basement-hosted targets and feeder zones.
We actually followed up on a discovery hole that we had last year, whereby we intersected high-grade uranium mineralization in an exploratory drill hole we drilled into the basement rocks. And so we’ve gone and followed up on that. We’re very happy with the program and we will have results to follow in the next month or two. So keep an eye out for news flow there.
The second part of our overall strategy is being a prospect generator. What we do with our other projects, outside of our flagship, is we look to bring in partner companies that can fund and advance the projects. We can, in turn, also get some cash and stocks from these partner companies as they earn in, typically a majority stake in the property. We’ve consummated two deals thus far. One is with strategic partner Orano, as I mentioned earlier, whereby they have to spend upward of $8 million to earn in 70% of the Preston Project.
And another company, called Azincourt Uranium Inc. (AAZ:TSX.V), is nearing completion of their earn-in at our East Preston Project. There’s still a $200,000 task payment that needs to be made to us. But they’ve funded several million dollars in exploration expenditures and have issued shares, and have made cash payments, and they can earn 70% at our East Preston Project.
So those are perfect examples of the prospect generator model, whereby, again, we package our properties up and look to bring in partner companies that will then fund the exploration, and we get cash and stock as well as they earn in. We’d be ultimately become a joint venture partner, while retaining the upside with any success in the exploration and development work, but we don’t have to continuously raise money in the market and dilute. We can look to monetize the projects versus further dilution, and it’s a good complement to our main focus, which is making a new high grade or additional high-grade discovery at the flagship Moore Project.
Maurice Jackson: It’s a great, great business model. Skyharbour is currently conducting three active drill programs on the Preston, East Preston and Moore Lake Projects respectively. Can you provide us on an update on each of those sir?
Jordan Trimble: Beginning with our flagship Moore Project (press release), we announced earlier in the year we had commenced a 2,500-meter drill program testing predominantly basement targets. These are new targets that we’ve refined and identified in the underlying basement rocks. We think there’s a larger deposit to be found in the underlying basement rocks given that we have high-grade mineralization at the unconformity and in the sandstone. As I mentioned, we have assays pending. And, in all likelihood, we will be following up with additional programs later this year and in 2021.
At our other projects, which are partner-funded, Azincourt has been spending money at our East Preston Project (press release). They just completed an approximately 2,000-meter drill program and relatively shallow drilling following up on a reconnaissance drill program they carried out last year, where they had some notable indicator minerals, and alteration and graphitic conductors in which they drill some into a few exploratory holes. The assays are also pending on that program. That’ll augment news flow from our main drill program at our flagship Moore Project.
And then, last but not least, Orano has commenced, and is carrying out a field program at our Preston Project as a part of their $8 million earn-in at that project (press release). Orano is currently conducting a direct-current (DC) resistivity geophysical program, which is designed to refine drill targets for upcoming drill programs at the property. Their work will be wrapping up soon, and we expect to have some news flow as results come in from that program.
So, the bottom line is there’s multiple irons in the fire, multiple opportunities for new discoveries and more uranium mineralization to be discovered at several different projects, and the bulk of it is being funded by partner companies. So that’s an important point to note as well.
Maurice Jackson: Realizing there may be some supply chain constraints in reference to the assays, when should shareholders expect to get the first news results on those?
Jordan Trimble: We haven’t heard of any disruptions yet at the labs, but given that these programs just recently wrapped up, I would expect to see results here, probably, in the next month or two. And we’ll have a pretty steady flow of news between the various programs over that period of time taking us into the summer months.
Maurice Jackson: I see that Skyharbour has added a new member to the board of directors. Please share who was added, and provide a summary of the skill sets that he brings into Skyharbour Resources.
Jordan Trimble: Absolutely. We are proud to announce Joe Gallucci as the newest member to our board of directors. Joe’s the head mining investment banker at Laurentian Bank in Montreal. He has an extensive history in the mining space as a banker and as an analyst, previously worked at BMO Capital Markets, GMP Securities, Dundee, and was a founding principal at Eight Capital. He led their mining investment banking team before he moved over to Laurentian. He’s worked with many, many companies, he’s raised a lot of money from mining companies through his career.
And specifically for us, he has a history in the uranium sector. He has worked extensively with a number of uranium companies and I see him being an integral part to the team going forward.
One of the things I will note is, ultimately, what we are looking to do with Skyharbour, on the back of exploration success and value creation in the field and with our strategic partnersand again, hopefully, in a much better uranium marketwe would ultimately like to sell the company, to be the target of an acquisition by a larger company. And I think Joe will be a valuable resource to have as a director when that time comes.
In addition to Joehe’s the most recent addition to the boardwe do have, I’d say, a top-tier management and technical team. Myself and our chairman, Jim Pettit, are based here in Vancouver. Jim previously ran a gold company that I worked for called Bayfield Ventures, which was ultimately acquired by New Gold Inc. (NGD:TSX; NGD:NYSE.MKT). That’s when I started Skyharbour, in and around the time that Bayfield was acquired.
And my technical team is based in Saskatoon. My head geologist, Rick Kusmirski, who’s a 40-year veteran in the sector, brings focused expertise on uranium exploration and discovery in the Athabasca Basin. He was the exploration manager at the world’s largest uranium company, Cameco, for many years before starting his own uranium junior company, called JNR, which ultimately he sold to Denison Mines. And that’s when he joined our team, when we started Skyharbour.
A couple of other people on the advisory board include Paul Matysek, who is well known in our industry, having built and sold a handful of mining companies over the last 12 years. And his biggest win was the uranium company called Energy Metals Corp., which he sold for $1.8 billion in 2007.
So, we have a very well-rounded team with management and capital markets expertise, as well as a focused expertise in the Athabasca Basin, uranium exploration and development in Saskatchewan.
Maurice Jackson: There’ve been some recent notable developments in the uranium sector, including the suspension of operations at Cigar Lake in response to the coronavirus. Can you give us your thoughts on these recent developments?
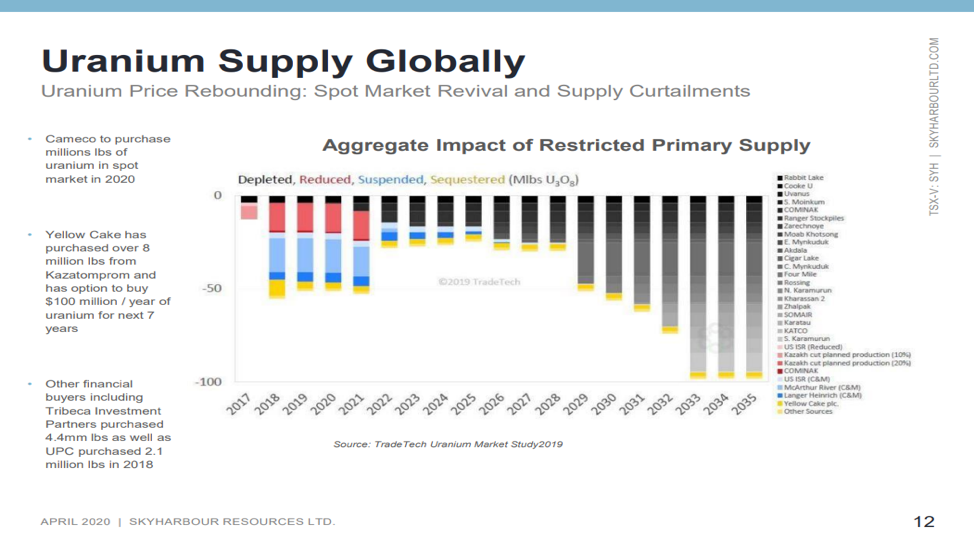
Jordan Trimble: As I pointed out earlier, we have seen the price of the metal move. Recently we’ve seen almost a 20% increase in the spot price, on the back of the recent announcement of suspension of operations and production at Cigar Lake, and the McClean Lake mill that processes the ore from Cigar Lake. Cigar Lake accounts for just over 13% of global primary mine supply. It is a massive mine, and it’s the highest-grade operating uranium mine in the world. It’s Cameco that is the majority owner and operator.
Cameco guided that it’s going to be an initial four-week suspension due to health concerns surrounding COVID-19. . . .However, my gut is telling me that could be longer. We could see an extended suspension. I believe that you’re going to see a restart of operation of that mine based not on the underlying health concernthe reason that they took it offlinebut for the look at the economic and commercial factors of restarting the mine.
As we know, they shut down their other large operation and mine in the basin a couple of years back, McArthur River. It’s been offline for a little while now, and they shut that down because of the low uranium price environment. As a result of that, they’ve had to buy a fair bit of material over the last little while in the spot market. Just before coronavirus caused a number of these operational shutdowns, Cameco recently came out with quarterlies that stated that they would have to buy between 2022 million pounds of uranium.
They’d have to acquire that from somewhere in order to meet their contract delivery. They have. . .pre-negotiated contracts with utility companies and purchasing managersfield buyersthat they are required to deliver into. Now, that hasn’t changed with everything that’s going on; they’re still required to make those deliveries. So with the McArthur River Mine having been shut down, they’ve been forced to buy materiala good chunk of material in the spot marketand/or draw down inventories.
They’ve drawn down inventories well below their guidanceminimal thresholds. So they don’t have that as an option anymore. They have to acquire that material either by purchasing it in the market and/or finding it from some other secondary supply source. These secondary supply sourcestheir inventories are drying up. That’s looking like it’s becoming a less viable option for them. And in fact, they stated in those recent quarterlies and earnings that they would likely be having to buy most of that 2022 million pounds in the spot market.
Well, that was a couple months ago. Fast forward to now, with the other large mine that they’ve shut down at Cigar Lake. That number has just increased dramatically from the 2022 million pounds. With Cigar Lake shutdownif it is shut down for any further extended period of time, more than the month that they’ve initially guidedthat means they’ll have to, again, find that material from somewhere else. That likely will have to be in the spot market. And we’ve already seen in the last week the spot price pick up from about $24.50 to almost $28, actually.
I think a chunk of that has been coming from the market obviously tightening up, with producers having to curtail production. And I think also we’re going to see utilities likely start buying in the spot market to shore up supply. Just to kind of give some stats here, seven mines account for over two-thirds of global supply with this metal. So it’s highly concentrated among just a handful of mines in a couple of jurisdictions.
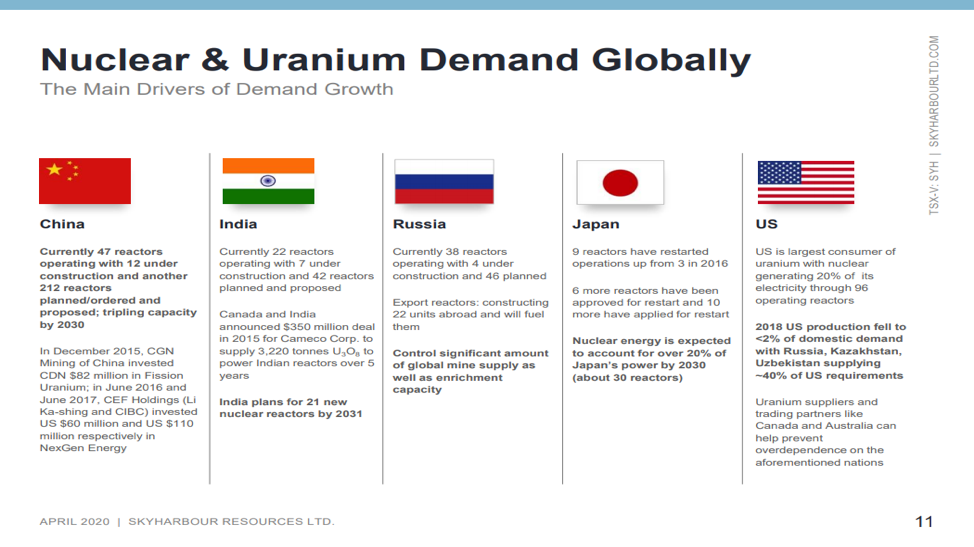
Some other notable areas and mines to look out for in terms of the response to the virus is Namibia. It accounts for about 10% of global primary mine supply. They’ve already started shutting down their uranium mines, suspending production there. And then the big one will be Kazakhstan. Kazakhstan accounts for 40% of the global supply. And it’ll be interesting to see, over the coming weeks, if there’s any supply disruption therein addition to a couple of mines in Australia, including Olympic Dam, where uranium is a byproduct, but it nonetheless accounts for about 4% to 5% of the global supply.
The uranium sector is experiencing major supply disruptions because of the virus. I think you could see more of that on the horizon. Again, if there’s any extended production curtailment at any one of these mines, that’s going to have a positive impact on the price.
Maurice Jackson: What are you seeing on the demand side?
Jordan Trimble: On the demand side, the demand for this metal is predominantly in nuclear reactors. It’s relatively sticky demand. Nuclear reactors aren’t easy to turn on and off, so you’re not going to see much in the way of a demand shock or a demand disruption.
I think that it’s relatively insulated from what’s happening globally. You’ll see intermittent sources of electricity, like wind, solar, that likely go off first if there isn’t the electricity demand and consumption that we normally see. But nuclear reactors, they’re big, big operating plants. And again, they’re not easy to just simply turn on and off. I think you see a relatively insulated and sticky demand side in the backdrop of major supply disruptions, in addition to the supply disruptions and curtailment that we’ve seen already over the last couple of years.
Maurice Jackson: Well, you’re looking at a multitude of catalysts for the uranium price, which has actually bucked the general market trend recently and is moving higher. Do you see this as a trend continuing?
Jordan Trimble: I do. We went over some of the reasons why it’s moving higher right now, but I do see this being a trend that continues. It’s important to note that uranium has a very unique and distinct set of fundamentals and drivers. It’s a relatively uncorrelated to the broader market. And what you’re seeing right now in this market is a prolonged bear market coming to an end. You’re seeing a recovery take place. And it’s right now being supply driven, with these recent supply cuts.
The supply/demand fundamentals and picture for this commodity are as compelling as any commodity out there right now from a buyer standpoint. You’re looking at the supply side. We’ve seen supply now decrease. This was before the recent announcements in production suspensions.
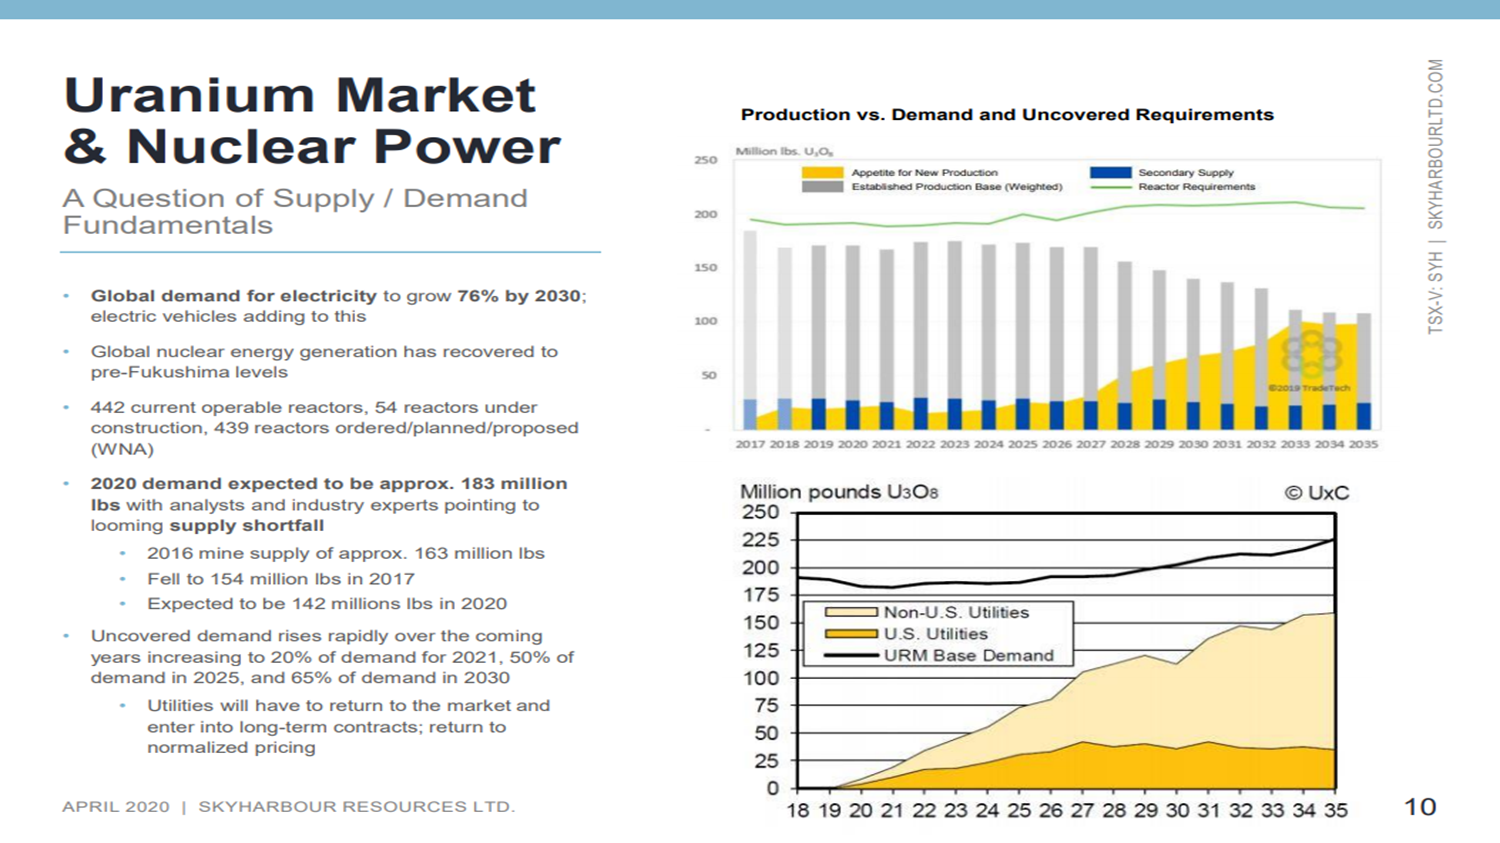
But we’ve seen supply decrease from about 163 million pounds in 2016 down to an estimated 140 million pounds in this year. And that’s in the backdrop of growing demanddemand that is estimated this year to be between 185190 million pounds. So pretty notable and significant supply deficit that’s having to be met by secondary supplies.
And we’re seeing these markets tighten up, and I think we’ll see that continue, especially with the supply disruptions that are occurring, including Cigar Lake and other mines that have shut down or been suspended recently. When you have that kind of a supply deficit and you have highly concentrated supplyprimary mine supply globally just in a few operating minesthat really does set the stage for a serious price move, as we’re starting to see.
And again, in this sector, it’s not like we’re coming out of eight- or nine-year bull market, like we’ve seen in many other asset classes and sectors. This has been, unfortunately for the last eight or nine years, a very difficult sector to be in. And I think that we’re seeing. . .the cycle turn, we’re seeing a reversal. And again, it’s being driven by very specific fundamentals for the metal.
Another thing I think worth noting. . .is that one of the biggest drivers for the uranium price historically has been utility contracting, right? We discussed that uranium and most material is being bought and sold and being acquired by nuclear utility companies through contracts that they have with the miners and with the supplier as well.
We know that over 50% of these existing contracts expire by 2025 and you have to actually factor in about a year to two years where you have to fabricate and enrich the fuel. So you move that back about a year to two years. We are inching closer and closer to when the majority of these contracts have the risk of expiring. And so there’s a lot of uncovered requirements five to six years out, and these utility companies and purchasing managers are now going to have to come back and are going to be forced to negotiate with the mining companies.
And we know that for the mining companies, the current low spot prices, $2627 a pound, are well below the average global cost of production. We know that they’re not going to settle for those prices, and sell material over a multiyear periods at those prices, and there has been an impasse as a result of that. I think that ultimately the fuel buyers are going to have to pay more. They’re going to have to buy the material at what we would deem to be somewhat normal prices, in that $4060 range.
The forecast price from analysts that cover the sector range from $4560 a pound, which is a significant move. I’d call it almost a doubling from the current spot price. I foresee a new contracting cycle happening in short order that’ll be expedited, with everything that’s happening right now. And then another big thing more recently, and certainly with a focus in the United States, has been the security of supplyand whether it’s in the U.S. It’s a national security concern on where the U.S. sources its uranium.
The United States only produces about 1% of the uranium that it consumes annually. It’s still the largest consumer of uranium for its nuclear reactor fleet, yet production has dwindled next to nothing. It has to import the vast majority of its fuel, a good chunk of that coming from places like Kazakhstan, Russia and Uzbekistan. So I’m sure readers are familiar with, over the last a couple of years, this Section 232 investigation that ended up leading to a decision in July of last year, which ultimately went against, I think, what most market participants were expecting and that President Trump and the administration decided against any trade auction.
And we did see, subsequent to that, a nuclear fuel working group set up, which is still there to further investigate and look at the situation. We’re waiting to get some resolutions from that. That has created quite a bit of uncertainty and an overhang, if you will, and it has, I think, led to some price weakness in the equities over the last year. The uncertainty around Section 232 in the Nuclear Fuel Working Group has forced certain U.S. nuclear utilities to the sidelines. And when the largest buyer and consumer of uranium globally isn’t in the market as actively as they would be because of that, that’s obviously going to have a detriment. It’s going to be a detriment to the price and to share prices.
We did see, earlier this year, the announcement of the proposed $150 million-a-year budget for a domestic reserve. Investors are still waiting to see details on what that exactly looks like, and what that entails. But again, I think it’ll go a long way in just providing some visibility and clarity on what utilities in the U.S. have to do in terms of where they have to buy from. And I think that that will bring them back to the market, and that will go a long way.
There are just a wide multitude of factors specific to the sector that are driving higher prices right now, and I think will continue to drive higher uranium prices going forward.
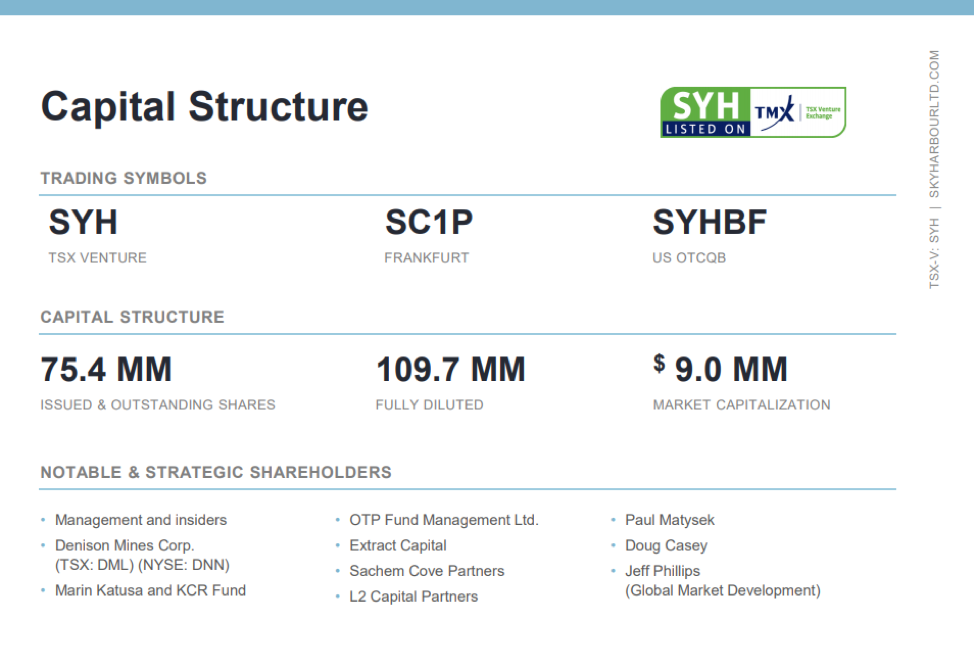
Maurice Jackson: We’ve covered the uranium price. Please provide us with the current share price and capital structure for Skyharbour resources.
Jordan Trimble: Skyharbour has 75 million shares issued and outstanding, and trades at almost $10 million valuation market cap, so relatively low. And you can see that I’ve been buying a fair bit of stock in the market recently. I see the current price in valuation as one of the best value propositions that this company has ever offered, given what we have going on in the field, with results coming out on several programs, high-grade discovery potential at our projects in the Athabasca basin, strategic partnerships.
And I think investors are going to be looking for asset classes and sectors that they may not have looked at over the last several years and they’re going to be looking at what is going to outperform, what is going to provide returns in a tough market. Given that this sector is relatively uncorrelated with the broader market, there’s a good case to be made that you’re going to see a higher commodity price over the next little while. I think a little bit of investor interest will go a long way, when the total combined market capitalization of all publicly traded uranium companies is now less than $7 billion.
Just to put that in perspective, nuclear energy globally accounts for about 11% of electricity output. Here you have the companies that looked for and mine the fuel for 11% of global or electricity generation. The total combined market caps and valuations are only $7 billion. So a little bit of investor interest will go a long way. And importantly for us, as a small-cap company, we will see those dollars flow down to small-cap names like Skyharbour relatively quickly.
There aren’t a whole bunch of large-cap mining companies or exchange-traded funds, and you can’t buy physical uranium. So again, it’s a unique opportunity in that it offers leverage and torque on a rising uranium price. But you don’t have to see a lot of money captured with larger-cap names and other means of getting investment exposure. You’ll see investor dollars trickle down relatively quickly to the mid-cap and small-cap names in the space.
Maurice Jackson: Sir, what keeps you up at night that we don’t know about?
Jordan Trimble: Well, I think, like everyone else right now, watching how this virus and pandemic plays out. It’s created obviously a panic selloff in the broader markets. And unfortunately, when you see days where the Dow’s down 1,000, 2,000 points, you get to a liquidity event and everything gets sold off.
Given everything that’s happening from a health standpoint, loss the life and the collateral damage, if you will, financial markets and selling off, it’s unprecedented times and you just hope that things can get back to normal and that we start seeing some more positive headlines out there. Unfortunately, it’s out of our control, obviously. And we want to make sure that everyone’s safe and healthy, and we will get through this. We’re excited about our prospects for Skyharbour. I think we do have a lot to offer and a unique value proposition here, especially at the current valuation.
Maurice Jackson: Last question. What did I forget to ask?
Jordan Trimble: I think that covers it all. We went through quite a bit. Keep an eye out for news flow over the next several months. We’ve been quite active and we’re going to have a number of key near-term catalysts, including drill results.
Readers should also keep an eye out for further news in the uranium sector, additional potential supply disruptions and cuts. A big one will occur in a few weeks. So, whether we see that could be Cigar Lake mine restart or if we see an extended shutdown at the mine. And then also whether we see mines in Kazakhstan and other mines globally shut down. And so despite everything that’s happening, specifically for Skyharbour, we do have a lot to look forward to, and I do believe that we’re very well positioned to benefit from a rising uranium price.
Maurice Jackson: Mr. Trimble, for someone listening that wants to get more information on Skyharbour Resources, please share the contact details.
Jordan Trimble: The website address is www.skyharbourltd.com. There’s a wealth of information there and all of our contact information is on the website.
Maurice Jackson: Skyharbour Resources trades on the TSX.V: SYH, OTCQB: SYHBF. Skyharbour Resources is a sponsor of Proven and Probable, and we are proud shareholders for the virtues conveyed in today’s message.
Before you make your next bullion purchase, make sure you call me. I’m a licensed representative for Miles Franklin Precious Metals Investments where we provide a number of options to expand your precious metals portfolio from physical delivery, offshore depositories, precious metal IRAs and private blockchain distributed ledger technology. Call me directly at (855) 505-1900 or you may e-mail [email protected].
Jordan Trimble of Skyharbour Resources, thank you for joining us today on Proven and Probable.
Maurice Jackson is the founder of Proven and Probable, a site that aims to enrich its subscribers through education in precious metals and junior mining companies that will enrich the world.
Disclosure: 1) Maurice Jackson: I, or members of my immediate household or family, own shares of the following companies mentioned in this article: Skyharbour Resources. I personally am, or members of my immediate household or family are, paid by the following companies mentioned in this article: None. My company has a financial relationship with the following companies mentioned in this article: Skyharbour Rresources is a sponsor of Proven and Probable. Proven and Probable disclosures are listed below. 2) The following companies mentioned in this article are billboard sponsors of Streetwise Reports: Skyharbour Resources. Click here for important disclosures about sponsor fees. 3) Statements and opinions expressed are the opinions of the author and not of Streetwise Reports or its officers. The author is wholly responsible for the validity of the statements. The author was not paid by Streetwise Reports for this article. Streetwise Reports was not paid by the author to publish or syndicate this article. The information provided above is for informational purposes only and is not a recommendation to buy or sell any security. Streetwise Reports requires contributing authors to disclose any shareholdings in, or economic relationships with, companies that they write about. Streetwise Reports relies upon the authors to accurately provide this information and Streetwise Reports has no means of verifying its accuracy. 4) This article does not constitute investment advice. Each reader is encouraged to consult with his or her individual financial professional and any action a reader takes as a result of information presented here is his or her own responsibility. By opening this page, each reader accepts and agrees to Streetwise Reports’ terms of use and full legal disclaimer. This article is not a solicitation for investment. Streetwise Reports does not render general or specific investment advice and the information on Streetwise Reports should not be considered a recommendation to buy or sell any security. Streetwise Reports does not endorse or recommend the business, products, services or securities of any company mentioned on Streetwise Reports. 5) From time to time, Streetwise Reports LLC and its directors, officers, employees or members of their families, as well as persons interviewed for articles and interviews on the site, may have a long or short position in securities mentioned. Directors, officers, employees or members of their immediate families are prohibited from making purchases and/or sales of those securities in the open market or otherwise from the time of the interview or the decision to write an article until three business days after the publication of the interview or article. The foregoing prohibition does not apply to articles that in substance only restate previously published company releases. As of the date of this article, officers and/or employees of Streetwise Reports LLC (including members of their household) own securities of Skyharbour Resources, a company mentioned in this article.
Proven and Probable LLC receives financial compensation from its sponsors. The compensation is used is to fund both sponsor-specific activities and general report activities, website, and general and administrative costs. Sponsor-specific activities may include aggregating content and publishing that content on the Proven and Probable website, creating and maintaining company landing pages, interviewing key management, posting a banner/billboard, and/or issuing press releases. The fees also cover the costs for Proven and Probable to publish sector-specific information on our site, and also to create content by interviewing experts in the sector. Monthly sponsorship fees range from $1,000 to $4,000 per month. Proven and Probable LLC does accept stock for payment of sponsorship fees. Sponsor pages may be considered advertising for the purposes of 18 U.S.C. 1734.
The Information presented in Proven and Probable is provided for educational and informational purposes only, without any express or implied warranty of any kind, including warranties of accuracy, completeness, or fitness for any particular purpose. The Information contained in or provided from or through this forum is not intended to be and does not constitute financial advice, investment advice, trading advice or any other advice. The Information on this forum and provided from or through this forum is general in nature and is not specific to you the User or anyone else. You should not make any decision, financial, investments, trading or otherwise, based on any of the information presented on this forum without undertaking independent due diligence and consultation with a professional broker or competent financial advisor. You understand that you are using any and all Information available on or through this forum at your own risk.