The greenback continued its growth against a basket of world currencies despite the publication of weak economic releases. EUR/USD quotes have updated local lows. Investors continue to assess the risks of the further spread of the COVID-19 virus and its impact on the global economy. The ECB President, Christine Lagarde, said that the regulator was bracing for a “large contraction” in the Eurozone economy. At the moment, the key range is 1.0830-1.0875. A trading instrument has the potential for further decline. Positions should be opened from key levels.
The Economic News Feed for 17.04.2020
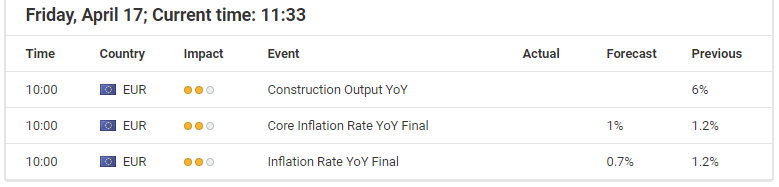
At 12:00 (GMT+3:00), a report on inflation will be published in the Eurozone.
Indicators signal the power of sellers: the price has fixed below 50 MA and 100 MA.
The MACD histogram is in the negative zone and continues to decline, indicating the bearish sentiment.
Stochastic Oscillator is in the neutral zone, the %K line is below the %D line, which also gives a signal to sell EUR/USD.
Trading recommendations
Support levels: 1.0830, 1.0785, 1.0765
Resistance levels: 1.0875, 1.0900, 1.0935
If the price fixes below 1.0830, a further fall in the EUR/USD currency pair is expected. The movement is tending to 1.0790-1.0770.
An alternative could be the growth of EUR/USD quotes to 1.0900-1.0930.
The GBP/USD currency pair
Technical indicators of the currency pair:
Prev Open: 1.25095
Open: 1.24554
% chg. over the last day: -0.22
Day’s range: 1.24303 – 1.25222
52 wk range: 1.1466 – 1.3516
The GBP/USD currency pair is being traded in a flat. There is no defined trend. The British pound is testing the key support and resistance levels: 1.2420 and 1.2520, respectively. In the near future, the technical correction of GBP/USD quotes is not ruled out after a protracted rally. Financial market participants are still focused on the coronavirus pandemic. We recommend opening positions from key support and resistance levels.
The news feed on the UK economy is calm.
Indicators do not give accurate signals: the price has crossed 50 MA and 100 MA.
The MACD histogram is near the 0 mark.
Stochastic Oscillator is in the neutral zone, the %K line is below the %D line, which indicates the bearish sentiment.
Trading recommendations
Support levels: 1.2420, 1.2360, 1.2290
Resistance levels: 1.2520, 1.2575, 1.2645
If the price fixes below 1.2420, GBP/USD quotes are expected to fall. The movement is tending to 1.2370-1.2340.
An alternative could be the growth of the GBP/USD currency pair to 1.2570-1.2600.
The USD/CAD currency pair
Technical indicators of the currency pair:
Prev Open: 1.41074
Open: 1.40850
% chg. over the last day: -0.53
Day’s range: 1.40052 – 1.41082
52 wk range: 1.2949 – 1.4668
There is an ambiguous technical pattern on the USD/CAD currency pair. The loonie is consolidating. There is no defined trend. At the moment, the local support and resistance levels are 1.4050 and 1.4120, respectively. USD/CAD quotes are tending to grow. The Canadian dollar is under pressure due to aggressive sales in the “black gold” market. We recommend opening positions from key levels.
Today, the news feed on Canada’s economy is calm enough.
Indicators do not give accurate signals: the price has crossed 50 MA.
The MACD histogram is near the 0 mark.
Stochastic Oscillator is in the neutral zone, the %K line is above the %D line, which indicates the bullish sentiment.
Trading recommendations
Support levels: 1.4050, 1.4000, 1.3925
Resistance levels: 1.4120, 1.4180, 1.4260
If the price fixes above the resistance level of 1.4120, USD/CAD quotes are expected to grow. The movement is tending to 1.4170-1.4220.
An alternative could be a decrease in the USD/CAD currency pair to 1.4000-1.3980.
The USD/JPY currency pair
Technical indicators of the currency pair:
Prev Open: 107.378
Open: 107.941
% chg. over the last day: +0.42
Day’s range: 107.626 – 108.080
52 wk range: 101.19 – 112.41
The USD/JPY currency pair is in a sideways trend. The technical pattern is ambiguous. Financial markets participants expect additional drivers. At the moment, the local support and resistance levels are 107.60 and 108.00, respectively. We recommend paying attention to the dynamics of US government bonds yield. Positions should be opened from key levels.
A number of weak economic releases from Japan have been published during the Asian trading session.
Indicators do not give accurate signals: the price has fixed between 50 MA and 100 MA.
The MACD histogram is in the positive zone, but below the signal line, which gives a weak signal to buy USD/JPY.
Stochastic Oscillator is in the neutral zone, the %K line is above the %D line, which indicates the bullish sentiment.
Trading recommendations
Support levels: 107.60, 107.25, 106.90
Resistance levels: 108.00, 108.50
If the price fixes above the round level of 108.00, USD/JPY quotes are expected to grow. The movement is tending to 108.30-108.50.
An alternative could be a decrease in the USD/JPY currency pair to 107.30-107.00.
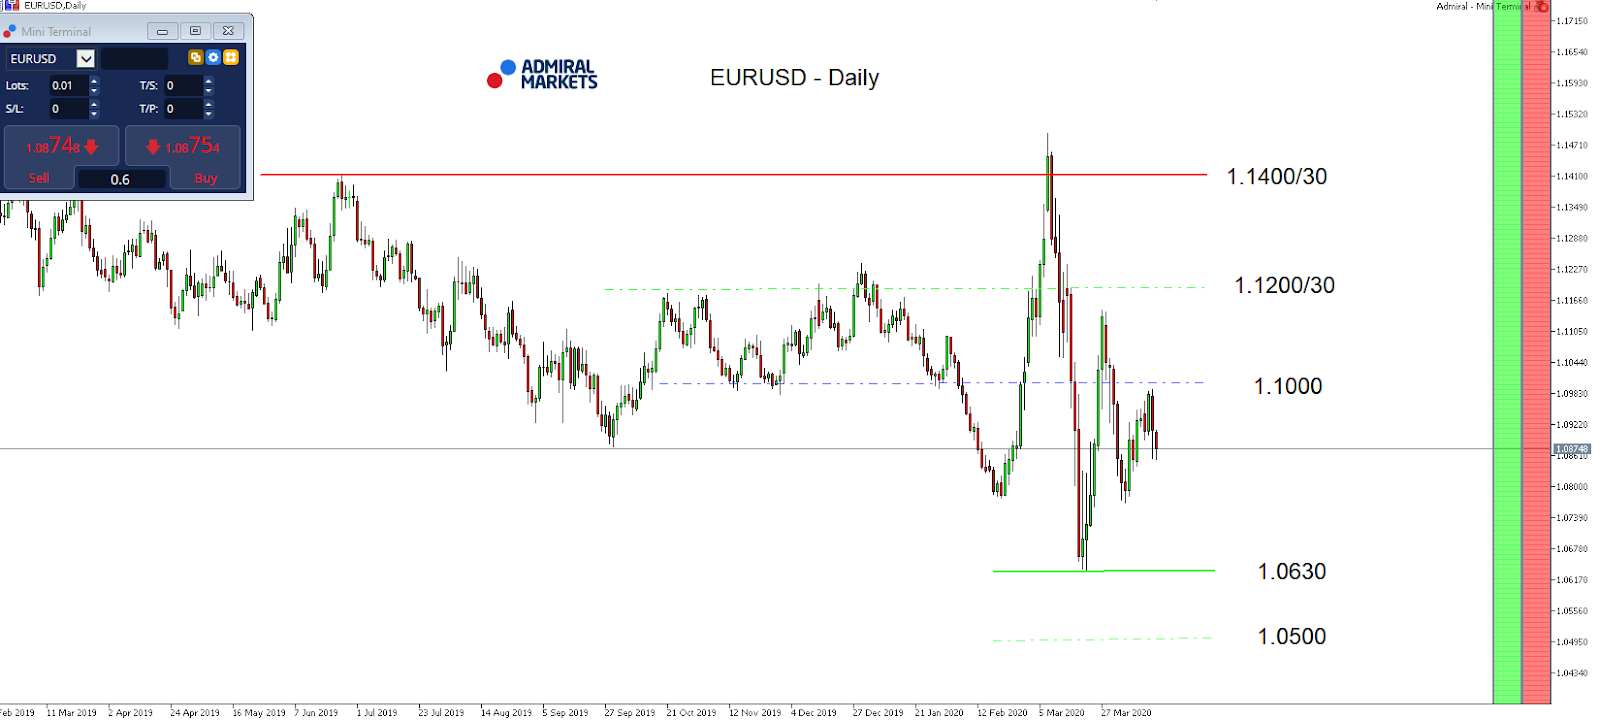
The mode in the Euro, and here in the EUR/USD, remains choppy. But after a very weak performance on Wednesday, it has picked up a bearish touch.
The failed attempt to recapture 1.1000 send already a message to Euro bulls, but after the Euro couldn’t profit from the very weak Retail Sales data on Wednesday (coming in at -8.7%, and at an all-time low passing its former record at -3.9% in 2008 during the Great Financial Crisis), it seems likely that we get to see a soon coming re-test of the March lows around 1.0630.
This could be especially true if the final inflation rate print for the Eurozone today prints below the already low 0.7% expectation.
Reason for the lowest expectation here since last October is not only the Covid-19 outbreak, but probably especially the recent drop in oil which couldn’t be stopped despite the historic production output cut form OPEC+ over the last weekend.
That said, an acceleration in the EUR/USD on the downside is likely, not only resulting in wave lower, but a break below 1.0600/30 which makes a further drop as low as 1.0500 and probably even lower a serious option:
Source: Admiral Markets MT5 with MT5-SE Add-on EUR/USD Daily chart (between February 15, 2019, to April 16, 2020). Accessed: April 16, 2020, at 10:00pm GMT – Please note: Past performance is not a reliable indicator of future results, or future performance.
In 2015, the value of the EUR/USD fell by 10.2%, in 2016, it fell by 3.2%, in 2017, it increased by 13.92%, 2018, it fell by 4.4%, 2019, it fell by 2.2%, meaning that after five years, it was down by 7.3%.
Discover the world’s #1 multi-asset platform
Admiral Markets offers professional traders the ability to trade with a custom, upgraded version of MetaTrader 5, allowing you to experience trading at a significantly higher, more rewarding level. Experience benefits such as the addition of the Market Heat Map, so you can compare various currency pairs to see which ones might be lucrative investments, access real-time trading data, and so much more. Click the banner below to start your FREE download of MT5 Supreme Edition!
Disclaimer: The given data provides additional information regarding all analysis, estimates, prognosis, forecasts or other similar assessments or information (hereinafter “Analysis”) published on the website of Admiral Markets. Before making any investment decisions please pay close attention to the following:
This is a marketing communication. The analysis is published for informative purposes only and are in no way to be construed as investment advice or recommendation. It has not been prepared in accordance with legal requirements designed to promote the independence of investment research, and that it is not subject to any prohibition on dealing ahead of the dissemination of investment research.
Any investment decision is made by each client alone whereas Admiral Markets shall not be responsible for any loss or damage arising from any such decision, whether or not based on the Analysis.
Each of the Analysis is prepared by an independent analyst (Jens Klatt, Professional Trader and Analyst, hereinafter “Author”) based on the Author’s personal estimations.
To ensure that the interests of the clients would be protected and objectivity of the Analysis would not be damaged Admiral Markets has established relevant internal procedures for prevention and management of conflicts of interest.
Whilst every reasonable effort is taken to ensure that all sources of the Analysis are reliable and that all information is presented, as much as possible, in an understandable, timely, precise and complete manner, Admiral Markets does not guarantee the accuracy or completeness of any information contained within the Analysis. The presented figures refer that refer to any past performance is not a reliable indicator of future results.
The contents of the Analysis should not be construed as an express or implied promise, guarantee or implication by Admiral Markets that the client shall profit from the strategies therein or that losses in connection therewith may or shall be limited.
Any kind of previous or modeled performance of financial instruments indicated within the Publication should not be construed as an express or implied promise, guarantee or implication by Admiral Markets for any future performance. The value of the financial instrument may both increase and decrease and the preservation of the asset value is not guaranteed.
The projections included in the Analysis may be subject to additional fees, taxes or other charges, depending on the subject of the Publication. The price list applicable to the services provided by Admiral Markets is publicly available from the website of Admiral Markets.
Leveraged products (including contracts for difference) are speculative in nature and may result in losses or profit. Before you start trading, you should make sure that you understand all the risks.
Asian stock markets are a sea of green, while US equity futures are also pointing to more gains for Wall Street to close the week. Risk appetite is being lifted by the rising hope that global economies can be restarted in the not-so-distant future. Investors have also been encouraged by a report suggesting a potential coronavirus treatment from US drug company Gilead had shown positive results in a clinical trial. Gold is down by 1.4 percent and trading below the $1700 psychological level, 10-year US Treasury yields have risen by over five percent, while USDJPY has strengthened by about 0.2 percent to trade around 107.7.
Despite yesterday’s dismal data dump, including more record US jobless claims, investors are pinning their hopes on plans to ease lockdown measures. US President Donald Trump has set out guidelines that allow social distancing rules to be lifted in as soon as four weeks, smaller shops in Germany are set to reopen, while China has already embarked on its road to recovery over the last few weeks. Set against such optimistic anticipations, investors are paying less attention to the economic carnage left in Covid-19’s wake, including headline-grabbing prints such as China’s Q1 GDP shrinking by 6.8 percent to post its first contraction since at least 1992 and US jobless claims rising to 22 million in the four-week period ending April 11, which effectively wipes out all US jobs added since mid-2009.
Gains in risky assets may be ignoring underlying concerns over global economy
The prudent investor would however be mindful that the road to global economic recovery remains tentative at this point in time. Such concerns are laid bare in the Dollar/Asia complex, with most Asian currencies posting a loss against the Greenback for the week.
A global recession remains the base case for the year and the economic outlook remains clouded with uncertainties. While policymakers are eager to limit the economic damage, the reopening of their respective countries could be upended by a swift resurgence of the coronavirus. The broad rollout of a Covid-19 vaccine is still the necessary catalyst for a return to life as it once was and would be the spark required for a sustained rally in risk assets.
Brent, WTI futures put in contrasting shifts
Brent futures are gaining two percent to push back towards $30, while WTI futures are lower by 1.3 percent and have sunk back below the psychologically-important $20 mark. Brent’s buoyancy is being invigorated by the joint statement by Saudi Arabia and Russia to take “further measures” to support Oil prices. However, the US benchmark is being dragged lower amid a record collapse in fuel demand stateside, which threatens to send US inventories to a new record high in a matter of weeks. Such prospects are reportedly prompting the US administration to consider paying producers to keep crude in the ground.
Oil markets overall are still expected to struggle on this slippery slope as demand-side risks remain tilted to the downside. However, if more of the global economy enacts plans to reopen and restores some sense of normality, that could help Oil prices find a firmer floor in May, aided by the OPEC+ supply cuts kicking in then as well.
Disclaimer: The content in this article comprises personal opinions and should not be construed as containing personal and/or other investment advice and/or an offer of and/or solicitation for any transactions in financial instruments and/or a guarantee and/or prediction of future performance. ForexTime (FXTM), its affiliates, agents, directors, officers or employees do not guarantee the accuracy, validity, timeliness or completeness, of any information or data made available and assume no liability as to any loss arising from any investment based on the same.
Global equity indexes are rising today after President Trump announced new guidelines for reopening US states in a staggered, three stage approach. Global equities rebounded yesterday despite mixed economic reports from US. Investors’ risk appetite got a boost from a late Thursday report patients taking Gilead Sciences experimental drug displayed “rapid recoveries.”
Forex news
Currency Pair
Change
EUR USD
-0.3%
GBP USD
-0.71%
USD JPY
+0.36%
AUD USD
+0.09%
The dollar continues strengthening as initial jobless claims came in smaller than previous week’s upsurge, while Philadelphia Fed Manufacturing Index’s drop was bigger than expected. The ICE US Dollar index, a measure of the dollar’s strength against a basket of six rival currencies, continues rising currently. The EUR/USD and GBP/USD continued retreating yesterday and are lower currently, while AUD/USD continues climbing together with USD/JPY.
Stock Market news
Indices
Change
Dow Jones Index
+0.43%
Nikkei Index
+0.44%
Hang Seng Index
+0.52%
US Dollar Index
+0.26%
Stock indexes in US and Europe recovered yesterday as US plan for gradual reopening of states offset unease after mixed US data. The three main US stock indexes recorded gains ranging from 0.6% to 1.7%. Technology shares led the gains. European stock index are sharply higher currently as Germany announced plan to reopen its economy. Smaller shops will be able to start reopening on April 20 while schools will reopen on May 4. Asian indexes are solidly higher today led by Nikkei despite report China’s economy contracted 6.8% in Q1, the worst performance since at least the late 1970s.
Commodity Market news
Commodities
Change
Brent Crude Oil
-2.6%
WTI Crude
-2.33%
Brent is falling today after an OPEC report Thursday showing the cartel lowered dramatically its expectations for crude demand, estimating the 2020 demand falling by 6.8 million barrels a day. The report came after the Energy Information Administration data showing a bigger than expected 19.2 million barrels rise in domestic crude oil supplies last week, and the International Energy Agency warning of a drop in demand of 9.3 million barrels a day this year. June Brent however added 0.6% to $27.82 on Thursday.
Gold Market News
Metals
Change
Gold
-1.3%
Gold is extending losses today. The price of an ounce of June gold fell 0.5%, to settle at 1,731.70 an ounce on Thursday.
Note: This overview has an informative and tutorial character and is published for free. All the data, included in the overview, are received from public sources, recognized as more or less reliable. Moreover, there is no guarantee that the indicated information is full and precise. Overviews are not updated. The whole information in each overview, including opinion, indicators, charts and anything else, is provided only for familiarization purposes and is not financial advice or а recommendation. The whole text and its any part, as well as the charts cannot be considered as an offer to make a deal with any asset. IFC Markets and its employees under any circumstances are not liable for any action taken by someone else during or after reading the overview.
Shares of Lifeway Foods traded higher as the company reported it has increased production to support accelerated demand during the COVID-19 health crisis.
Lifeway Foods Inc. (LWAY:NASDAQ) yesterday provided a business update together with reporting its Q4/19 and FY/19 results for the period ended December 31, 2019. The company indicated that “it expects preliminary, unaudited Q1/20 net sales to increase by 2% to 4% as compared to Q1/19 with the month of March net sales up 13% year-over-year.”
Lifeway’s CEO Julie Smolyansky commented, “We are pleased with our solid end to the year and strong start to 2020. Our team’s execution of our long-term strategic plan, Lifeway 2.0, is demonstrated by the sequential improvement in our sales trends in the fourth quarter resulting in our ability to reinvigorate growth which has accelerated into the first quarter of 2020 with net sales expected to be up 2% to 4% year-over-year including a really strong March monthly sales…Our current focus is the health, safety and well-being of our employees, as well as local and national communities, during this time of unprecedented uncertainty and crisis related to COVID-19.”
“During this time of shelter-in-place as a result of COVID-19, 40% of Americans are more proactively taking care of their physical and emotional health and 17% are consuming more immunity and overall self-care supporting products such as probiotics and vitamins, according to IRI. In the first quarter of 2020, we have increased our production to meet accelerated demand at both grocery retail and online grocery as more consumers focus on self-care and nutrition to aid in their overall health and wellness needs…We believe Lifeway is well positioned for long-term growth and value creation with strong industry tailwinds to fuel our business as we increasingly serve consumers looking for more self-care, immunity and gut health options during this time of global health crisis and uncertainty,” Smolyansky added.
The company stated that it expects to continue to benefit in 2020 from strong industry tailwinds including lower dairy and oil prices along with several other factors.
Lifeway Foods is based in Morton Grove, Ill., and stated that it is the country’s leading supplier of the fermented probiotic beverage known as kefir. Lifeway advised that both its fermented dairy and non-dairy products are sold in the U.S., Ireland, Mexico and the U.K.
Lifeway Foods began the day with a market capitalization of around $28.1 million with approximately 15.71 million shares outstanding. LWAY shares opened 21% higher today at $2.17 (+$0.38, +21.23%) over yesterday’s $1.79 closing price. The stock has traded today between $2.08 to $2.80 per share and is currently trading at $2.52 (+$0.73, +40.78%).
Disclosure: 1) Stephen Hytha compiled this article for Streetwise Reports LLC and provides services to Streetwise Reports as an independent contractor. He or members of his household own securities of the following companies mentioned in the article: None. He or members of his household are paid by the following companies mentioned in this article: None. 2) The following companies mentioned in this article are billboard sponsors of Streetwise Reports: None. Click here for important disclosures about sponsor fees. 3) Comments and opinions expressed are those of the specific experts and not of Streetwise Reports or its officers. The information provided above is for informational purposes only and is not a recommendation to buy or sell any security. 4) The article does not constitute investment advice. Each reader is encouraged to consult with his or her individual financial professional and any action a reader takes as a result of information presented here is his or her own responsibility. By opening this page, each reader accepts and agrees to Streetwise Reports’ terms of use and full legal disclaimer. This article is not a solicitation for investment. Streetwise Reports does not render general or specific investment advice and the information on Streetwise Reports should not be considered a recommendation to buy or sell any security. Streetwise Reports does not endorse or recommend the business, products, services or securities of any company mentioned on Streetwise Reports. 5) From time to time, Streetwise Reports LLC and its directors, officers, employees or members of their families, as well as persons interviewed for articles and interviews on the site, may have a long or short position in securities mentioned. Directors, officers, employees or members of their immediate families are prohibited from making purchases and/or sales of those securities in the open market or otherwise from the time of the interview or the decision to write an article until three business days after the publication of the interview or article. The foregoing prohibition does not apply to articles that in substance only restate previously published company releases. 6) This article does not constitute medical advice. Officers, employees and contributors to Streetwise Reports are not licensed medical professionals. Readers should always contact their healthcare professionals for medical advice.
A description of Mesoblast’s multi-site clinical trial and possible implication for the therapeutic are provided in an H.C. Wainwright & Co. report.
In an April 9 research note, H.C. Wainwright & Co. analyst Swayampakula Ramakanth reported that Mesoblast Ltd. (MESO:NASDAQ; MSB:ASX) intends to evaluate Ryoncil (remestemcel-L) as a treatment for COVID-19-caused acute respiratory distress syndrome (ARDS).
As such, in collaboration with the Cardiothoracic Surgical Trials Network, Mesoblast will launch a randomized, placebo-controlled Phase 2/3 trial of its allogeneic mesenchymal stem cell product. The study will involve 240 COVID-19 patients with ARDS and will be carried out at more than 20 U.S. centers. The trial’s primary endpoint will be the mortality rate at 28 days.
Initial data from the study are expected within months. If the results are positive then Mesoblast might be able to get Ryoncil fast tracked for label expansion, Ramakanth pointed out. Currently, Ryoncil is under priority review by the U.S. Food and Drug Administration for the treatment of steroid-refractory acute graft versus host disease in children. The associated PDUFA date is Sept. 30, 2020.
“We are encouraged by the news and believe the strong clinical data that Ryoncil generated to date provide a solid rationale for evaluating Ryoncil in COVID-19 patients with ARDS,” Ramakanth commented.
For instance, Ryoncil significantly improved respiratory function in patients with chronic obstructive pulmonary disease who had the elevated inflammation seen in COVID-19 patients with ARDS. This result was from a randomized, placebo-controlled study of 60 patients. Also, Ryoncil has been shown to have a positive safety profile in 1,100-plus patients .
H.C. Wainwright projects that Ryoncil will generate $150 million in risk-adjusted U.S. revenues by 2030. The financial institution has a Buy rating and a 12-month price target of $14 per share on Mesoblast, the current share price of which is $7.40.
Disclosure: 1) Doresa Banning compiled this article for Streetwise Reports LLC and provides services to Streetwise Reports as an independent contractor. She or members of her household own securities of the following companies mentioned in the article: None. She or members of her household are paid by the following companies mentioned in this article: None. 2) The following companies mentioned in this article are billboard sponsors of Streetwise Reports: None. Click here for important disclosures about sponsor fees. 3) Comments and opinions expressed are those of the specific experts and not of Streetwise Reports or its officers. The information provided above is for informational purposes only and is not a recommendation to buy or sell any security. 4) The article does not constitute investment advice. Each reader is encouraged to consult with his or her individual financial professional and any action a reader takes as a result of information presented here is his or her own responsibility. By opening this page, each reader accepts and agrees to Streetwise Reports’ terms of use and full legal disclaimer. This article is not a solicitation for investment. Streetwise Reports does not render general or specific investment advice and the information on Streetwise Reports should not be considered a recommendation to buy or sell any security. Streetwise Reports does not endorse or recommend the business, products, services or securities of any company mentioned on Streetwise Reports. 5) From time to time, Streetwise Reports LLC and its directors, officers, employees or members of their families, as well as persons interviewed for articles and interviews on the site, may have a long or short position in securities mentioned. Directors, officers, employees or members of their immediate families are prohibited from making purchases and/or sales of those securities in the open market or otherwise from the time of the interview or the decision to write an article until three business days after the publication of the interview or article. The foregoing prohibition does not apply to articles that in substance only restate previously published company releases.
Disclosures from H.C. Wainwright & Co., Mesoblast Ltd., First Take, April 9, 2020
Investment Banking Services include, but are not limited to, acting as a manager/co-manager in the underwriting or placement of securities, acting as financial advisor, and/or providing corporate finance or capital markets-related services to a company or one of its affiliates or subsidiaries within the past 12 months.
I, Swayampakula Ramakanth, Ph.D., Arthur He, Ph.D., Sean Lee and Sean Kang, certify that 1) all of the views expressed in this report accurately reflect my personal views about any and all subject securities or issuers discussed; and 2) no part of my compensation was, is, or will be directly or indirectly related to the specific recommendation or views expressed in this research report; and 3) neither myself nor any members of my household is an officer, director or advisory board member of these companies.
None of the research analysts or the research analyst’s household has a financial interest in the securities of Mesoblast Limited (including, without limitation, any option, right, warrant, future, long or short position).
As of March 31, 2020 neither the Firm nor its affiliates beneficially own 1% or more of any class of common equity securities of Mesoblast Limited.
Neither the research analyst nor the Firm has any material conflict of interest in of which the research analyst knows or has reason to know at the time of publication of this research report.
The research analyst principally responsible for preparation of the report does not receive compensation that is based upon any specific investment banking services or transaction but is compensated based on factors including total revenue and profitability of the Firm, a substantial portion of which is derived from investment banking services.
The Firm or its affiliates did not receive compensation from Mesoblast Limited for investment banking services within twelve months before, but will seek compensation from the companies mentioned in this report for investment banking services within three months following publication of the research report.
The Firm does not make a market in Mesoblast Limited as of the date of this research report.
– This technical analysis video I put together has a lot of great trading opportunities in it while providing a lot of educational content to help you see the markets and trade in a way that will reduce your risk/exposure when needed.
I use my BAN trading strategy which is I focus on the Best Asset Now and only trade the sector, index, or commodity that has the least risk and most upside potential at the current moment.
I won’t lie, im super picky and conservative so trades are few and far between but as a swing trader, or any trader for that matter, the quality of a trade alert trumps quantity. Watch this video below and see what I provide my subscribers every morning before the opening bell. If you like it, then join us and become a technical trader today!
I have to toot my own horn here a little because subscribers and I had our trading accounts close at a new high watermark for our accounts. We not only exited the equities market as it started to roll over, but we profited from the sell-off in a very controlled way, and yesterday we locked in more profits with our SPY ETF trade on this bounce.
As a technical analyst and trader since 1997, I have been through a few bull/bear market cycles in stocks and commodities. I believe I have a good pulse on the market and timing key turning points for investing and short-term swing traders. 2020 is going to be an incredible year for skilled traders. Don’t miss all the incredible moves and trade setups.
I hope you found this informative, and if you would like to get a pre-market video every day before the opening bell, along with my trade alerts. These simple to follow ETF swing trades have our trading accounts sitting at new high water marks yet again this week, not many traders can say that this year. Visit my Active ETF Trading Newsletter.
We all have trading accounts, and while our trading accounts are important, what is even more important are our long-term investment and retirement accounts. Why? Because they are, in most cases, our largest store of wealth other than our homes, and if they are not protected during a time like this, you could lose 25-50% or more of your entire net worth. The good news is we can preserve and even grow our long term capital when things get ugly like they are now and ill show you how and one of the best trades is one your financial advisor will never let you do because they do not make money from the trade/position.
If you have any type of retirement account and are looking for signals when to own equities, bonds, or cash, be sure to become a member of my Long-Term Investing Signals which we issued a new signal for subscribers.
Ride my coattails as I navigate these financial markets and build wealth while others lose nearly everything they own during the next financial crisis.
James Kwantes, editor of Resource Opportunities, outlines the potential upside as this project generator moves forward on its property in the Yukon.
Well-run project generators are brick houses in a speculative corner of the market, where the winds of commodity prices and dilution are often house wreckers. Their share prices are typically backstopped by healthy treasuries, royalties and equity stakes, as well as extensive claims holdings. They are businesses, not cash-burning lottery tickets like most junior explorecos.
But for many speculators, that level of diversification is a knock. Those bricks provide stability but weigh down the “rocket ship” when a junior exploration company hits a bona fide high-grade gold discovery. Project generators typically retain only limited exposure to discoveries through royalties or small equity stakes.
The picture changes completely, however, when project generators make a high-grade discovery on a wholly owned project. Azimut Exploration Inc. (AZM:TSX.V) proved it in January, with its Patwon gold discovery at the Elmer property in Quebec. Azimut is Quebec’s largest claims holder, diversified across metals and known for its technical savvy. On Jan. 14, the project generator announced multiple high-grade gold intercepts at the James Bay project, including 12.43 g/t Au over 6 meters and 27.36 g/t Au over 4.7 meters.
The day before the discovery was announced, Azimut shares closed at $0.50 (at a $31 million [$31M] market cap). The stock rocketed to $1.50 the following day, and remains at about that level despite the uncertainty and tough market conditions that persist in the junior mining complex. COVID-19 forced the suspension of Azimut’s follow-up 6,000-meter diamond drill program at Patwon.
Azimut closely resembles another project generator with a wholly owned gold project that will be drilled this summer: Strategic Metals Ltd. (SMD:TSX.V). Strategic, Yukon’s largest claims holder, is cashed-up to drill its Mount Hinton high-grade gold prospect in the Yukon Territory’s Keno Hill district. Strategic plans to spend about $3 million to explore Mount Hinton this season, including up to 6,000 meters of drilling (diamond and rotary air blast [RAB]). The program, of course, is dependent on how the coronavirus pandemic plays out in the coming weeks and months.
Strategic shares currently trade at about $0.35, for a $34M market capitalization. It’s a far cry from the $4.35 level ($381M market cap) that the stock hit in 2011. That share price was propelled by gold’s rise to US$1,900 an ounceless than $200 an ounce higher than current levelsas well as ATAC Resources Ltd.’s (ATC:TSX.V) high-grade gold discoveries at the Rackla property in Yukon (ATAC is part of the Strategic Exploration Group).
Doug Eaton, Strategic’s CEO and principal of Archer Cathro, the storied Yukon geological consultancy, was in the thick of it during ATAC’s high-grade discoveries.
Strategic Metals CEO Doug Eaton
But the veteran geologist says he’s more excited about Mount Hinton because of the volume of high-grade gold found at surface at such an early stage, during what appears to be a perfect storm for the gold price.
“Mount Hinton is the same kind of setup, but the project is much more readily accessible than Rackla, and it’s earlier stage,” Eaton said. “It’s much more exciting than ATAC was at this stage. We have a chance in there of a major gold discovery under the till or talus.”
Eaton’s comments about Mount Hinton’s possibilities sound like fairly typical Howe Street-style promotion. But a couple of key differences make his observations worth a closer examination:
His comments say much more about Mount Hinton’s prospectivity than they do the potential of ATAC’s Rackla project. Strategic holds a 6.4% stake in ATAC and is incentivized to see the company succeed. Eaton remains a believer that the Rackla deposits will one day produce tens of millions of ounces of gold.
Eaton, a geologist, has been working in the Yukon for almost 50 years. He has an almost-encyclopedic knowledge of Yukon mining projects, which helps Strategic snap up forgotten but highly prospective projects. Eaton has been involved in several of the Territory’s major discoveries, including the Casino copper-gold porphyry (now being developed by Western Copper and Gold Corp. [WRN:TSX; WRN:NYSE.MKT]).
Rewind: In the summer of 2017, Strategic sold six properties, including Mount Hinton, to a private company called Territory Metals. The terms of the deal hinted that Mount Hinton was no ordinary prospectin addition to a 2% net smelter return (NSR), the agreement included a 10% NSR on any small-scale high-grade gold production and a $1.5-million milestone payment if Territory identified a one-million-ounce gold-equivalent resource on any of the properties.
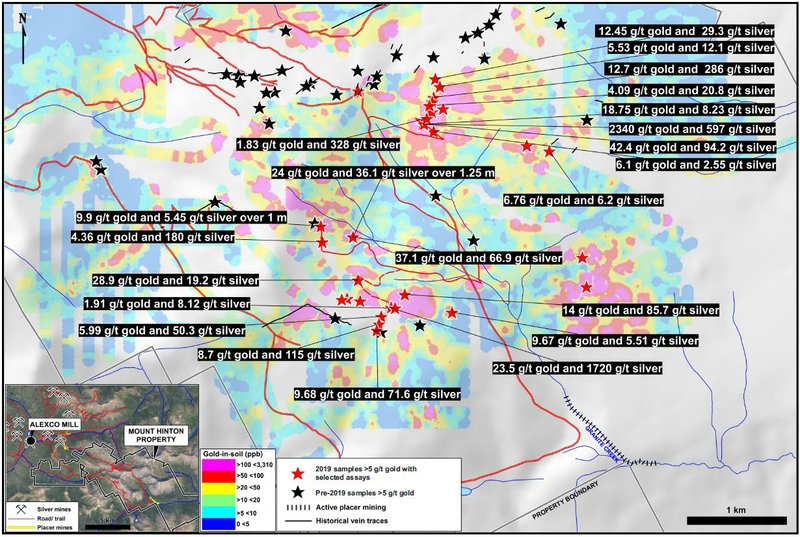
Territory’s go-public plans fizzled and Strategic got the property back. Archer Cathro geologists hit the ground hard in summer 2018. They extended a large geochemical soil anomaly and found multiple rock samples with high-grade gold samples that assayed greater than 9 g/t gold.
Last summer, Strategic hit pay dirt with a prospecting program focused on the 3.5×1.5-kilometer, gold-in-soil anomaly. One rock sample came back with a bonanza-grade assay: 2,340 g/t gold and 597 g/t silver. Follow-up prospecting discovered visible gold at this site (the first reported native gold on the property), and subsequent samples containing visible gold were not assayed. Other chip samples also carried high gold and silver values, including:
42.4 g/t gold and 94.2 g/t silver
9.9 g/t Au and 5.45 g/t Ag over 1 meter
24 g/t Au and 36.1 g/t Ag over 1.25 meters
23.5 g/t Au and 1,720 g/t Ag
202.0 g/t Au and 2,020 g/t Ag
Map of Mt. Hinton property
The property has not seen much exploration, despite its proximity to Alexco Resource Corp.’s (AXU:NYSE.MKT; AXR:TSX) Keno Hill projectMount Hinton is just three kilometers south of Alexco’s Bellekeno deposit. That’s largely because of road access difficulties. But the situation has improved dramatically in recent years, thanks to the thriving Granite Creek placer gold camp, located at the base of Mount Hinton. Two placer operators are pulling out multi-ounce gold nuggets and the Granite Creek drainage has become one of Yukon’s hottest gold camps.
Granite Creek placer operations, one of Yukon’s hottest mining camps, with Mount Hinton in the background.
Strategic brought in excavators last year to build a road network on the property, an effort that will continue this year once the snow melts. The planned 6,000-meter drill program is a large one for Strategic, but so is the size of the potential prize. “To find this material at surface is remarkable,” Eaton remarked.
Strategic geologist Steve Israel has now mapped three separate phases of mineralization on the property. More phases mean higher volumes of mineralizing fluids, which can lead to more gold.
With Mount Hinton a potential near-term catalyst, Strategic’s share priceand downsideis backstopped by a healthy treasury of $6.8 million and large equity stakes, as well as its extensive Yukon claims portfolio. Significant equity stakes include:
ATAC Resources (6.4%): high-grade gold deposits on the Rackla property
Rockhaven Resources Ltd. (RK:TSX.V) (36.3%): h-g 1.2M oz Au/28M oz Ag deposit, on a road
Terra CO2 (62.6%): pending patent on non-CO2-generating cement replacement
Precipitate Gold Corp. (PRG:TSX.V; PREIF:OTCBB) (24.3%): Barrick Gold Corp. (ABX:TSX; GOLD:NYSE) just signed a 70% earn-in agreement for Precipitate’s Pueblo Grande project beside Barrick’s Pueblo Viejo mine in Dominican Republic
Silver Range Resources Ltd. (SNG:TSX.V) (17.7%): project generator focused on h-g in Nevada, the Northwest Territories, Nunavut
Mount Hinton showing
With gold moving in the right direction, the Mount Hinton drill program positions Strategic to capture the shareholder value that can result from a high-grade discovery. It’s an outcome Eaton has seen beforeand why he kept Mount Hinton in the portfolio when it came back, rather than optioning it.
“We’ve turned down some pretty good offers for Mount Hinton,” he remarked. “That’s because everybody wants 100% of it.”
Gold is on the move as governments around the world fire up currency printing presses to counter the economic effects of COVID-19. That lift has not yet translated to the junior sector, despite gold hitting all-time highs in most major world currencies. Eaton believes the malaise of the past several years is partly a generational phenomenonyounger retail investors simply haven’t experienced the large multi-bagger wins that tend to drive money into the junior space.
“You have a generation of investors who have done well in mining but who are too old,” Eaton said. “The generations of younger investors haven’t benefited the way people who are older did in prior bull markets.” That may be about to change.
A high-grade gold discovery at Mount Hinton could trigger a rush to get into Strategic shares, if the action on Aug. 21, 2019, is any indication. That day, Strategic announced high-grade assays, including the bonanza-grade rock sample. The stock shot from $0.39 to $0.47 on multiples of average volume. It could be just a taste of what’s to come if Strategic drills a high-grade gold discovery at Mount Hinton this summer.
Strategic Metals (SMD: TSX.V, SMDZF: OTC) Price: $0.35/share Shares out: 96.6 million (108.85 million fully diluted) Market cap: $33.8 million
James Kwantes is the editor of Resource Opportunities, a subscriber supported junior mining investment publication. Kwantes has two decades of journalism experience and was the mining reporter at Vancouver Sun, the city’s paper of record.
Disclosure: I own Strategic Metals shares and Strategic is one of three Resource Opportunities sponsor companies. This article is not intended as financial advice and all investors need to conduct their own due diligence and/or consult an investment advisor.
Streetwise Disclosure: 1) James Kwantes’ disclosures are listed above. 2) The following companies mentioned in this article are billboard sponsors of Streetwise Reports: None. Click here for important disclosures about sponsor fees. The information provided above is for informational purposes only and is not a recommendation to buy or sell any security. 3) Statements and opinions expressed are the opinions of the author and not of Streetwise Reports or its officers. The author is wholly responsible for the validity of the statements. The author was not paid by Streetwise Reports for this article. Streetwise Reports was not paid by the author to publish or syndicate this article. Streetwise Reports requires contributing authors to disclose any shareholdings in, or economic relationships with, companies that they write about. Streetwise Reports relies upon the authors to accurately provide this information and Streetwise Reports has no means of verifying its accuracy. 4) The article does not constitute investment advice. Each reader is encouraged to consult with his or her individual financial professional and any action a reader takes as a result of information presented here is his or her own responsibility. By opening this page, each reader accepts and agrees to Streetwise Reports’ terms of use and full legal disclaimer. This article is not a solicitation for investment. Streetwise Reports does not render general or specific investment advice and the information on Streetwise Reports should not be considered a recommendation to buy or sell any security. Streetwise Reports does not endorse or recommend the business, products, services or securities of any company mentioned on Streetwise Reports. 5) From time to time, Streetwise Reports LLC and its directors, officers, employees or members of their families, as well as persons interviewed for articles and interviews on the site, may have a long or short position in securities mentioned. Directors, officers, employees or members of their immediate families are prohibited from making purchases and/or sales of those securities in the open market or otherwise from the time of the interview or the decision to write an article until three business days after the publication of the interview or article. The foregoing prohibition does not apply to articles that in substance only restate previously published company releases.
Resource Opportunities Disclaimer: Readers are advised that this article is solely for information purposes. Readers are encouraged to conduct their own research and due diligence, and/or obtain professional advice. The information is based on sources which the publisher believes to be reliable, but is not guaranteed to be accurate, and does not purport to be a complete statement or summary of the available data.
The metals markets are being pulled in multiple directions simultaneously like never before. The global virus-triggered economic freeze has caused industrial demand for all commodities to crater.
At the same time, mining output is also crashing as virus fears force many mines around the world to suspend operations.
What is the “right” equilibrium price for copper, silver, gold, and other metals in an environment of such extreme and unstable supply and demand stresses? The verdict of the market changes – often dramatically – day by day.
In March, hard assets tumbled along with stocks as investors priced in increasingly dire scenarios for the economy. A double-digit contraction in U.S. GDP and double-digit spike in unemployment became inevitable after economic lockdowns spread across the country.
Now hopes are growing for the economy being able to start reopening in May and reverse some of the damage done by the draconian policies prescribed Dr. Fauci and adopted by most state governors.
Still unknowable, however, is how quickly the economy will be able to heal itself… and to what extent demand for raw materials will recover toward pre-virus levels.
The biggest wild card in all this may be the effects of unprecedented fiscal and monetary stimulus.
Already the federal budget deficit is set to explode to an all-time record over $3 trillion (likely closer to $4 trillion) and represent a greater share of the U.S. economy than at any time since World War II. Already the Federal Reserve’s balance sheet has ballooned to $6.1 trillion as central bankers furiously try to prop up everything from mortgages to junk bonds.
All this is leading toward a devaluation of the U.S. dollar. That should naturally make sound money – gold and silver – more valuable in dollar terms.
However, as we saw last month, demand destruction amidst a wrecked economy pull down precious metals prices quite suddenly – if only temporarily. Gold has since rebounded strongly to a new 8-year high while silver is regaining its footing from historically depressed levels.
Drilling Down into Supply and Demand Fundamentals
The Silver Institute had forecasted in early February – back when the economic impact of the virus was thought to be minimal outside of China – that global silver demand would rise by 3% in 2020. The Institute projected supply would nearly keep pace with 2% growth (which would be the first annual increase in five years).
Those forecasts now have to be thrown out the window. Both demand and supply are set to plummet in the near term.
On the plus side, investment demand for silver bullion products spiked last month to levels dealers had never seen before, clearing out inventories of most coins, rounds, and bars.
Bullion buying has receded from the frantic pace seen at the peak of the panic but remains strong. Safe-haven buying could remain a feature of investor psychology for many months ahead until an effective COVID-19 vaccine is widely available – and that figures to be 12-18 months out.
As for mining supply, it’s going to be a long road ahead before mines are fully operational again. Platinum and palladium production is largely offline in South Africa. Mexico’s giant Peñasquito mine, one of the country’s leading sources of gold and silver, suspended operations on Monday.
The silver supply picture is complicated by the fact that few primary silver mines exist. Most silver is produced as a byproduct of mining other metals (copper, lead, zinc, gold).
Base metals producers are shutting down. As Reuters reported, “Copper prices advanced on Tuesday, with London copper touching a four-week high, as more virus-related mining disruptions in key producing countries sparked global supply concerns.”
Best-Case and Wors-Case Scenarios
Given the extreme dynamics setting up in supply, demand, and monetary expansionism, market conditions are likely to remain volatile. We do think we have seen “peak fear” in this cycle – but not the end of uncertainty surrounding the virus and the economic damage it could continue to inflict.
In a best-case scenario, COVID-19’s spread steadily declines into the summer and the economy embarks on a V-shaped recovery. In a worst-case scenario, the virus makes a devastating resurgence in the fall, the economy locks down all over again, and markets descend back into chaos.
If the optimistic outlook prevails, then rising industrial demand for copper, silver, platinum, and palladium can be expected to drive those metals higher. Demand can recover faster than supply, which can’t simply be turned back on like a switch.
If the pessimists prevail, then all bets are off. Rounds of asset deflation will lead to accelerating hyperinflationary monetary responses. Social chaos, martial law, and possibly a postponement of elections could result.
In such a scenario, no investment could be counted on to perform well. But gold, the ultimate money, can always be counted on retain value even during the worst of times.
The Money Metals News Service provides market news and crisp commentary for investors following the precious metals markets.
By CentralBankNews.info Pakistan’s central bank lowered its policy rate for the third time within a month, saying this should cushion the impact of the Coronavirus shock on growth and employment by easing borrowing costs and the cost of servicing debt by households and firms, helping ensure the economy is better placed to recover when the pandemic subsides. The State Bank of Pakistan (SBP) cut its policy rate by a further 200 basis points to 9.0 percent and has now cut it by 425 points this year following cuts on March 17 and March 24. As on March 24, today’s rate cut was decided by at an emergency meeting by the bank’s monetary policy committee. SBP is the fifth central bank to cut its rate at an unscheduled policy meeting this week, boosting this year’s emergency rate cuts by central banks worldwide to 63. On March 24 the policy committee said it remained ready to take further action in response to the evolving impact of the virus and since the global and domestic economy outlook has deteriorated. SBP noted the International Monetary Fund’s projection of a 3 percent contraction in the world economy this year, much deeper than during the global financial crises. “Moreover, there are severe risks of a worse outcome,” SBP said, adding its forward looking real interest rates are now around zero, about the middle of the range across most emerging markets. High-frequency domestic data – including retail sales, credit. card spending, cement production, export orders, tax collections and mobility data – suggest a significant slowdown in most parts of the country’s economy in recent weeks, SBP said. While there is still high uncertainty about the severity and duration of the economic shock from the virus, SBP revised down its forecast for economic growth in the current fiscal year, which ends July 1, to a contraction of 1.5 percent before a recovery to growth around 2 percent in 2020/21. With oil prices plummeting and demand weak, inflation is expected to be closer to the lower end of SBP’s earlier estimate of 11-12 percent for 2019/20, and then fall to 7-9 percent in 2020/21. Last week SBP proposed establishing a new executive board as part of upcoming amendments to the central bank law, giving in wide management and administrative powers, including the setting of monetary and exchange rate policy. SBP proposed the board should comprise the governor, deputy governor and non-executive members with terms of 5 years, that can be extended by another 5 years. This board would meet once a week.
The State Bank of Pakistan issued the following monetary policy statement:
“1. At its last meeting on 24th March 2020, the Monetary Policy Committee (MPC) noted the worsening outlook for global and domestic economic activity in the wake of the Corona pandemic. Given the unfolding situation, the MPC noted that it “remains ready to take whatever further actions become necessary in response to the evolving economic impact of the Coronavirus.” 2. Since the last MPC meeting, the global and domestic outlook has further deteriorated. The world economy is expected to enter into the sharpest downturn since the Great Depression, contracting by as much as 3 percent in 2020, according to projections released this week by the IMF. This is a much deeper recession than the 0.07 percent contraction during the global financial crisis in 2009. Moreover, there are severe risks of a worse outcome. In addition, global oil prices have plummeted further, with futures markets suggesting low prices will persist. Domestically, high-frequency indicators of activity―including retail sales, credit card spending, cement production, export orders, tax collections, and mobility data from Google’s recently introduced Community Mobility Reports―suggest a significant slowdown in most parts of the economy in recent weeks. On the inflation front, both the March CPI out-turn and more recent weekly SPI releases in April also show a marked reduction in inflation momentum. 3. While there is exceptionally high uncertainty about the severity and duration of the Coronavirus shock, the developments discussed above imply further downward revision in the outlook for growth and inflation. The economy is expected to contract by -1.5 percent in FY20 before recovering to around 2 percent growth in FY21. Inflation is expected to be close to the lower end of the previously announced 11-12 percent range this fiscal year, and to fall to 7-9 percent range next fiscal year. While there are some upside risks to headline inflation in case of temporary supply disruptions or food price shocks, these are unlikely to generate strong second-round effects due to the weakness of the economy. Similarly, the inflationary impact of the recent exchange rate depreciation is expected to be contained given low import demand and falling global prices. 4. In light of this reduction in growth and inflation expectations, the MPC decided at its emergency meeting today, to cut the policy rate by a further 200 basis points to 9 percent. This reduces forward looking real interest rates (defined as the policy rate less expected inflation) to around zero, which is about the middle of the range across most emerging markets. The MPC was of the view that this action would cushion the impact of the Coronavirus shock on growth and employment, including by easing borrowing costs and the debt service burden of households and firms, while also maintaining financial stability. It would also help ensure that economic activity is better placed to recover when the pandemic subsides. 5. The MPC highlighted that this rate cut would complement other measures recently taken by the SBP to support the economy, including concessional financing to companies that do not lay off workers, one-year extension in principal payments, doubling of the period for rescheduling of loans from 90 to 180 days, and concessional financing for hospitals and medical centers incurring expenses to combat the Coronavirus pandemic.” www.CentralBankNews.info