The US dollar has risen again relative to a basket of major currencies. The US dollar index (#DX) closed in the positive zone (+0.32). Yesterday, the US Senate approved a $484 billion coronavirus aid bill aimed at supporting the US economy. The House of Representatives should vote on the bill on Thursday. It will be the fourth package of measures to fight coronavirus. Also, yesterday, US President Donald Trump announced an immigration ban for 60 days. This ban was initiated to help Americans who are trying to regain jobs lost due to coronavirus. Trump said the suspension of immigration would put “unemployed Americans first in line for jobs” as the country reopens.
The Australian dollar has been growing. According to preliminary data from the country’s statistical office, retail sales jumped by 8.2% in March compared to February figures. The record growth was caused by the rush demand for food and essential goods under quarantine and self-isolation. However, the Governor of the Reserve Bank of Australia (RBA), Philip Lowe, said that in the first half of the year, Australia’s economy could show the biggest contraction since the Great Depression.
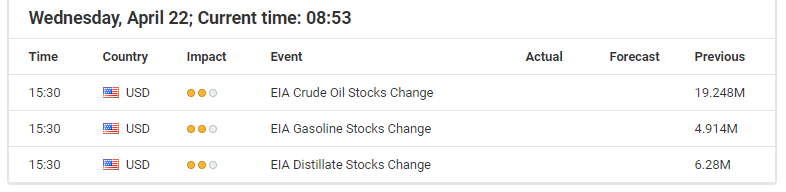
The “black gold” prices have fallen again. Currently, futures for the WTI crude oil are testing the $11.00 mark per barrel. At 17:30 (GMT+3:00), US crude oil inventories will be published.
Market indicators
Yesterday, there was the bearish sentiment in the US stock market: #SPY (-3.04%), #DIA (-2.71%), #QQQ (-3.69%).
The 10-year US government bonds yield fell again. At the moment, the indicator is at the level of 0.60-0.61%.
The news feed on 2020.04.22:
– UK consumer price index at 09:00 (GMT+3:00);
– Canada’s core consumer price index at 15:30 (GMT+3:00).
Expected drop in global demand bearish for coffee price
The International Coffee Organization (ICO) estimates world coffee consumption in 2019/20 at 169.34 million bags, 0.7%, higher than in 2018/19. And the trade statistics show the global coffee export rose in February over year compared with January exports. Thus world coffee exports amounted to 11.11 million bags in February 2020 compared with 10.83 million in February 2019, when exports in January 2020 amounted to 10.29 million bags compared with 11.14 million in January 2019. This indicates a rising demand for coffee and an upside risk for coffee prices. At the same time ICO estimates that a 1 percentage point drop in GDP growth results in a reduction in the growth of global demand for coffee of 0.95 percentage points. The estimate doesn’t include the impact of social distancing measures on out-of-home consumption when large parts of the hospitality industry are under lockdown and workplaces are closed. And the International Monetary Fund forecast a 3% drop in global growth in 2020, which represents a downgrade of 6.3 percentage points from January 2020. An expected drop in global demand is bearish for coffee.
– A very interesting setup is currently taking place in the VIX chart with our Adaptive Fibonacci Price Modeling system that has us quite concerned. The Daily VIX chart running our Fibonacci Price Modeling system, which is one of our primary price modeling tools, is suggesting upside price targets for the VIX near 110, 134 and 158. The reason these levels are extended into future price expectations is because of the recent explosion in volatility over the past 90 days.
Yet, the real concern originates from the question “what would it take for the VIX to rally to these levels and is this a real possibility in the current global markets?”. So, we attempted to answer that question by attempting to identify what it would take for the VIX to skyrocket above 110 in the near future.
Before we continue, be sure to opt-in to our free market trend signals before closing this page, so you don’t miss our next special report!
Volatility Index (VIX) Daily Chart
First, pay attention to this VIX Daily chart and the targeted levels above 100. Please understand that in order for the VIX to skyrocket higher reaching levels above 100 would require another massive downside price move in the US and global markets – something unexpected and very dramatic. Is this an unrealistic expectation given the current global market environment headed into Q2 and Q3? We really don’t believe it is an unrealistic potential expectation at this point.
We’ve recently authored a series of articles suggesting the global markets are marching through a human psychological process related to the virus event (crisis). Somewhat similar to the “Grieving Process”, a crisis event prompts a similar set of human emotions ending in an angry and helpless feeling. We believe this early stage crisis event process has positioned the global markets clearly within the Denial and Stigmatization phase of the crisis event. These are the Second and Third human responses to a major crisis event (Source: www.orau.gov/).
If we are correct and the markets are reacting to the Denial and Stigmatization phases of this virus event, then the next transitional phases are Fear and Withdrawal/Hopelessness. Could this transition into a more fearful human instinct prompt a massive collapse in the US and global markets? If so, what would be the cause of this transition into fear?
We believe the transition may come from the continued economic strain that is likely to become very evident in Q2 and Q3 of 2020. Right now, the US stock market is only -10% to -15% from recent all-time highs. The reality of the virus event for traders is that this is only a minor blip in the markets so far. Yes, the markets fell much lower recently, but traders/investors have shrugged off the real risks and put their faith into the US Fed and global central banks to navigate a successful recovery. What if that doesn’t happen as we expect?
What if the real numbers for Q2 and Q3 come in dramatically lower than expected? What if global GDP contracts by -10% or -15% for the next 12+ months? What if consumers don’t return as quickly as we expect?
The Race To Cash and Bonds Again: I talked with Cory Fleck from Korelin Economics Report today. Listen to our thoughts on the race to the safe-haven assets, bonds, and cash. What about gold and gold stocks? These have been more correlated to the US markets but the charts of the major stocks and gold are still very bullish.
Take a look at this Weekly YM Chart and pay attention to the downward sloping price channels that help guide us to a conclusion. Additionally, the Adaptive Fibonacci Price Modeling system is showing us a new target near 12,475. If this is accurate, then a breakdown in price over the next 6+ months may push the YM to levels near 12,500 (-50% from the recent peak in April 2020). A move like this would certainly prompt a massive increase in the VIX and would frighten traders, investors, and consumers into a “helplessness” mentality. What can you do when the markets are collapsing like this except wait for the bottom.
The one thing we can be certain of is that at long as humans exist on this planet, economies will continue to function at some level. Being human in today’s world means we engage in economic activity and trade. Therefore, we believe there is a moderate risk that the US and global markets have completely misinterpreted the true price valuations and expectations based on this research. Simply put, we believe a Denial phase has taken root where investors and traders simply deny and ignore the real potential for future collapse.
I keep pounding my fists on the table hoping people can see what I am trying to warn them about, which is the next major market crash, much worse than what we saw in March. See this article and video for a super easy to understand the scenario that is playing out as we speak.
If you want to learn more about the Super-Cycles and Generational Cycles that are taking place in the markets right now, please take a minute to review our Change Your Thinking – Change Your Future book detailing our research into these super-cycles. It is almost impossible to believe that our researchers called this move back in March 2019 in our book and reports.
As a technical analyst and trader since 1997, I have been through a few bull/bear market cycles in stocks and commodities. I believe I have a good pulse on the market and timing key turning points for investing and short-term swing traders. 2020 is going to be an incredible year for skilled traders. Don’t miss all the incredible moves and trade setups.
Subscribers of my ETF trading newsletter had our trading accounts close at a new high watermark. We not only exited the equities market as it started to roll over in February, but we profited from the sell-off in a very controlled way with TLT bonds for a 20% gain. Yesterday we closed out SPY ETF trade taking advantage of this bounce and our account is at another all-time high value. Exciting times for us technical traders!
I hope you found this informative, and if you would like to get a pre-market video every day before the opening bell, along with my trade alerts. These simple to follow ETF swing trades have our trading accounts sitting at new high water marks yet again this week, not many traders can say that this year. Visit my Active ETF Trading Newsletter.
We all have trading accounts, and while our trading accounts are important, what is even more important are our long-term investment and retirement accounts. Why? Because they are, in most cases, our largest store of wealth other than our homes, and if they are not protected during a time like this, you could lose 25-50% or more of your entire net worth. The good news is we can preserve and even grow our long term capital when things get ugly like they are now and ill show you how and one of the best trades is one your financial advisor will never let you do because they do not make money from the trade/position.
If you have any type of retirement account and are looking for signals when to own equities, bonds, or cash, be sure to become a member of my Long-Term Investing Signals which we issued a new signal for subscribers.
Ride my coattails as I navigate these financial markets and build wealth while others lose nearly everything they own during the next financial crisis.
The technical pattern is still ambiguous on the EUR/USD currency pair. The euro is being traded in a flat. At the moment, the local support and resistance levels are 1.0845 and 1.0875, respectively. Financial market participants assess the effects of the coronavirus pandemic. The “black gold” prices have reached multi-year lows due to a significant drop in demand. Over the past month, the number of jobless claims in the US has exceeded 20 million. We recommend opening positions from key levels.
Today, the publication of important economic releases is not expected.
Indicators do not give accurate signals: the price has crossed 50 MA.
The MACD histogram is near the 0 mark.
Stochastic Oscillator is in the neutral zone, the %K line is above the %D line, which indicates the bullish sentiment.
Trading recommendations
Support levels: 1.0845, 1.0815, 1.0800
Resistance levels: 1.0875, 1.0900, 1.0935
If the price fixes below 1.0845, the EUR/USD currency pair is expected to fall. The movement is tending to the round level of 1.0800.
An alternative could be the growth of EUR/USD quotes to 1.0900-1.0930.
The GBP/USD currency pair
Technical indicators of the currency pair:
Prev Open: 1.24286
Open: 1.22863
% chg. over the last day: -1.15
Day’s range: 1.22746 – 1.23306
52 wk range: 1.1466 – 1.3516
There are aggressive sales on the GBP/USD currency pair. The British pound has reached two-week lows. The demand for risky assets is still low. Currently, GBP/USD quotes are consolidating. The local support and resistance levels are 1.2275 and 1.2335, respectively. We do not exclude a further drop in GBP/USD quotes. We recommend opening positions from key support and resistance levels.
In March, the consumer price index in the UK met market expectations and counted to 1.5% (y/y).
Indicators signal the power of sellers: the price has fixed below 50 MA and 100 MA.
The MACD histogram is in the negative zone, but above the signal line, which gives a weak signal to sell GBP/USD.
Stochastic Oscillator is in the neutral zone, the %K line is above the %D line, which gives a signal to buy GBP/USD.
Trading recommendations
Support levels: 1.2275, 1.2250, 1.2200
Resistance levels: 1.2335, 1.2390, 1.2445
If the price fixes above 1.2335, further growth of GBP/USD quotes is expected. The movement is tending to 1.2380-1.2400.
An alternative could be a decrease in the GBP/USD currency pair to 1.2240-1.2220.
The USD/CAD currency pair
Technical indicators of the currency pair:
Prev Open: 1.41448
Open: 1.42103
% chg. over the last day: +0.44
Day’s range: 1.41607 – 1.42376
52 wk range: 1.2949 – 1.4668
USD/CAD quotes have become stable after a prolonged rally. At the moment, the trading instrument is testing the “mirror” support of 1.4160. The 1.4245 mark is the key resistance. The loonie is still under pressure amid aggressive sales in the “black gold” market. We do not exclude further growth of the USD/CAD currency pair. Investors expect important economic reports from Canada. We recommend opening positions from key levels.
At 15:30 (GMT+3:00), inflation data will be published in Canada.
Indicators do not give accurate signals: the price is testing 50 MA.
The MACD histogram has started to decline, indicating a possible correction of the USD/CAD currency pair.
Stochastic Oscillator is in the neutral zone, the %K line is below the %D line, which indicates the bearish sentiment.
Trading recommendations
Support levels: 1.4160, 1.4110, 1.4050
Resistance levels: 1.4245, 1.4300
If the price fixes below the support level of 1.4160, USD/CAD quotes are expected to correct. The movement is tending to 1.4120-1.4100.
An alternative could be the growth of the USD/CAD currency pair to 1.4270-1.4300.
The USD/JPY currency pair
Technical indicators of the currency pair:
Prev Open: 107.612
Open: 107.761
% chg. over the last day: +0.14
Day’s range: 107.516 – 107.868
52 wk range: 101.19 – 112.41
The USD/JPY currency pair is still being traded in a prolonged flat. There is no defined trend. Financial market participants expect additional drivers. At the moment, the local support and resistance levels are 107.50 and 107.85, respectively. Demand for “safe haven” currencies remains at a fairly high level. We recommend paying attention to the dynamics of US government bonds yield. Positions should be opened from key levels.
The news feed on Japan’s economy is calm.
Indicators do not give accurate signals: the price has crossed 50 MA and 100 MA.
The MACD histogram is near the 0 mark.
Stochastic Oscillator is in the neutral zone, the %K line has crossed the %D line. There are no signals at the moment.
Trading recommendations
Support levels: 107.50, 107.25, 106.95
Resistance levels: 107.85, 108.10
If the price fixes below the support level of 107.50, a further drop in the USD/JPY quotes is expected. The movement is tending to 107.20-107.00.
An alternative could be the growth of the USD/JPY currency pair to 108.10-108.30.
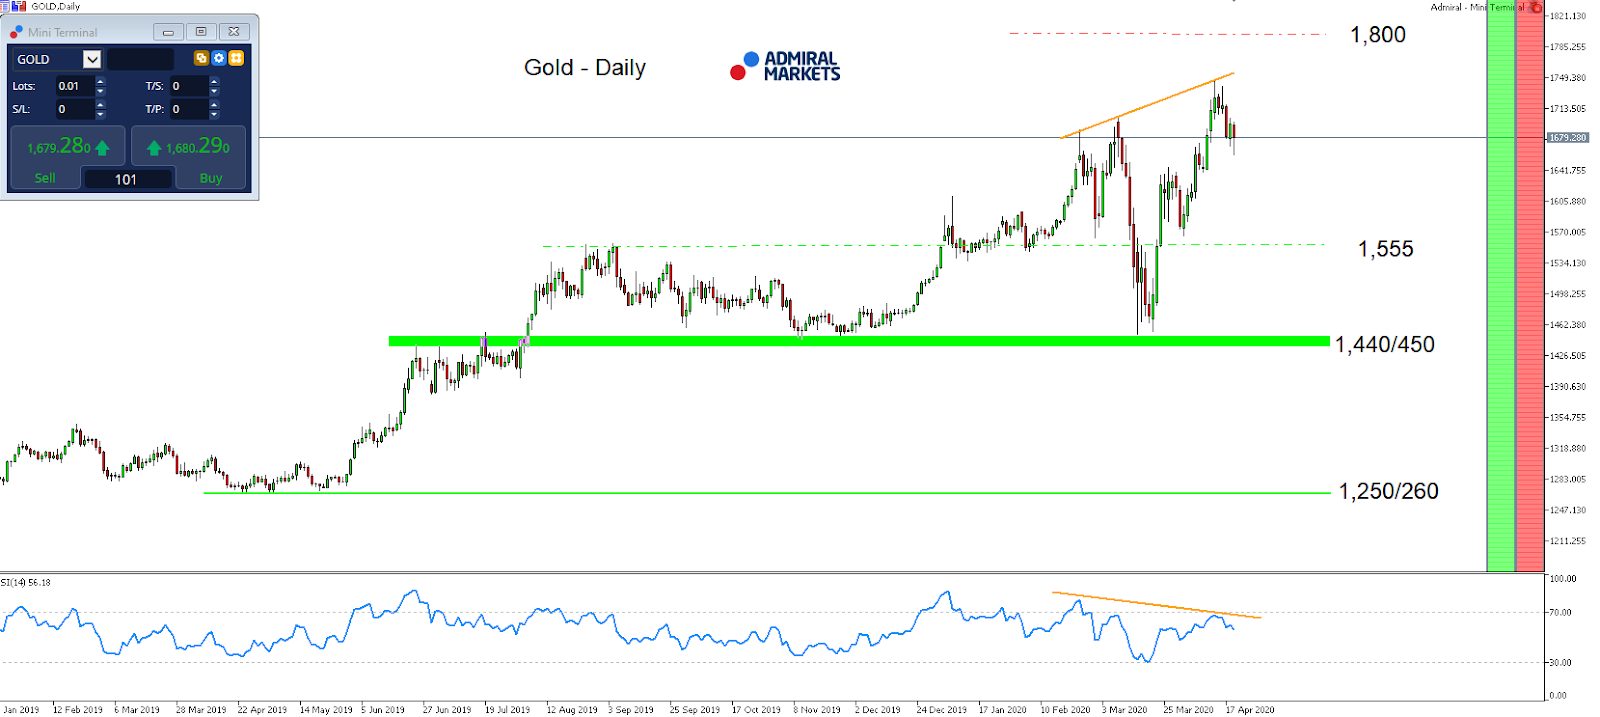
After Gold pushed above 1,700 USD for the first time since 2012, marking new yearly highs, the precious metal is now seeing a correction, even though the overall bullish picture hasn’t substantially changed.
A potential technical driver for the current corrective move is the potential bearish divergence in the RSI(14) on the daily time-frame pointing which pointed to some diminishing bullish momentum and left the break to new highs already at an earlier time with a grain of salt in our opinion.
The first potential target can now be found around 1,650 USD, but looking at Gold from a purely technical perspective leaves us with a clearly bullish impression as long as we trade above 1,440/450 USD, a little shorter above 1,555 USD.
Fundamentally, in the short-term, a new wave of de-leveraging hitting global financial markets remains an option, mainly driven by the given global USD shortage, resulting in a new wave of aggressive selling in Gold due to liquidity reasons.
Mid- to long-term Gold stays bullish, especially given the massive monetary stimulus from the Fed over the last weeks with pumping its balance sheet to now over six trillion USD:
Source: Admiral Markets MT5 with MT5SE Add-on Gold Daily chart (between January 21, 2019, to April 21, 2020). Accessed: April 21, 2020, at 10:00pm GMT – Please note: Past performance is not a reliable indicator of future results, or future performance.
In 2015, the value of Gold fell by 10.4%, in 2016, it increased by 8.1%, in 2017, it increased by 13.1%, in 2018, it fell by 1.6%, in 2019, it increased by 18.9%, meaning that after five years, it was up by 28%.
Discover the world’s #1 multi-asset platform
Admiral Markets offers professional traders the ability to trade with a custom, upgraded version of MetaTrader 5, allowing you to experience trading at a significantly higher, more rewarding level. Experience benefits such as the addition of the Market Heat Map, so you can compare various currency pairs to see which ones might be lucrative investments, access real-time trading data, and so much more. Click the banner below to start your FREE download of MT5 Supreme Edition!
Disclaimer: The given data provides additional information regarding all analysis, estimates, prognosis, forecasts or other similar assessments or information (hereinafter “Analysis”) published on the website of Admiral Markets. Before making any investment decisions please pay close attention to the following:
This is a marketing communication. The analysis is published for informative purposes only and are in no way to be construed as investment advice or recommendation. It has not been prepared in accordance with legal requirements designed to promote the independence of investment research, and that it is not subject to any prohibition on dealing ahead of the dissemination of investment research.
Any investment decision is made by each client alone whereas Admiral Markets shall not be responsible for any loss or damage arising from any such decision, whether or not based on the Analysis.
Each of the Analysis is prepared by an independent analyst (Jens Klatt, Professional Trader and Analyst, hereinafter “Author”) based on the Author’s personal estimations.
To ensure that the interests of the clients would be protected and objectivity of the Analysis would not be damaged Admiral Markets has established relevant internal procedures for prevention and management of conflicts of interest.
Whilst every reasonable effort is taken to ensure that all sources of the Analysis are reliable and that all information is presented, as much as possible, in an understandable, timely, precise and complete manner, Admiral Markets does not guarantee the accuracy or completeness of any information contained within the Analysis. The presented figures refer that refer to any past performance is not a reliable indicator of future results.
The contents of the Analysis should not be construed as an express or implied promise, guarantee or implication by Admiral Markets that the client shall profit from the strategies therein or that losses in connection therewith may or shall be limited.
Any kind of previous or modeled performance of financial instruments indicated within the Publication should not be construed as an express or implied promise, guarantee or implication by Admiral Markets for any future performance. The value of the financial instrument may both increase and decrease and the preservation of the asset value is not guaranteed.
The projections included in the Analysis may be subject to additional fees, taxes or other charges, depending on the subject of the Publication. The price list applicable to the services provided by Admiral Markets is publicly available from the website of Admiral Markets.
Leveraged products (including contracts for difference) are speculative in nature and may result in losses or profit. Before you start trading, you should make sure that you understand all the risks.
Most Asian stocks were shaky on Wednesday morning as oil prices clawed back some of their record-setting losses amid fears of a prolonged coronavirus economic downturn.
The historic meltdown in Oil prices has left a lasting impact on global sentiment and this continues to be reflected across currency, commodity and stock markets.
Dollar to flex its muscles in dash for cash
The Dollar has enough ammunition to defend its throne as global recession fears, severely depressed oil prices and chaos surrounding the coronavirus spark an investor flight to cash.
In regards to the technical picture, the Dollar Index remains in a wide range on the daily timeframe with prices trading above 100.00 as of writing. The upside momentum may open a path towards 101.00. A solid breakout above this level could trigger a move higher towards 103.00.
Alternatively, sustained weakness below 101.0 could trigger a decline back towards 99.90.
USDJPY trades within 100 pip range
If any contender could seize the Dollar’s throne, it will be the Japanese Yen which has appreciated against every G10 currency since the start of 2020.
The unfavourable global macroeconomic conditions, explosive levels of volatility and coronavirus related fears have fuelled risk aversion. In times of uncertainty, the Japanese Yen remains a traders best friend and this should hold true in Q2.
Looking at the technical perspective, the USDJPY is ranged bound on the daily timeframe with support at 107.00 and resistance at 108.00. A breakout above or below the identified levels may trigger a breakout/down opportunity towards 109.30 or 105.60.
EURUSD on standby…
The Euro has weakened against almost every single G10 currency since the start of the month thanks to rising recession fears and concerns around a sovereign debt crisis.
Buying sentiment towards the currency is set to evaporate as investors turn to the world’s most liquid currency, King Dollar. In regards to the technical picture, a breakdown below 1.0840 could open a path towards 1.0780 and 1.0650. Should 1.0840 prove to be a reliable support, prices could rebound back towards 1.0900 and 1.1000 in the medium term.
Let’s not forget about the GBPUSD
Technical traders will continue to observe how the GBPUSD behaves around 1.2300 level. A solid breakdown below this point could spark a decline towards 1.2200. Alternatively, a rebound from 1.2300 should inspire a move back towards 1.2400 and potentially 1.2500.
Commodity spotlight – Gold
Gold is trading within a $25 range on the daily timeframe. A breakout above $1700 could spark a move higher towards $1735.
Alternatively, a breakdown below $1675 may signal a selloff towards $1640.
Disclaimer: The content in this article comprises personal opinions and should not be construed as containing personal and/or other investment advice and/or an offer of and/or solicitation for any transactions in financial instruments and/or a guarantee and/or prediction of future performance. ForexTime (FXTM), its affiliates, agents, directors, officers or employees do not guarantee the accuracy, validity, timeliness or completeness, of any information or data made available and assume no liability as to any loss arising from any investment based on the same.
On Tuesday the 21st of April, trading on the euro closed 4 pips down at 1.0856. The pair continued its sideways trend, trading within a corridor of 1.0815 to 1.0897. The US dollar was trading up in the first half of the day, before losing ground in the second.
In the Asian session, the collapse in oil prices continued. US stock indices took a dive. As investors moved towards safe haven assets, the US dollar went up, while US10Y bond yields went down. In the US session, the EURUSD pair bounced from 1.0817 to reach 1.0850.
Day’s news (GMT+3):
15:30 Canada: CPI (Mar).
16:00 US: housing price index (Feb).
17:00 Eurozone: consumer confidence (Apr).
17:30 US: EIA crude oil stocks change (17 Apr).
Current situation:
The pair has been trading sideways since the 16th of April. Due to the situation with oil, the future direction is unclear. S&P 500 futures are trading up. Oil prices are correcting following their collapse. This gives us reason to believe that the EURUSD pair will rise to 1.0905. For now, we can’t see it rising any further since all the euro crosses are in the red. This is more indicative of an impending downwards reversal.
British CPI data rose 1.5% year-on-year in March compared to 1.7% in February (forecast: 1.5%). This data sent the pound upwards.
Today, Canada will publish data on consumer prices and housing prices, while Eurozone data on consumer confidence is set to be released. Today’s main event is the EIA crude oil stocks change report. Yesterday’s API report showed stocks had risen by 13.2 million barrels. Considering that WTI oil prices went negative for the first time in history, there can’t be a negative reaction to this news.
Shares of Exelixis reached a new 52-week high price after the firm reported positive topline results from its Pivotal Phase 3 CheckMate -9ER trial evaluating Opdivo® (nivolumab) in combination with CABOMETYX® (cabozantinib) in previously untreated advanced renal cell carcinoma.
Oncology-focused biotechnology company Exelixis Inc. (EXEL:NASDAQ) and global pharmaceutical firm Bristol-Myers Squibb Co. (BMY:NYSE) today announced that “CheckMate -9ER, a pivotal Phase 3 trial evaluating Opdivo® (nivolumab) in combination with CABOMETYX®(cabozantinib) compared to sunitinib in previously untreated advanced or metastatic renal cell carcinoma (RCC), met its primary endpoint of progression-free survival at final analysis, as well as the secondary endpoints of overall survival at a pre-specified interim analysis, and objective response rate.”
Dr. Toni Choueiri, director of the Lank Center for Genitourinary Oncology at Dana-Farber Cancer Institute and Jerome and Nancy Kohlberg Professor of Medicine at Harvard Medical School, commented, “The results from the pivotal CheckMate -9ER trial clearly demonstrate the combination of cabozantinib plus nivolumab provides a clinically meaningful benefit in the key efficacy measures of progression-free survival and overall survival for previously untreated kidney cancer patients…If approved, this combination may become an important new first-line option for patients with metastatic renal cell carcinoma. We look forward to presenting detailed results at an upcoming congress.”
Bristol Myers Squibb’s development lead of genitourinary cancers, Brian Lamon, Ph.D., stated, “The positive topline results from the Phase 3 CheckMate -9ER trial evaluating Opdivo in combination with CABOMETYX build on our understanding of Opdivo-based regimens, and we look forward to working with global health authorities to help bring this new combination regimen to previously untreated patients, a population that despite recent advances, remains in need of additional therapeutic options that extend survival.”
Gisela Schwab, M.D., Exelixis’ president, product development and medical affairs and chief medical officer, remarked, “Given the growing body of data showing that CABOMETYX may create a more immune-permissive tumor environment that may enhance response to immune checkpoint inhibitors, we have been eagerly awaiting the results for the combination of cabozantinib and nivolumab in previously untreated renal cell carcinoma…We’re delighted that the trial met its primary endpoint of progression-free survival as well as the secondary endpoints of overall survival and objective response rate, demonstrating consistent benefit for the combination in previously untreated renal cell carcinoma patients. We look forward to our continued collaboration with Bristol Myers Squibb as we work toward regulatory filings in the near future.”
The firm noted that the CheckMate -9ER study is a randomized, multi-national Phase 3 trial evaluating patients with previously untreated advanced or metastatic renal cell carcinoma. The company reported that it intends to submit detailed CheckMate -9ER results in a presentation at an upcoming medical conference.
Opdivo® was defined by the firm as “a programmed death-1 (PD-1) immune checkpoint inhibitor that is designed to uniquely harness the body’s own immune system to help restore anti-tumor immune response.” Opdivo has already been approved by the FDA for several different indications and the company stated that it has become an important treatment option across multiple types of cancers. The release indicated that Opdivo is currently approved in more than 65 countries including the U.S., EU, Japan and China.
The company advised that CABOMETYX® tablets are approved in the U.S., EU, Japan and other countries for the treatment of patients with advanced renal cell carcinoma (RCC) and for the treatment of patients with HCC who have been previously treated with sorafenib. The company explained that RCC is the most common type of kidney cancer in adults, occurs approximately twice as much in men than women and accounts for greater that 140,000 yearly deaths worldwide.
Bristol Myers Squibb is a large global biopharmaceutical company headquartered in New York, N.Y., with a market cap of over $140 billion.
Exelixis Inc. is an oncology-focused biotechnology company based in Alameda, Calif., that is focused on developing commercializing new medicines for difficult-to-treat cancers. The company has developed four commercially available products, CABOMETYX® (cabozantinib), COMETRIQ® (cabozantinib), COTELLIC® (cobimetinib) and MINNEBRO® (esaxerenone). The firm has advised that it has entered into agreements with leading pharmaceutical companies to market these medicines to patients globally.
Exelixis has a market capitalization of around $5.98 billion with approximately 307.7 million shares outstanding and a short interest of about 5.8%. EXEL shares opened 18% higher today at $23.00 (+$3.56, +18.31%) over Friday’s $19.44 closing price and reached a new 52-week high price this morning of $24.90. The stock has traded today between $22.49 and $24.90 per share and is currently trading at $23.54 (+$4.10, +21.09%).
Disclosure: 1) Stephen Hytha compiled this article for Streetwise Reports LLC and provides services to Streetwise Reports as an independent contractor. He or members of his household own securities of the following companies mentioned in the article: None. He or members of his household are paid by the following companies mentioned in this article: None. 2) The following companies mentioned in this article are billboard sponsors of Streetwise Reports: None. Click here for important disclosures about sponsor fees. 3) Comments and opinions expressed are those of the specific experts and not of Streetwise Reports or its officers. The information provided above is for informational purposes only and is not a recommendation to buy or sell any security. 4) The article does not constitute investment advice. Each reader is encouraged to consult with his or her individual financial professional and any action a reader takes as a result of information presented here is his or her own responsibility. By opening this page, each reader accepts and agrees to Streetwise Reports’ terms of use and full legal disclaimer. This article is not a solicitation for investment. Streetwise Reports does not render general or specific investment advice and the information on Streetwise Reports should not be considered a recommendation to buy or sell any security. Streetwise Reports does not endorse or recommend the business, products, services or securities of any company mentioned on Streetwise Reports. 5) From time to time, Streetwise Reports LLC and its directors, officers, employees or members of their families, as well as persons interviewed for articles and interviews on the site, may have a long or short position in securities mentioned. Directors, officers, employees or members of their immediate families are prohibited from making purchases and/or sales of those securities in the open market or otherwise from the time of the interview or the decision to write an article until three business days after the publication of the interview or article. The foregoing prohibition does not apply to articles that in substance only restate previously published company releases. 6) This article does not constitute medical advice. Officers, employees and contributors to Streetwise Reports are not licensed medical professionals. Readers should always contact their healthcare professionals for medical advice.
This plant processed meat of 20 thousand pigs per day or 5% of their total slaughter in the USA. Earlier, due to the increasing incidence of coronavirus cases in personnel, another two US corporations took similar measures. The world’s largest pork processing company, Smithfield Foods, closed its Sioux Falls plant in South Dakota. Its share in pork processing in the United States is estimated at 4-5%. Tyson Foods Inc closed the pig farm in Columbus Junction in Iowa. In addition, several smaller American and Canadian plants also closed. In particular, Olymel plant closed in Canada. Another factor that could possibly increase LHOG quotes could be China’s announcement of a 29.1% decline in pork production in the 1st quarter of 2020 compared to the same period in 2019. The main reason is the same as in the US: the closure of meat processing plants due to the coronavirus cases in their personnel. It should be noted that amid a decline in production, the domestic pork price in China increased by 16%.
Gold struggled to shine on Tuesday, falling more than 1% as chaos in the oil markets triggered panic selling across the board and forced investors to raise cash to cover margin calls.
The historic collapse in Oil prices and rising fears over a severe global recession may create another dash for cash, essentially exposing Gold prices to downside shocks. Although the unfavourable global macroeconomic conditions, chaos surrounding the coronavirus outbreak and gloomy outlook for Oil markets could accelerate the flight to safety, Gold may not be the first destination of choice for investors.
Looking at the technical picture, the precious metal is descending lower on the daily timeframe with prices trading around below $1675 as of writing. Sustained weakness below this level could encourage a decline towards $1650 and $1635.
Alternatively, a breakout back above $1675 should trigger a move back to the psychological $1700 level.
Dash for cash boosts Dollar
Everyone wanted a piece of the Greenback after the collapse in Oil prices compounded sent tremors across the board.
The selloff witnessed in Oil prices were so severe and unthinkable that investors sprinted towards the safe embrace of the world’s most liquid currency. Appetite towards the Dollar should remain stimulated by the prevalent themes weighing heavily on investor confidence. As the general uncertainty and unease foster widespread caution, King Dollar is positioned to shine through the chaos.
Focusing on the technical picture, the Dollar Index is pushing higher on the daily charts. A decisive daily close above 101.0 could open the doors towards 103.0. Should 101.0 prove to be reliable resistance, prices could sink back towards 99.90.
Currency spotlight – GBPUSD
Sterling tumbling over 1% against the Dollar on Tuesday and weakened against almost every single G10 as general unease and risk aversion guided investors to more liquid currencies.
Appetite towards the Pound is likely to deteriorate further on Brexit uncertainty and fears around the United Kingdom plunging into an economic recession. As the Dollar appreciate on the safe-haven demand, this could only mean more pain for the British Pound.
Technical traders will continue to observe how the GBPUSD behaves around 1.2300. Weakness under this level should open a path towards 1.2200 and lower. Alternatively, a rebound back above 1.2400 could signal an incline towards 1.2500.
Disclaimer: The content in this article comprises personal opinions and should not be construed as containing personal and/or other investment advice and/or an offer of and/or solicitation for any transactions in financial instruments and/or a guarantee and/or prediction of future performance. ForexTime (FXTM), its affiliates, agents, directors, officers or employees do not guarantee the accuracy, validity, timeliness or completeness, of any information or data made available and assume no liability as to any loss arising from any investment based on the same.