Author Archive for InvestMacro – Page 90

Will the Fed Minutes finally push Gold back above 1,600 USD?

By Admiral Markets

Source: Economic Events February 19, 2020 – Admiral Markets’ Forex Calendar

Wednesday, today, stands to be a very interesting day for Gold traders. Since several Fed members are planned to give speeches, and the FOMC minutes from the Fed’s January 30th rate decision is to be published.

In general, the outlook in Gold turned very positive over the first two weeks of February, since the precious metal’s reaction to the solid US economic data, as well as the solid reaction to Fed chairman Powell’s neutral (and, in our opinion, Gold-bearish) comments at the semi-annual testimony in front of the Congress last week.

His comments stated that the current rate policy stance is appropriate, but market participants still expect the Fed to cut rates at least once, by 25 basis points, in 2020 (according to the Fed Watch Tool). Any dovish hints, especially from the FOMC minutes this evening, are a potential bullish driver, bringing the region around 1,600 USD into our focus again.

The main driver for such a move could certainly put pressure on 10-year US Treasury yields and an attack or even possibly a break below the technically important level of 1.50%.

If we get to see a break lower here, a dynamic move lower in US yields should follow, favouring gains in Gold then.

Technically, Gold stays clearly bullish as long as the precious metal trades above its daily trend-support around 1,440/450 USD, keeping the potential next target on the upside around 1,650/700 USD active.

If we get to see a short-term drop below 1,550 USD, the picture would only darken short-term and favour Intraday-Short engagements, activating the region around 1,510/515 USD:

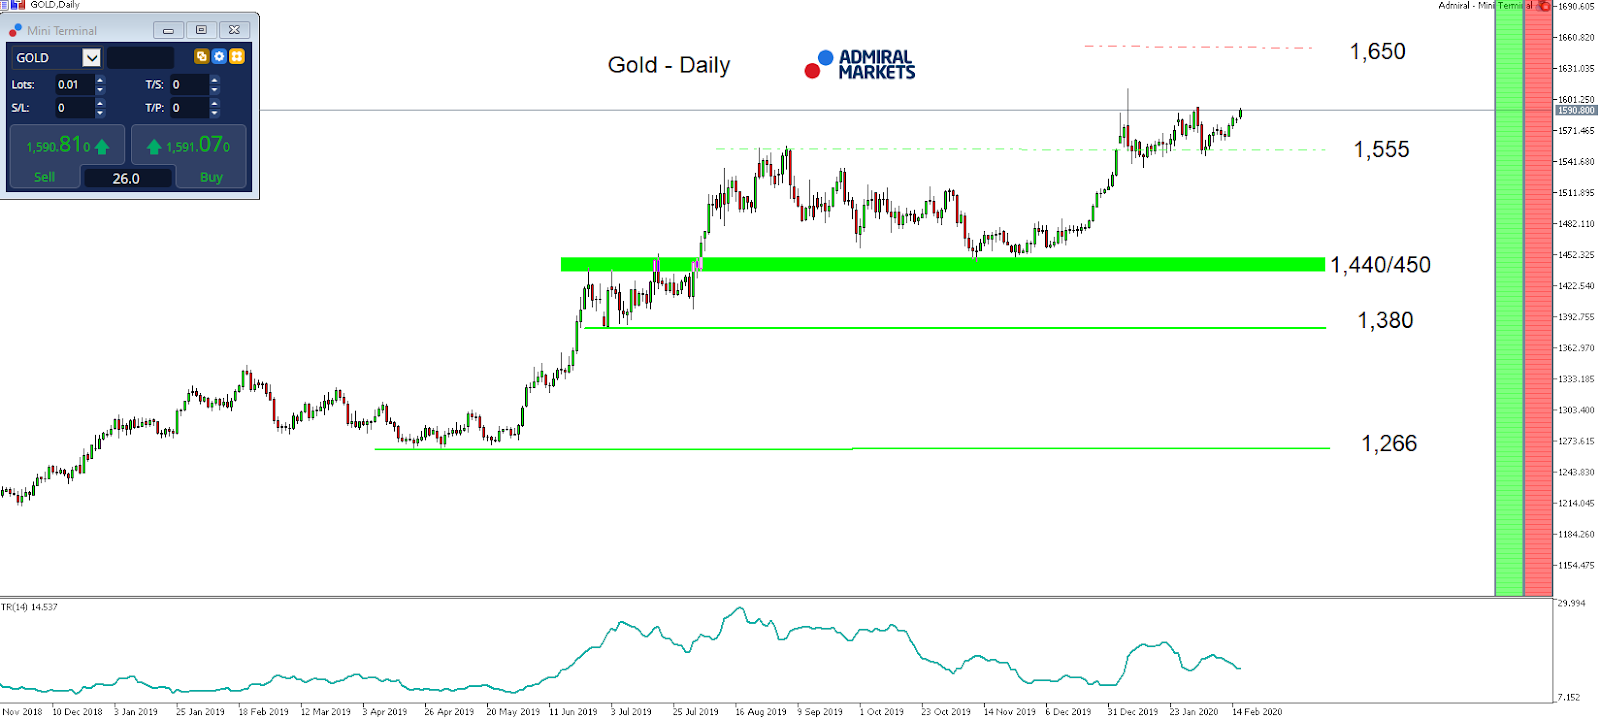
Source: Admiral Markets MT5 with MT5-SE Add-on Gold Daily chart (between November 16, 2018, to February 18, 2020). Accessed: February 18, 2020, at 10:00pm GMT – Please note: Past performance is not a reliable indicator of future results, or future performance.

In 2015, the value of Gold fell by 10.4%, in 2016, it increased by 8.1%, in 2017, it increased by 13.1%, in 2018, it fell by 1.6%, in 2019, it increased by 18.9%, meaning that after five years, it was up by 28%.

Discover the world’s #1 multi-asset platform

Admiral Markets offers professional traders the ability to trade with a custom, upgraded version of MetaTrader 5, allowing you to experience trading at a significantly higher, more rewarding level. Experience benefits such as the addition of the Market Heat Map, so you can compare various currency pairs to see which ones might be lucrative investments, access real-time trading data, and so much more. Click the banner below to start your FREE download of MT5 Supreme Edition!

Download MetaTrader 5 and begin trading today!

Disclaimer: The given data provides additional information regarding all analysis, estimates, prognosis, forecasts or other similar assessments or information (hereinafter “Analysis”) published on the website of Admiral Markets. Before making any investment decisions please pay close attention to the following:

  1. This is a marketing communication. The analysis is published for informative purposes only and are in no way to be construed as investment advice or recommendation. It has not been prepared in accordance with legal requirements designed to promote the independence of investment research, and that it is not subject to any prohibition on dealing ahead of the dissemination of investment research.
  2. Any investment decision is made by each client alone whereas Admiral Markets shall not be responsible for any loss or damage arising from any such decision, whether or not based on the Analysis.
  3. Each of the Analysis is prepared by an independent analyst (Jens Klatt, Professional Trader and Analyst, hereinafter “Author”) based on the Author’s personal estimations.
  4. To ensure that the interests of the clients would be protected and objectivity of the Analysis would not be damaged Admiral Markets has established relevant internal procedures for prevention and management of conflicts of interest.
  5. Whilst every reasonable effort is taken to ensure that all sources of the Analysis are reliable and that all information is presented, as much as possible, in an understandable, timely, precise and complete manner, Admiral Markets does not guarantee the accuracy or completeness of any information contained within the Analysis. The presented figures refer that refer to any past performance is not a reliable indicator of future results.
  6. The contents of the Analysis should not be construed as an express or implied promise, guarantee or implication by Admiral Markets that the client shall profit from the strategies therein or that losses in connection therewith may or shall be limited.
  7. Any kind of previous or modeled performance of financial instruments indicated within the Publication should not be construed as an express or implied promise, guarantee or implication by Admiral Markets for any future performance. The value of the financial instrument may both increase and decrease and the preservation of the asset value is not guaranteed.
  8. The projections included in the Analysis may be subject to additional fees, taxes or other charges, depending on the subject of the Publication. The price list applicable to the services provided by Admiral Markets is publicly available from the website of Admiral Markets.
  9. Leveraged products (including contracts for difference) are speculative in nature and may result in losses or profit. Before you start trading, you should make sure that you understand all the risks.

By Admiral Markets

Is The Technology Sector Setting Up For A Crash? Part II

By TheTechnicalTraders.com

In the first section of this article, we highlighted three key components/charts illustrating why the “rally to the peak” is very likely a result of a continued Capital Shift away from risk and into the US stock market as an attempt to avoid foreign market growth concerns.  This method of pouring capital into the US stock market is a process that is driving incredible asset rallies in the US technology sector.  Already the US technology sector (FANG and our Custom Technology Index charts) are up almost 15% in 2020.  How long will it last and when will it end?

Recently, China has revised the Coronavirus data with a sharp increase in infection cases – now over 40,000.  We believe the true number of infections in China are currently well above 250,000 from video content and other data we’ve researched.  We believe economic data originating from China for January and February 2020 will show a dramatic 60% to 80%+ decrease in activity for many of the major cities.  Satellite technology suggests manufacturing and consumer activity in most major Chinese cities is only a fraction of what would be considered normal – 10% to 20% or normal levels.

This means the manufacturing capacities in China have collapsed and that supply to the rest of the world will collapse as well.  This means major electronics manufacturers and suppliers will suddenly quickly experience shortages and outages very shortly.  This is why we believe the technology sector may come under severe pressure over the next 6+ months and why we believe the “high-flying” technology sector may be one of the biggest sector rotations of 2020.

Just how much of a “collapse” are we talking about?  How can anyone attempt to quantify the true scope of this potential “black swan” event and how it may result in sector rotation?

Let’s start with some of the basics.  First, the global economy has been focused on Chinese manufacturing and production of goods for more than the past 20+ years.  Over the past 10 to 15+ years, the Chinese economy has become the central hub of manufacturing and supply for some of the largest economies on the planet.  At this point in time, nearly every nation on the planet relies on China in some form for some essential goods that support their local economies.

This image showing the size and scope of global economies may highlight just how interconnected we really are.  The Chinese economy is 15.4% of the total global economy when taken as a whole compared to other global economies.  Yet, China supplies a very large number of these other nations with cheap goods, essential components for industry and manufacturing as well as a very large number of everyday essential items for consumers.  So, when we attempt to consider a “shut-down” of the Chinese economy as they attempt to deal with this virus, try to think about how long it would take for the supply chain to dry up and then what?

Source: visualcapitalist.com

Try to take a moment and think about the total scope of what we’re dealing with in regards to this Corona Virus outbreak.  Take a minute to review this graphic from InvestmentWatchBlog.com showing some of the “Best” US firms and how many rely on China for manufacturing/supply of critical components or generate a large portion of their revenues from China.

Source: investmentwatchblog.com

It has been over 45 days since the end of 2019.  China knew about this virus fairly early in December 2019.  So, in reality, it has been over 75 days since this outbreak first started. The data accumulated by Johns Hopkins CSSE started on January 20, 2020.  Since that time, China has experienced a more than 4000% increase in new Corona Virus cases – that is only about 21 days.  The number of infected has risen to well over 64,000 and we believe that number (reported by the Chinese government) may be only a fraction (1/8th to 1/6th) of the real infected rate.

Source: gisanddata.maps.arcgis.com

Not all technology companies rely on China to supply products and software.  Many technology companies have strong core business enterprises that are independent of Chinese manufacturing.  Yet we continue to believe the disruption in manufacturing and supply from China will disrupt forward earnings data enough to potentially send the technology sector much lower than current levels.  Additionally, if capital rushes out of technology in search of a more suitable opportunity – where will that capital find a new home?

What happens if this “shut down” of the Chinese economy lasts for more than 6+ months and what happens to the world economy as a result of this virus outbreak?  In Part III of this research article, we’ll try to share our insight a bit further and attempt to show you where real opportunity exists as this rotation plays out.

Join my Swing Trading ETF Wealth Building Newsletter if you like what you read here and ride my coattails as I navigate these financial markets and build wealth while others lose nearly everything they own.

Chris Vermeulen
TheTechnicalTraders.com

NOTICE: Our free research does not constitute a trade recommendation or solicitation for our readers to take any action regarding this research.  It is provided for educational purposes only.  Our research team produces these research articles to share information with our followers/readers in an effort to try to keep you well informed.  Visit our web site (www.thetechnicaltraders.com) to learn how to take advantage of our members-only research and trading signals.


Ichimoku Cloud Analysis 18.02.2020 (AUDUSD, NZDUSD, USDCAD)

Article By RoboForex.com

AUDUSD, “Australian Dollar vs US Dollar”

AUDUSD is trading at 0.6688; the instrument is moving below Ichimoku Cloud, thus indicating a descending tendency. The markets could indicate that the price may test the cloud’s downside border at 0.6710 and then resume moving downwards to reach 0.6565. Another signal to confirm further descending movement is the price’s rebounding from the resistance level. However, the scenario that implies further decline may be canceled if the price breaks the cloud’s upside border and fixes above 0.6755. In this case, the pair may continue growing towards 0.6835. After breaking the support area and fixing below 0.6645, the price may resume moving upwards and break the downside border of a Triangle pattern.

AUDUSD
Risk Warning: the result of previous trading operations do not guarantee the same results in the future

NZDUSD, “New Zealand Dollar vs US Dollar”

NZDUSD is trading at 0.6415; the instrument is moving below Ichimoku Cloud, thus indicating a descending tendency. The markets could indicate that the price may test the cloud’s downside border at 0.6420 and then resume moving downwards to reach 0.6275. Another signal to confirm further descending movement is the price’s rebounding from the descending channel’s upside border. However, the scenario that implies further decline may be canceled if the price breaks the cloud’s upside border and fixes above 0.6485. In this case, the pair may continue growing towards 0.6565.

NZDUSD
Risk Warning: the result of previous trading operations do not guarantee the same results in the future

USDCAD, “US Dollar vs Canadian Dollar”

USDCAD is trading at 1.3245; the instrument is moving below Ichimoku Cloud, thus indicating a descending tendency. The markets could indicate that the price may test the cloud’s downside border at 1.3255 and then resume moving downwards to reach 1.3065. Another signal to confirm further descending movement is the price’s rebounding from the rising channel’s downside border. However, the scenario that implies further decline may be canceled if the price breaks the cloud’s upside border and fixes above 1.3325.

USDCAD

Article By RoboForex.com

Attention!
Forecasts presented in this section only reflect the author’s private opinion and should not be considered as guidance for trading. RoboForex LP bears no responsibility for trading results based on trading recommendations described in these analytical reviews.

Japanese Candlesticks Analysis 18.02.2020 (EURUSD, USDJPY)

Article By RoboForex.com

EURUSD, “Euro vs. US Dollar”

As we can see in the H4 chart, the descending tendency continues. By now, EURUSD has completed several reversal candlestick patterns, such as Inverted Hammer, close to the support level. Right now, the pair may start reversing. We may assume that later the price may test the resistance level at 1.0920 and then resume its decline to reach 1.0790. However, one shouldn’t exclude the possibility that the price may continue falling without reversing and forming any rising structures.

EURUSD
Risk Warning: the result of previous trading operations do not guarantee the same results in the future

USDJPY, “US Dollar vs. Japanese Yen”

As we can see in the H4 chart, USDJPY is still moving inside the rising channel. After forming a Hanging Man pattern, the pair has reversed and is currently trading sideways. The current situation implies that the pair may finish the correction and resume growing to reach the resistance level at 110.20. At the same time, the pair may choose another scenario, according to which it is expected to return to 109.20 without testing the resistance level.

USDJPY
Risk Warning: the result of previous trading operations do not guarantee the same results in the future

EURGBP, “Euro vs. Great Britain Pound”

As we can see in the H4 chart, EURGBP continues trading close to the support level, where it has formed several reversal patterns, such as Harami. Right now, we may assume that after reversing the price may grow towards 0.8393. However, one shouldn’t exclude an opposite scenario, which implies that the instrument may break the support level and updates its closest lows. In this case, that the pair may continue the descending tendency without any corrections to reach the closest target at 0.8282.

EURGBP

Article By RoboForex.com

Attention!
Forecasts presented in this section only reflect the author’s private opinion and should not be considered as guidance for trading. RoboForex LP bears no responsibility for trading results based on trading recommendations described in these analytical reviews.

The Analytical Overview of the Main Currency Pairs on 2020.02.18

by JustForex

The EUR/USD currency pair

Technical indicators of the currency pair:
  • Prev Open: 1.08404
  • Open: 1.08334
  • % chg. over the last day: -0.07
  • Day’s range: 1.08230 – 1.08371
  • 52 wk range: 1.0879 – 1.1572

The EUR/USD currency pair continues to consolidate after a prolonged decline. There is no defined trend. Investors expect additional drivers. The local support and resistance levels are 1.08250 and 1.08650, respectively. Technical correction is not ruled out in the nearest future. Today participants of financial markets will evaluate a number of important indicators of business activity in Germany and Eurozone. We recommend opening positions from key levels.

The Economic News Feed for 18.02.2020:

  • – ZEW indices of economic sentiment (EU, GER) – 12:00 (GMT+2:00);
EUR/USD

Indicators do not give accurate signals: the price is testing 50 MA.

The MACD histogram is in the negative zone, which indicates a bearish sentiment.

The Stochastic Oscillator is in the neutral zone, the %K line crosses the %D line. There are no signals at the moment.

Trading recommendations
  • Support levels: 1.08250, 1.08000
  • Resistance levels: 1.08650, 1.09000, 1.09400

If the price fixes below 1.08250, expect further decline toward 1.0800-1.07700.

Alternatively, the quotes could grow toward 1.09000-1.09200.

The GBP/USD currency pair

Technical indicators of the currency pair:
  • Prev Open: 1.30322
  • Open: 1.30033
  • % chg. over the last day: -0.35
  • Day’s range: 1.29857 – 1.30070
  • 52 wk range: 1.1959 – 1.3516

GBP/USD quotes have gone down. The trading instrument has updated the local lows. Sterling is now being consolidated. The key range is 1.29800-1.30150. Today participants of financial markets will evaluate the report on the UK labor market. We recommend you to pay attention to the difference between actual and forecast values of indicators. Positions should be opened from key levels.

At 11:30 (GMT+2:00) UK will publish the labor statistics.

GBP/USD

The price has fixed below 100 MA, which signals the strength of the sellers.

The MACD histogram is in the negative zone and below the signal line, which gives a strong signal to sell GBP/USD.

The Stochastic Oscillator is in the neutral zone, the %K line is below the %D line, which also indicates a bearish mood.

Trading recommendations
  • Support levels: 1.29800, 1.29450, 1.29200
  • Resistance levels: 1.30150, 1.30650, 1.31000

If the price fixes below 1.29800, GBP/USD quotes are expected to fall further. Potential for movement to 1.29500-1.29200.

Alternatively the quotes could grow toward 1.30500-1.30700.

The USD/CAD currency pair

Technical indicators of the currency pair:
  • Prev Open: 1.32500
  • Open: 1.32330
  • % chg. over the last day: -0.06
  • Day’s range: 1.32296 – 1.32554
  • 52 wk range: 1.2949 – 1.3566

The technical pattern on the USD/CAD currency pair is still ambiguous. The CAD is being traded in a long flat. Currently, the following local support and resistance levels can be distinguished: 1.32400 and 1.32650. The trading instrument has a downside potential. We recommend you to pay attention to the dynamics of oil quotes. Positions should be opened from key levels.

Today the news background on the Canadian economy is quite calm.

USD/CAD

Indicators do not give accurate signals: the price has crossed 50 MA and 100 MA.

MACD has crossed to the positive zone, which indicates the development of bullish moods.

The Stochastic Oscillator is located in the neutral zone, the %K line has crossed the %D line. There are no signals at the moment.

Trading recommendations
  • Support levels: 1.32400, 1.32250, 1.32000
  • Resistance levels: 1.32650, 1.32850, 1.33000

If the price fixes below 1.32400, expect the quotes to fall toward 1.32000.

Alternatively, the quotes could grow toward 1.32800-1.33000.

The USD/JPY currency pair

Technical indicators of the currency pair:
  • Prev Open: 109.846
  • Open: 109.876
  • % chg. over the last day: +0.02
  • Day’s range: 109.657 – 109.877
  • 52 wk range: 104.45 – 113.53

USD/JPY currency pair is still moving sideways. The technical picture is ambiguous. At the moment local support and resistance levels are at 109.650 and 109.850, respectively. Investors are waiting for additional drivers. We recommend you to keep track of current information regarding the coronavirus spread in China. Positions should be opened from key levels.

Publication of important economic releases from Japan is not planned.

USD/JPY

Indicators do not give an accurate signal: 50 MA crossed 100 MA.

The MACD histogram has crossed the negative zone, indicating a bearish sentiment.

The Stochastic Oscillator is located in the neutral zone, the %K line is above the %D line, which gives a signal to buy USD/JPY.

Trading recommendations
  • Support levels: 109.650, 109.550, 109.300
  • Resistance levels: 109.850, 110.000, 110.100

If the price fixes below 109.650, expect the quotes to rise toward 109.400-109.200.

Alternatively, the quotes will grow toward 110.100-110.300.

by JustForex

Responsible and sustainable investing the ‘new norm in less than five years’

By George Prior – Environmental, social and governance (ESG) investing will be “the new norm in less than five years”, affirms the CEO of one of the world’s largest independent financial services and advisory organizations.

The bold prediction from Nigel Green, chief executive and founder of deVere Group, which does business in 100 countries, comes as Amazon boss Jeff Bezos commits $10bn to fight climate change.

Mr Green notes: “Responsible and impactful investing is already fundamentally reshaping the global investment landscape.

“It is the trend that will define the 2020s – so much so that I’m confident that environmental, social and governance (ESG) investing will be the new norm in less than five years.”

He continues: “The growth in responsible investing will be driven by demand by both retail and institutional investors.

“Global awareness has skyrocketed about environmental, social and governance considerations over the last 12-18 months, in part due to the activism of the likes of Greta Thunberg, Extinction Rebellion and Jane Fonda, and due to the growing media coverage of climate change and its serious effects.

“As a result, these issues now sit at the heart of the investment decision-making process amongst eight out of 10 millennials, according to a recent deVere survey. Some argue this is likely to be even higher for Generation Z.”

This is of major consequence due to the Great Wealth Transfer. “This will see an estimated $68 trillion pass down from baby-boomers to millennials over the next couple of decades – and it could make them even richer than previous generations. It’s expected that this significant wealth transfer will begin in the next few years,” affirms the deVere CEO.

Currently, the U.S. and Europe lead the charge in ESG investment, with 80% of the responsible-investing market.  Asia is currently lagging behind. But, says Mr Green, this could change and will further fuel demand.

“By 2025, Asia will be home to 33 of the world’s 49 megacities, according to Global Data. The rise in the number of megacities – cities in which there are more than 10 million permanent residents – will be fuelled by millennials who seem to be fully on board with ESG.”

“In addition, ESG investing will allow governments across Asia to realise some of their wider major policies. These include shrinking labour forces and weakening economic growth, migration, and global low-carbon transition threats.

“Demand for ESG-related strategies will go stratospheric when Asia goes full throttle into this direction, which it will do.”

Nigel Green goes on to say: “As the sector develops around the world, naturally, institutional investors will pile in, bringing with them their institutional capital and institutional expertise. This will act as a further catalyst for the ESG investment arena.”

He goes on to say: “One of the most compelling reasons why responsible investing will be the defining trend in less than five years is due to an increasing amount of evidence and ongoing research that ESG-related strategies can regularly outperform the market.

“It would not be unreasonable to assume that those companies that offer ESG-compliant investment could ultimately become some of the world’s most valuable companies.  Could they take over from the current big tech firms? I would not be surprised.”

The deVere CEO concludes: “The investment world is evolving perhaps more rapidly than it has in decades due to the rise and rise of responsible and impactful investing.”

About:

deVere Group is one of the world’s largest independent advisors of specialist global financial solutions to international, local mass affluent, and high-net-worth clients.  It has a network of more than 70 offices across the world, over 80,000 clients and $12bn under advisement


The Epidemic in China Remains in the Spotlight.

by JustForex

In the course of yesterday’s trading, the U.S. dollar practically did not change the basket of major currencies. The US and Canadian financial markets were closed due to the holidays. The attention of investors was focused on the EUR, which continued to decline. Investors expect reports from Germany, which are expected to indicate a sharp deterioration in sentiment and increase pessimism about the prospects of the European economy.

The Australian dollar depreciated against the US dollar after the Reserve Bank of Australia (RBA) expressed its concerns about the coronavirus. In the minutes of the last RBA meeting on monetary policy, the bank confirmed that low interest rates are likely to continue for a long time and added that it will weaken the monetary policy even more if necessary. Meanwhile, the People’s Bank of China added to the stimulating measures the reduction of the medium-term lending rate to a new record low level.

Oil went down again. Futures on WTI oil are currently testing $51.50 per barrel.

Market Indicators

Yesterday, the U.S. stock market did not operate due to Washington Day.

The yields on 10-year U.S. government bonds have fallen again. The are currently at 1.54-1.55%.

The Economic News Feed for 18.02.2020:
  • – UK labor market data – 11:30 (GMT+2:00);
  • – ZEW economic sentiment index in Germany – 12:00 (GMT+2:00).

by JustForex

RoboMarkets Adds New Instruments and Extends R Trader Functionality

February 18, 2020

Limassol, Cyprus — RoboMarkets, a European broker, has added more than 500 CFDs on European stocks to its multi-asset trading platform called R Trader. New instruments include stocks of companies from 11 European countries, which haven’t been introduced to the platform in the past. Apart from extending the pool of available trading instruments, the Company has integrated tick charts into the terminal and updated Watchlists.

Among new instruments added to R Trader are CFDs on stocks of the most liquid companies from different European countries. RoboMarkets clients can now access markets of Belgium, Denmark, Ireland, Spain, Italy, the Netherlands, Norway, Portugal, Finland, France, and Sweden. Assets from Austria, Germany, and the United Kingdom that were already available in the platform have also been updated as the Company has significantly expanded their lists.

Together with the addition of new instruments to R Trader, the Company has implemented a function that wasn’t available in the terminal before – tick charts. The decision to add this feature was influenced by numerous client requests for indicators of such type. From now on, RoboMarkets clients have access to Tick-by-Tick charts: Bid, Ask, Trades. In addition to that, there is an opportunity to aggregate ticks into candlesticks/bars and create charts using a set number of ticks.

Kiryl Kirychenka, the head of the R Trader project, is commenting on the innovation: “This kind of chart is built after the completion of a certain number of orders, ticks. This aggregation type can be used on intraday charts with time intervals not more than 5 days. For example, one can build a histogram, which displays the price dynamics of a chosen asset at the opening price, the high, the low, and the closing price every time when the number of orders reaches 155. In the settings, users can set any number of ticks for aggregation between 1 and 10,000″.

The list of functions in R Trader after the latest update does not end here. The Company has added additional intervals, such as “5 min”, “30 min”, and “2h” to the following Watchlists: Top Gainers, Volume Leaders, and Top Losers. These watchlists are a unique and powerful analytical tool whereby users can, in a matter of seconds, obtain data on different trading instruments that showed the highest dynamics over the chosen period of time (from 5 minutes to a day).

“5 min”, “30 min”, and “2h” intervals help to assess impulse of the current candlestick. When trading on volatile markets, we sometimes need to know not only today’s direction of the stock movement but also its price behavior at any given hour. This feature will be useful for intraday traders, who actively trade stocks during the daytime.” – Kiryl Kirychenka added.

It’s worth noting that starting from December 2019, a mobile version of the R Trader platform is available at https://rtrader.umstel.com/mobile.

About RoboMarkets

RoboMarkets is an investment company with the CySEC license No. 191/13. RoboMarkets offers investment services in many European countries by providing traders, who work on financial market, with access to its proprietary trading platforms. More detailed information about the Company’s products and activities can be found on the official website at www.robomarkets.com.


Oil-rich economies will be hit the most in the next 10 years – the harder they fall

By ForexNewsNow

While the world faces consequences of global warming, the oil-rich economies are facing great threats in the coming 10 years. As the countries depend on natural resources so much, in case of any crisis, their economies could face a lot of problems.

Like Qatar, if other countries will learn to adapt, diversify and develop new industries, to take the problems that the future might bring more lightly.

Others, who will fail to do so, will slowly have to go down to oblivion unless the prices will rise again to a profitable level.

Countries like Saudi Arabia, the world’s most profitable (oil) company, for example, that had a huge decrease in their petroleum exports had experienced troubled economies, more revolutionary riots, a lack of social programs for their citizens, etc. In these cases, finding alternatives could help, for example, solar power. Since Saudi Arabia is located at one of the sunniest places on earth, this could make a huge difference.

Dropping the prices

Many countries, like the U.S., can benefit from the lower prices, but for the countries that produce the oil, this can be devastating. Previously, the Organization of Petroleum Exporting Countries has agreed to continue pinching oil production, as it is actively trying to prevent a further decline in oil prices.

In recent years, the growth of oil production in the U.S. has resulted in excessive amounts of oil, causing some to question the future of OPEC.

Climate Change

Other than the excessive production of oil, the world faces climate change. As time passes, the effects of it are becoming more and more apparent in the economies of many countries. In the future, countries that are fully dependent on natural resources could face an economic crisis.

In the parallel of threats to the resources, solar and wind power continue to set new low-cost rates, battery costs for processing the erratic production of renewables are declining too, and electric vehicle sales are rising rapidly. New designs of nuclear power plants are also underway which are meant to be cheaper and safer than their forebears.

In this kind of situation, oil-rich economies need to be more creative to ensure their well-being in the coming years.

Lack of reserves

In the case of Brunei, according to the BP World Energy Outlook, oil and gas reserves are expected to run out by as early as 2035. This could be devastating for Brunei since oil and gas account for a whopping 90% of GDP.

In the coming years, it will be very hard for the people of Brunei to get used to the new style of living. As for today, there is no income tax in Brunei and they also enjoy free housing.

As for the United Arab Amirates, they managed to make their economy more diverse, by making Dubai one of the most popular tourist directions in the world. However, 20% of its GDP still stands on oil production.

In addition, a recent report from the International Energy Agency (IAE) has identified the United Arab Emirates as one of the countries most likely to face severe financial pressure in the coming decades as a result of its reliance on oil and gas.

For Nigeria, natural resources are the biggest and most important ways of income. Yet, many analysts have said that in a few decades, the country will be out if its recourses, resulting in a huge economic crisis.

Solutions

There are several solutions in this situation, but it’s very hard to say which one will work better. By finding other ways to develop their economy, most of these countries can survive the harsh consequences of both climate change and lowering the prices of the resources.

By ForexNewsNow


The Strange War with WHO’s battle Against COVID-19

By Dan Steinbock – In the past few weeks, countries outside China did not send adequate case reports to WHO in time, while media suffered an ‘infodemic.’ Instead of battling COVID-19, WHO and its chief were targeted.

Currently, the greatest virus outbreak concern is to avoid any possible emergence of secondary virus clusters.

Recently, this critical task has been complicated by misguided media coverage and attacks against WHO, China and people of Chinese descent rather than the virus.

Infodemic versus epidemic

Last Saturday, WHO Director-General Tedros Adhanom Ghebreyesus urged global leaders to stop stigma and hate amid the virus outbreak. His comments in Munich followed reports that people of Asian descent have faced discrimination amid virus fears. “We will all learn lessons from this outbreak,” he added, “but now is not the time for reclamations or politicization.”

At the end of January, the World Health Organization (WHO) declared the ongoing virus outbreak a “public health emergency of international concern” (PHEIC). As WHO made clear, the PHEIC was not motivated by China, but the possible effects of the virus, if it would spread to countries with weaker healthcare systems.

At WHO, the concern was compounded when terms, such as “virus outbreak,” “epidemic” and “pandemic,” got blurred even in reputable international media. Tabloid hysteria contributed to ugly instances of xenophobia, even racism against people of Chinese and Asian descent, while leading to bullying in schools, colleges, even universities.

The misinformation on global scale compelled the WHO to declare the COVID-19 an ‘infodemic” on February 2. Since international media seemed to be shunning its responsibility to correct myths and rumors, WHO had to allocate some of its scarce resources to do the job.

Stunningly, it took until mid-February for some of the world’s largest technology companies – including Google, Amazon, and YouTube – to get together, when WHO hosted a Silicon Valley meeting to discuss how to tamp down on misinformation about the virus.

In the concurrent weeks, the struggle against COVID-19 has gone hand in hand with a battle against the WHO and its executives.

WHO and its chief were targeted  

Since late January, almost 380,000 people have signed an online petition to the UN for the WHO chief to resign because he allegedly “solely believes” Chinese outbreak data. In contrast to allegations, WHO chief Dr. Tedros has initiated a review process to study the causes of the virus, while stressing adherence to WHO guidelines regarding pandemics.

The smear campaign is an ugly déjà vu. In 2017, Dr Tedros, a high-level Ethiopian health executive, succeeded Margaret Chan as the chief WHO. While he was considered highly qualified for the job and an innovative reformer in Ethiopia, his candidacy was attacked at the last eve of the WHO election, when odd stories surfaced about an alleged cover-up of cholera epidemics in Ethiopia. Reportedly, the allegations came from Lawrence Gostin, a US law professor who advised the rival UK candidate (and has recently resurfaced as a critic of China’s virus struggle).

In the UN, the African Union dismissed the allegations as an “unfounded and unverified defamation campaign.” Yet, once again, the old smear campaign stories have been recycled in media.

When attacks against Dr. Tedros went nowhere, international spotlight focused on WHO Infections Hazards Director Dr. Sylvia Briand when she stated in early February that “we are not in a pandemic.” Then she became a target for criticism.

To avoid political intrigues, WHO’s pandemic declaration requires strong evidence and relies on a tested six-stage classification.

The last pandemic was the 2009 H1N1 flu outbreak (swine flu), which is estimated to have killed around 150,000 to 300,000 people around the world. In contrast, COVID019 has so far resulted in 4 deaths outside China, despite weeks of diffusion.

Slow to provide reports

In the early 2000s, China’s efforts to control SARS were criticized as the disease spread internationally before the global outbreak was subdued. A decade later, Chinese response to the Avian influenza (H7N9) was significantly faster, broadly praised and the disease did not spread widely. With COVID-19, as Dr Tedros has stated, China should be credited with identifying the virus in “record time,” sharing its genetic sequence quickly, and flagging potential international spread.

Yet, there is a strange discrepancy in the international coverage of the COVID-19. This coverage has systematically focused on China’s alleged conduct, while ignoring the actual conduct of many other influential WHO member states.

This discrepancy prevails even today, despite the news bomb of February 4, when WHO chief Tedros said that it was not China, but countries outside China that had proved slow in sharing complete information about cases.

WHO was particularly concerned about the fact that, even after almost a month of international crisis and global alert, it had received complete case reports for only 38% of the cases.

In other words, a whopping three of five member countries had failed to provide adequate information to WHO in a timely manner. Those reports were vital to the global organization so that it could assess the true international scope of the outbreak, while broadening and deepening containment efforts.

“I don’t think it’s because they lack capacity,” Dr Tedros stated pointedly about these WHO members. It would be ideal, he added, if WHO would receive the most up-to-date information, not just from China but the rest of the world.

It was only after Tedros’s public statement that some member states began to share data with WHO. Meanwhile, precious time had been lost.

Politicization of the outbreak

Even though these lost opportunities could result in potential secondary COVID-19 outbreaks outside China, international media has not yet asked the tough questions about the belated international cooperation outside China.

Instead of focusing on the need for international cooperation, international coverage has produced a series of headlines against the WHO. On February 5, a day after Dr Tedros had urged countries to provide complete case reports, Financial Times reported that the influential WHO emergency committee member and veteran professor John Mackenzie “hit out at Beijing’s ‘reprehensible’ response,” and “accused China of not reporting coronavirus cases fast enough.”

The charge was not publicly supported by other committee members, nor by WHO executives. Moreover, the FT neglected to mention that the highly qualified Mackenzie also serves in Australian government’s Indo-Pacific Centre for Health Security, which plays a role in the U.S.-led Indo-Pacific initiative aiming to contain China’s rise, and is the co-chair of a major NGO, whose key partners include Pentagon’s Defense Threat Reduction Agency (DTRA), which compete “against Chinese influence.”

The tone of international coverage, even in the reputable media, still hasn’t changed. On February 13, Wall Street Journal released a new front-page story, “WHO Criticized for Virus Response,” that broadened the WHO criticism. It relied in part on critical quotes by both Mackenzie and Lawrence Gostin, the China critic who had tried to undermine Tedros’s candidacy at WHO. Free media has a right to critical views, but not to the lack of relevant context. Like other interviewees, both were portrayed as independent, disinterested, neutral observers. Furthermore, all interviewees represented experts from the U.S. or its allies. Not a single major Chinese health expert was interviewed.

Recently, the pattern has been typical to even reputable international dailies. Such purposeful selectivity fosters an impression that legitimate expertise is limited mainly to the critics of WHO.

Throughout the ongoing virus outbreak, Dr Tedros has admirably sought to foster an international battle against COVID-19, while garnering funds against future epidemics. “The virus is a common enemy,” he says. “Let’s not play politics here.”

As the COVID-19 cases could exceed 100,000 in a week or two and global resources should be focused on avoiding secondary outbreak clusters outside China, it is the virus that international cooperation and coverage should attack – not the WHO.

About the Author:

Dr. Dan Steinbock is an internationally recognized strategist of the multipolar world and the founder of Difference Group. He has served at the India, China and America Institute (USA), Shanghai Institutes for International Studies (China) and the EU Center (Singapore). For more, see https://www.differencegroup.net

This is a short version of a commentary that was published by The World Financial Review and The Manila Times on February 17, 2020.