Article By RoboForex.com
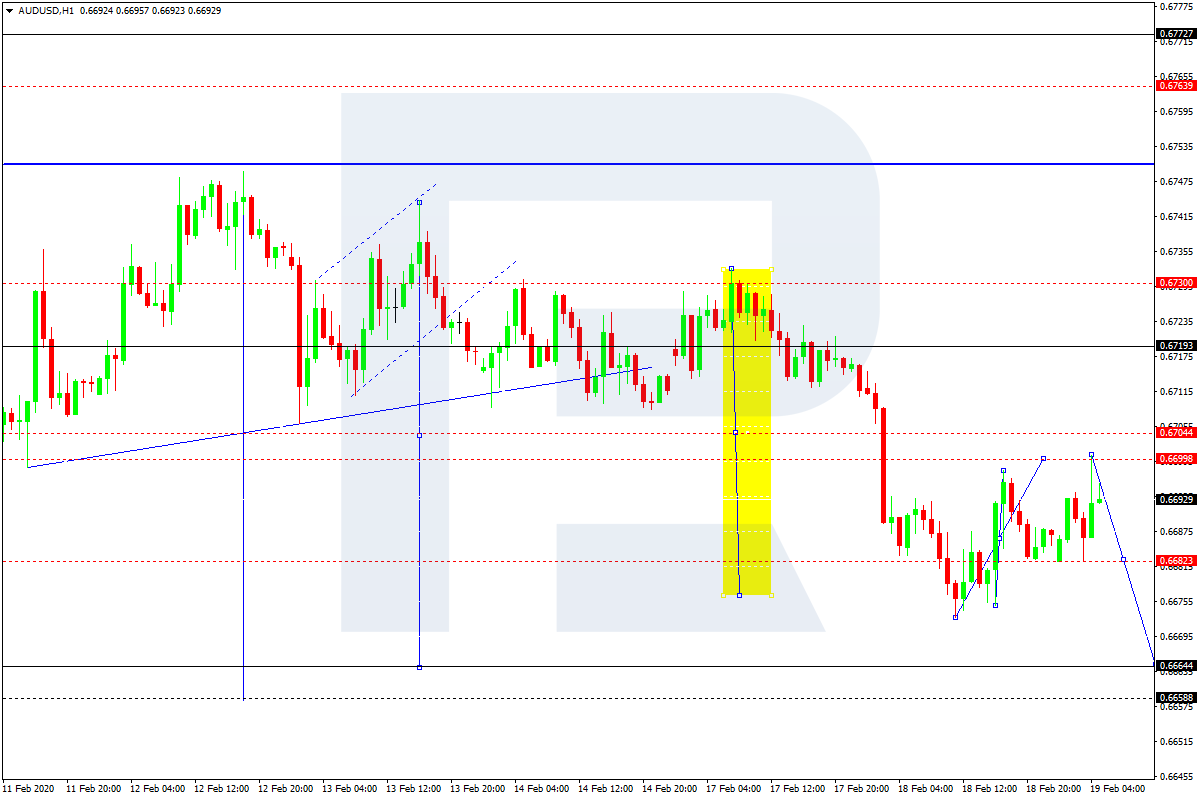
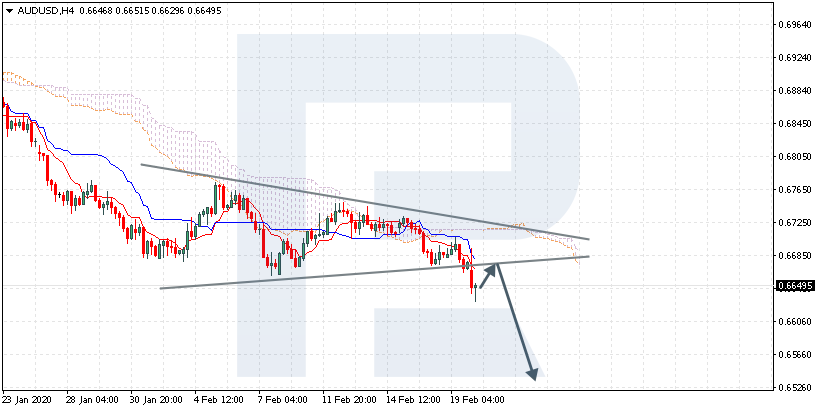
AUDUSD, “Australian Dollar vs US Dollar”
The currency pair is trading at 0.6649 under the Ichimoku Cloud, suggesting a downtrend. A test of the signal lines of the indicator near 0.6675 is expected, followed by a decline to 0.6525. An additional signal confirming the decline will be a bounce off the lower border of the Triangle. The falling will be canceled in the case of a breakout of the upper border of the Cloud and closing above 0.6750, which will mean further growth above 0.6805.

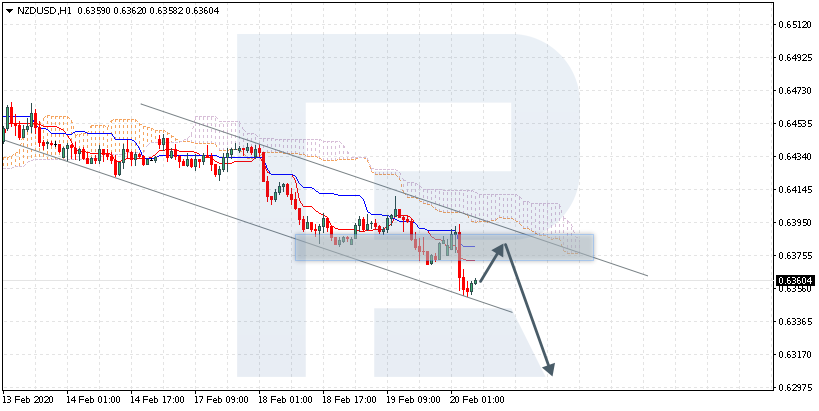
NZDUSD, “New Zealand Dollar vs US Dollar”
The currency pair is trading at 0.6360 under the Ichimoku Cloud, suggesting a downtrend. A test of the signal lines of the indicator near 0.6375 is expected, followed by a decline to 0.6295. An additional signal confirming the decline will be a bounce off the upper border of the descending channel. The falling will be canceled in the case of a breakout of the upper border of the Cloud and closing above 0.6435, which will mean further growth above 0.6505.
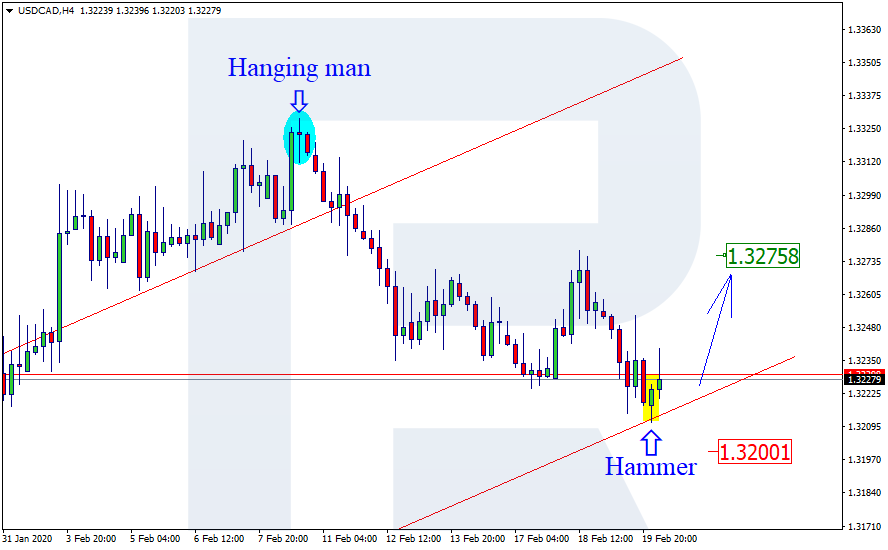
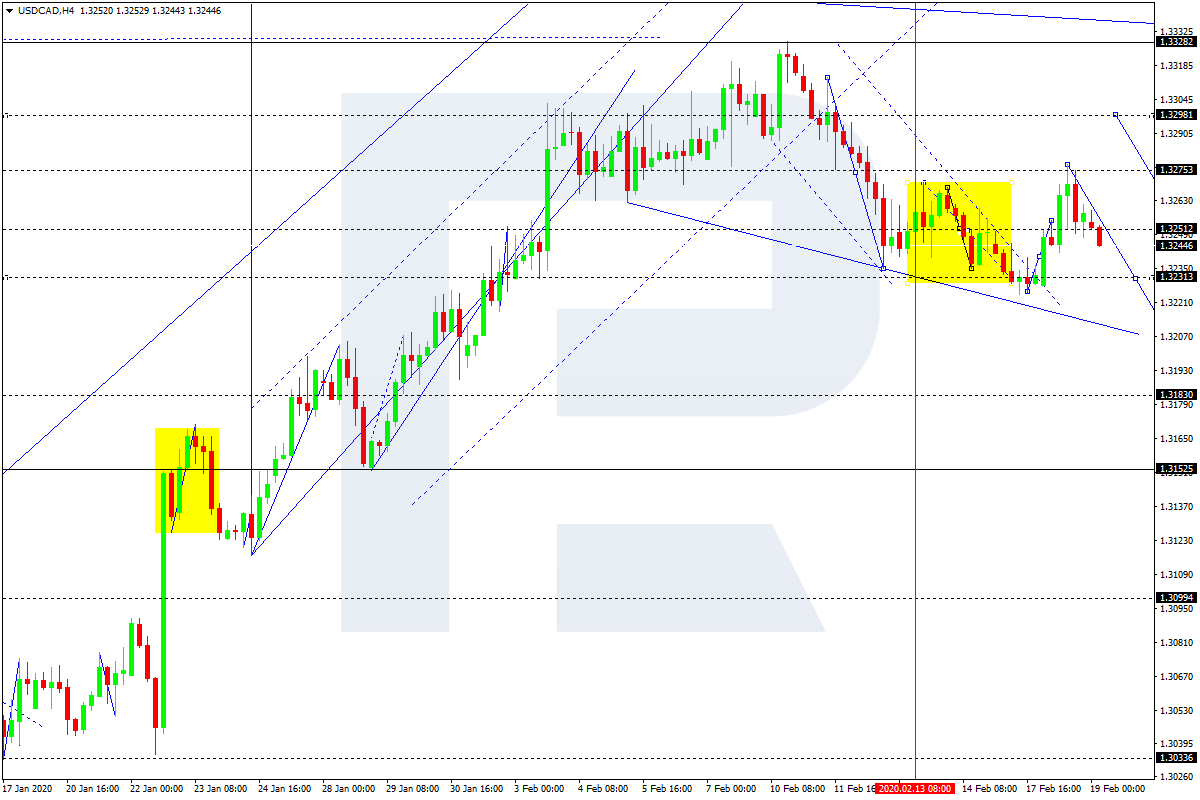
USDCAD, “US Dollar vs Canadian Dollar”
The currency pair is trading at 1.3228 under the Ichimoku Cloud, suggesting a downtrend. A test of the lower border of the Cloud near 1.3255 is expected, followed by a decline to 1.3145. An additional signal confirming the decline will be a bounce off the upper border of the descending channel. The falling will be canceled in the case of a breakout of the upper border of the Cloud and closing above 1.3305.

Article By RoboForex.com
Attention!
Forecasts presented in this section only reflect the author’s private opinion and should not be considered as guidance for trading. RoboForex LP bears no responsibility for trading results based on trading recommendations described in these analytical reviews.