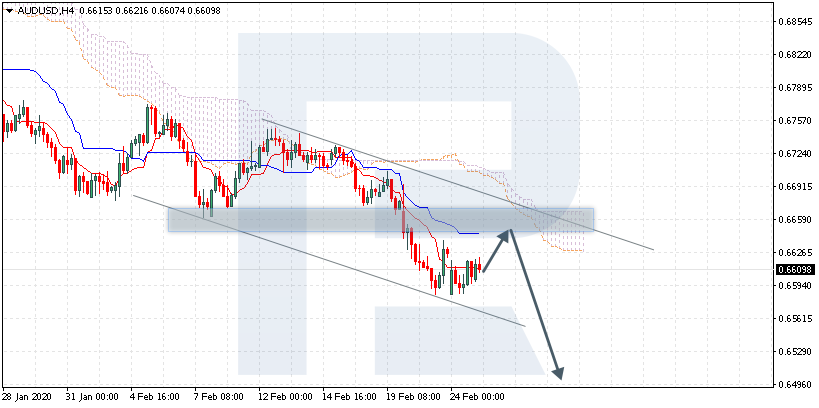
AUDUSD is trading at 0.6609; the instrument is moving below Ichimoku Cloud, thus indicating a descending tendency. The markets could indicate that the price may test Tenkan-Sen and Kijun-Sen at 0.6635 and then resume moving downwards to reach 0.6495. Another signal to confirm further descending movement is the price’s rebounding from the resistance level. However, the scenario that implies further decline may be canceled if the price breaks the cloud’s upside border and fixes above 0.6725. In this case, the pair may continue growing towards 0.6805.
NZDUSD, “New Zealand Dollar vs US Dollar”
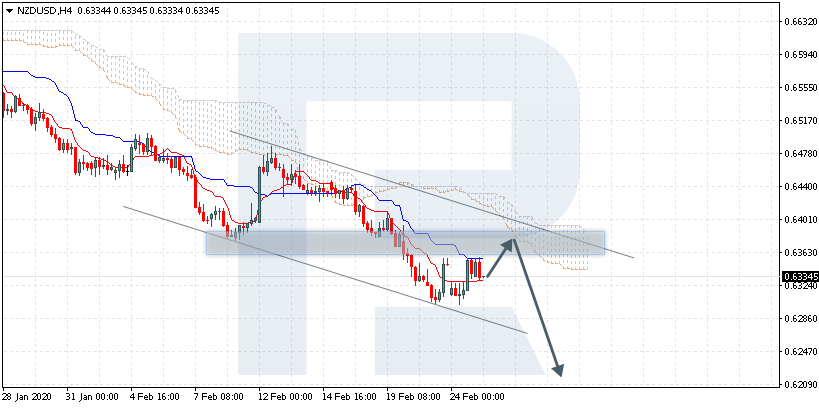
NZDUSD is trading at 0.6334; the instrument is moving below Ichimoku Cloud, thus indicating a descending tendency. The markets could indicate that the price may test the cloud’s downside border at 0.6365 and then resume moving downwards to reach 0.6205. Another signal to confirm further descending movement is the price’s rebounding from the descending channel’s upside border. However, the scenario that implies further decline may be canceled if the price breaks the cloud’s upside border and fixes above 0.6435. In this case, the pair may continue growing towards 0.6525.
USDCAD, “US Dollar vs Canadian Dollar”
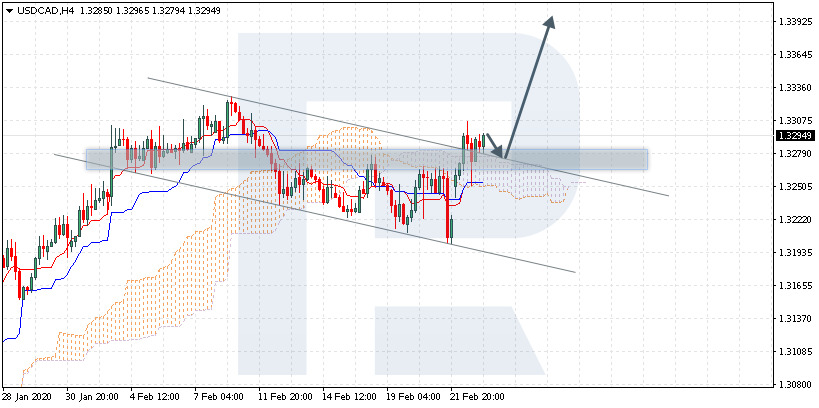
USDCAD is trading at 1.3294; the instrument is moving above Ichimoku Cloud, thus indicating an ascending tendency. The markets could indicate that the price may test the cloud’s upside border at 1.3275 and then resume moving upwards to reach 1.3395. Another signal to confirm further ascending movement is the price’s rebounding from the descending channel’s upside border. However, the scenario that implies further growth may be canceled if the price breaks the cloud’s downside border and fixes below 1.3215. In this case, the pair may continue falling towards 1.3125.
Attention! Forecasts presented in this section only reflect the author’s private opinion and should not be considered as guidance for trading. RoboForex LP bears no responsibility for trading results based on trading recommendations described in these analytical reviews.
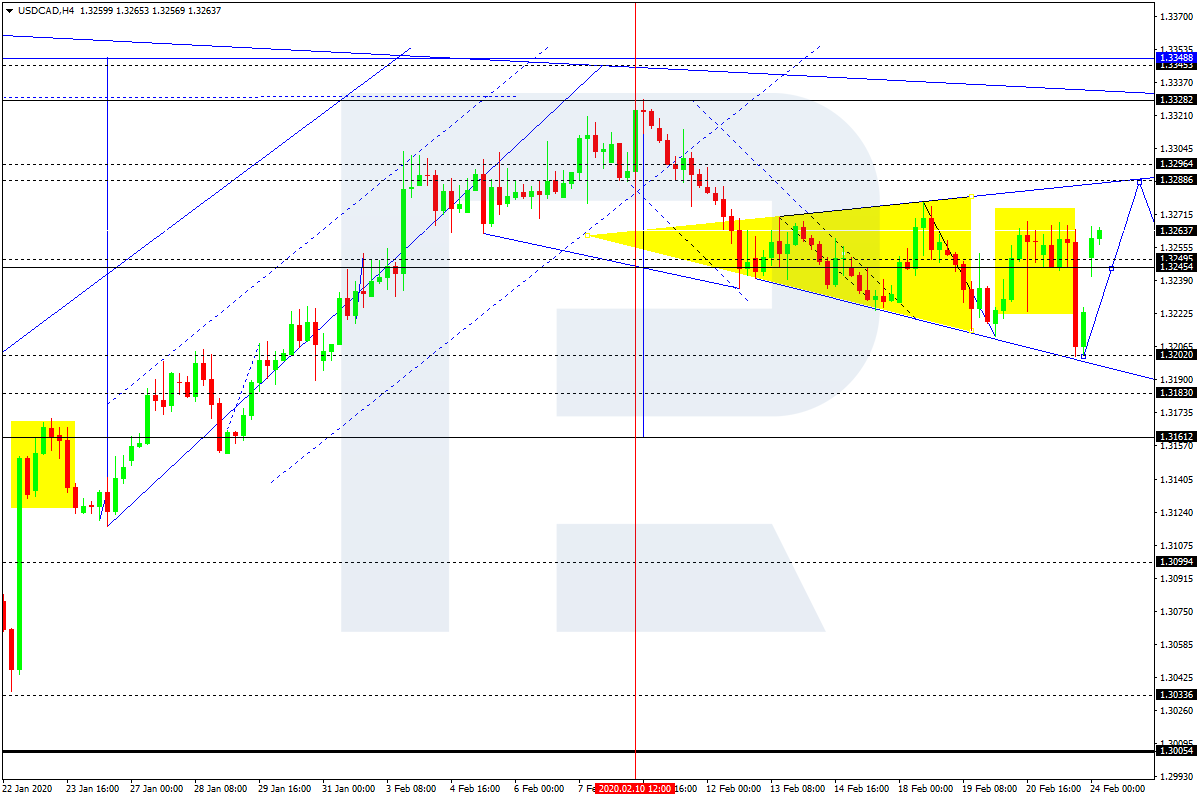
As we can see in the H4 chart, the pair is moving inside the rising channel again. By now, USDCAD has completed a Harami pattern near the support level. The current situation implies that USDCAD may reverse and resume growing towards 1.3333. At the same time, one shouldn’t exclude an opposite scenario, according to which the instrument may start a new decline to return to 1.3222.
AUDUSD, “Australian Dollar vs US Dollar”
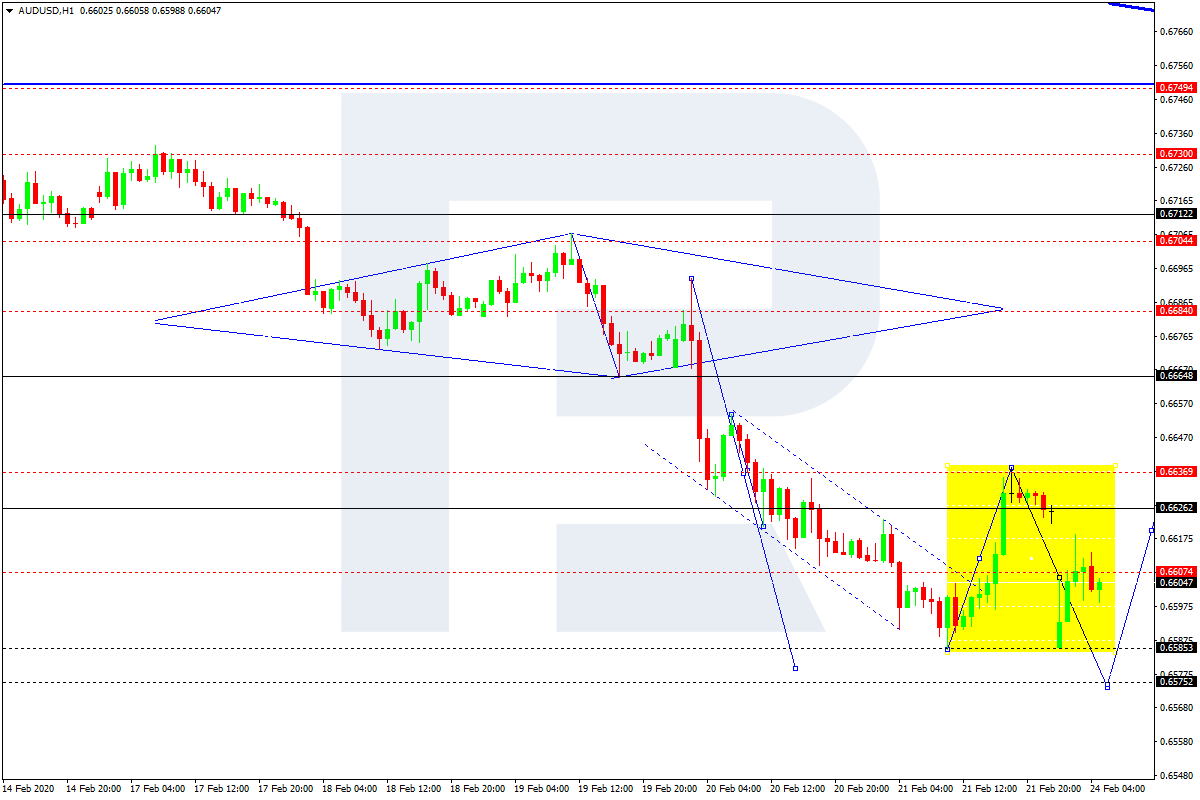
As we can see in the H4 chart, the pair continues the descending tendency; after completing a Hammer, the price is rebounding from the horizontal support level. Right now, there are two possible scenarios. The first one implies that AUDUSD may test 0.6668. The other scenario suggests that the instrument may form a slight correction and then resume falling with the target at 0.6545. the current situation implies that the second scenario is more probable for the next several trading sessions.
USDCHF, “US Dollar vs Swiss Franc”
As we can see in the H4 chart, after finishing the pullback within the ascending tendency, USDCHF has formed a Harami reversal pattern. The current situation suggests that the pair may reverse and reach the channel’s upside border to continue the ascending tendency with the target at 0.9870. However, one shouldn’t ignore another scenario, according to which the instrument may continue falling towards 0.9766.
Attention! Forecasts presented in this section only reflect the author’s private opinion and should not be considered as guidance for trading. RoboForex LP bears no responsibility for trading results based on trading recommendations described in these analytical reviews.
The US dollar is stable against currency majors. The dollar index (#DX) closed yesterday with a slight increase (+0.10%). The Chinese virus is still in the focus of attention. The spread of Covid-19 outside of China is of great concern to investors. Analysts believe that coronavirus will affect the economy of most countries, and the Fed may cut interest rates. Demand for the “safe haven” currencies has resumed again.
Countries around the world are stepping up efforts to prevent a pandemic, while the number of infected has exceeded 80,000. In South Korea, an outbreak of coronavirus was recorded among members of the religious movement, so the authorities intend to check 200 thousand members of this movement. The US promised to allocate $2.5 billion to fight the disease due to the rapid spread of the virus outside of China. The European Commission, in turn, allocates 232 million euros to counteract the spread of coronavirus, as well as calls on the international community to cooperate.
The “black gold” prices are consolidating after a significant fall the day before. Currently, futures for the WTI crude oil are testing the $51.25 mark per barrel.
Market indicators
Yesterday, there were aggressive sales in the US stock market: #SPY (-3.32%), #DIA (-3.51%), #QQQ (-3.86%).
The 10-year US government bonds yield declined. At the moment, the indicator is at the level of 1.35-1.36%.
The Economic News Feed for 25.02.2020:
– CB consumer confidence index in the US at 17:00 (GMT+2:00).
During yesterday’s trading, the single currency continued to recover against the greenback. EUR/USD quotes updated local highs. The euro was supported by optimistic data from Germany. At the moment the trading instrument is consolidating. The key support and resistance levels are 1.08300 and 1.08700, respectively. The EUR/USD currency pair has a potential for further correction. We expect economic reports from the USA. We recommend opening positions from key levels.
The Economic News Feed for 25.02.2020:
– in the fourth quarter, German GDP growth met market expectations and amounted to 0.3% (YoY);
– the US consumer confidence index will be published at 17:00 (GMT+2:00).
The indicators signal the strength of buyers: the price has fixed above 50 MA and 100 MA.
The MACD histogram is in the positive zone, but below the signal line, which gives a weak signal to buy EUR/USD.
The Stochastic Oscillator is in the neutral zone, the %K line is below the %D line, which indicates a bearish mood.
Trading recommendations
Support levels: 1.08300, 1.08000, 1.07800
Resistance levels: 1.08700, 1.09000, 1.09250
If the price fixes above 1.08700, expect the quotes to move toward 1.09000-1.09250.
Alternatively, the quotes could descend toward 1.08000-1.07800.
The GBP/USD currency pair
Technical indicators of the currency pair:
Prev Open: 1.29448
Open: 1.29301
% chg. over the last day: +0.09
Day’s range: 1.29142 – 1.29419
52 wk range: 1.1959 – 1.3516
The technical picture on the GBP/USD currency pair is ambiguous. The trading instrument is in sideways movement. Unidirectional trend is not observed. At the moment local support and resistance levels are at 1.29000 and 1.29450, respectively. Sterling has a potential for recovery. It is recommended to open positions from key levels.
The publication of important economic releases from the UK is not planned.
Indicators do not give an accurate signal: 50 MA crossed 100 MA.
MACD histogram is near the 0 mark.
The Stochastic Oscillator is located near the overbought zone, the %K line has crossed the %D line. No signals at the moment.
Trading recommendations
Support levels: 1.29000, 1.28500
Resistance levels: 1.29450, 1.29800, 1.30150
If the price fixes above the resistance level at 1.29450, expect the quotes to rise to 1.29800-1.30000.
Alternatively, the quotees could descend toward 1.28700-1.28400.
The USD/CAD currency pair
Technical indicators of the currency pair:
Prev Open: 1.32508
Open: 1.32925
% chg. over the last day: -0.21
Day’s range: 1.32801 – 1.32987
52 wk range: 1.2949 – 1.3566
Buying prevails on the USD/CAD currency pair. The trading instrument has updated local highs again. The CAD is under pressure from a significant drop in oil quotes. At the moment USD/CAD quotes are consolidating. The key support and resistance levels are 1.32700 и 1.33050. The Canadian dollar has a potential for further decline against the greenback. Today, we recommend to pay attention to the US economic reports. Positions should be opened from key levels.
The Economic News Feed for 25.02.2020 is calm.
The indicators signal the strength of buyers: the price has fixed above 50 MA and 100 MA.
The MACD histogram is in the positive zone, but below the signal line, which gives a weak signal to buy USD/CAD.
The Stochastic Oscillator is in the neutral zone, the %K line has crossed the %D line. There are no signals at the moment.
Trading recommendations
Support levels: 1.32700, 1.32450, 1.32250
Resistance levels: 1.33050, 1.33400
If the price fixes above 1.33050, expect further growth toward 1.33400-1.33600.
Alternatively, the quotes could descend toward 1.32500-1.32300.
The USD/JPY currency pair
Technical indicators of the currency pair:
Prev Open: 111.342
Open: 110.681
% chg. over the last day: -0.63
Day’s range: 110.627 – 111.043
52 wk range: 104.45 – 113.53
At USD/JPY currency pair aggressive sales are observed. Yesterday the drop in quotations exceeded 70 points. The trading instrument has set new local lows. At the moment the safe haven currency is consolidating in the range of 110.650-111.100. USD/JPY quotes have potential for further correction. We recommend you to monitor the current information about the epidemic in China. Positions should be opened from key levels.
The Economic News Feed for 25.02.2020 is calm.
The indicators signal the sellers’ strength: the price has fixed below 100 MA.
Histogram of MACD is in the negative zone, which indicates a bearish mood.
The Stochastic Oscillator is in the neutral zone, the %K line is below the %D line, which also gives a sell signal for USD/JPY.
Trading recommendations
Support levels: 110.650, 110.300, 110.100
Resistance levels: 111.100, 111.600, 112.200.
If the price fixes below 110.650, further correction of USD/JPY quotes is expected. Potential movement towards 110.300-110.000.
Alternative is the growth of USD/JPY currency pair to 111.500-111.700.
On Monday, February 24, trading on the euro was up by 0.05% at the close. During US trading, bulls clawed back their morning losses suffered as a result of the news out of Italy regarding the coronavirus. A new wave of concern among investors was caused by a sharp increase in the number of new coronavirus cases recorded in northern Italy.
Today, the number of cases in Italy stands at 229 people. (an increase of 72 compared to Monday), seven people died. According to the latest data, the total number of cases exceeded 80,000. So far, 2,699 people have died from the virus, while more than 27,000 have been cured.
The spread of the coronavirus epidemic outside of China contributed to the closure of risk positions, as a result of which the yen and gold received support. The gold exchange rate has grown rapidly and reached set a new high of $1,689 USD per troy ounce (highest since 2013). The price of oil was down 4.5% to $55.71 USD. The VIX Fear Index set a fresh six-month high (26.35).
At the American session, the euro received support, which resulted from the weakness of the US dollar amid expectations of a softening of the US Federal Reserve monetary policy. According to the forecast, the probability of a rate cut in July is 79.9%. The pair subsequently recovered to 1.0872.
17:00 USA: S&P/Case-Shiller Home Price Indices (YoY) (Dec).
17:45 USA: Fed’s Kaplan speech.
18:00 USA: Consumer Confidence, Richmond Fed Manufacturing Index (Feb).
23:00 USA: Fed’s Clarida speech.
Current situation:
At the time of writing, the euro is worth 1.0849. An upwards channel has formed on the hourly TF. The price is fluctuating around the 45th degree. The euro is trying to gain ground, based on growing hopes regarding potential stimulation of the economy by the US Federal Reserve System (FRS), but remains vulnerable to the coronavirus.
From a technical point of view, the EURUSD recovery looks like a normal correction. Growth is unstable, as is the price model itself, and therefore, according to the forecast, we must consider a fall down to 1.0816. The balance line (SMA55) will provide intermediate support at around the 1.0835-mark. If by some miracle the level of 1.0835 remains and the price returns to 1.0882, then after the bounce-back it is worth considering a savage correction up to 1.0947.
By Dan Steinbock – In addition to the Chinese mainland, the struggle against the new cases and outbreak clusters of the COVID-19 is shifting to countries outside China – not just Asia, but Europe, North America, the Middle East and Africa.
In China, the number of confirmed coronavirus cases is about to exceed 80,000, but the momentum of new outbreaks is now shifting to countries outside China, where the number of confirmed cases soared to almost 1,800 with 17 deaths.
This is only a prelude to what’s yet to come, however.
New virus risks outside China
While these numbers will continue to climb, the low starting-point suggests China’s draconian measures may have saved many lives within and outside China. The same cannot be said about preemption measures outside China’s borders.
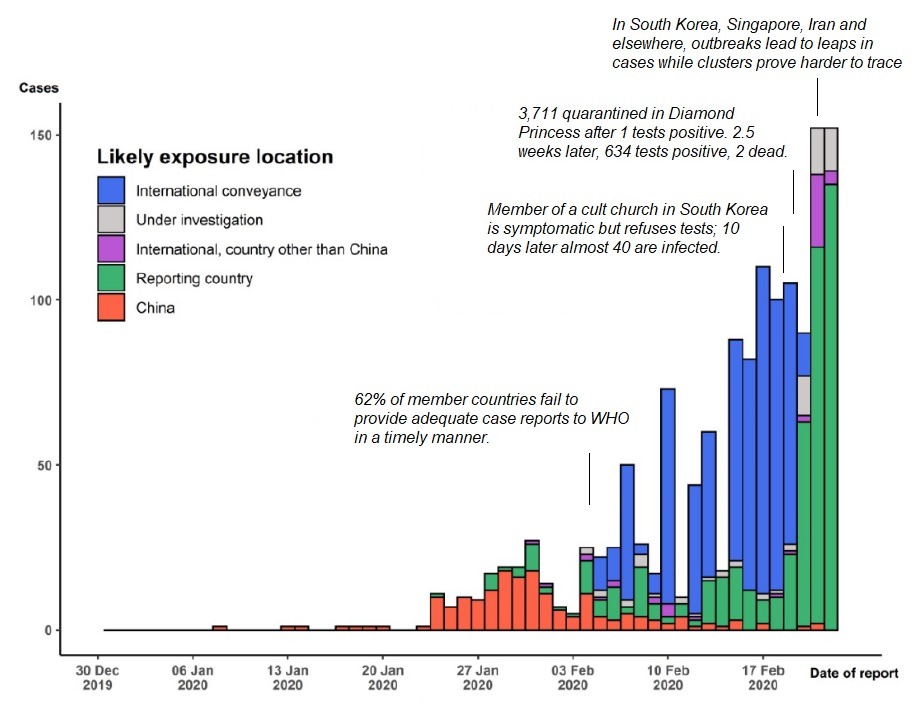
Risk of international complacency (WHO member states). On February 4, the WHO’s chief Dr. Tedros said that, after almost a month of international crisis and global alert, three of five WHO member countries outside China had failed to provide adequate information in a timely manner. As the timeline suggests, the number of cases outside China soared after February 4 and the missed opportunities of greater international cooperation (Figure).
FigureCOVID-19 international risks have soared since early February
Source: WHO; DifferenceGroup.
Risk of botched quarantines (Diamond Princess Cruise). On February 3, more than 3,700 passengers and crew were quarantined by the Japanese Ministry of Health after one passenger on the ship tested positive for COVID-19. Just two and half weeks later, some 635 passengers tested positive for the virus, while two passengers had died after contracting the virus.
Risk of “super-spreaders” (South Korean cult church). From the start, potential super-spreaders who could endanger others have been a great concern. On February 10, a 61-year old woman, who worships at the Daegu cult church, developed fever but twice refused to be tested for the virus claiming she had not recently travelled abroad. After she had attended at least four services before the diagnosis, 40 other members of the church were infected.
Risks of potential evacuation failures (State Department vs CDC). As countries seek to rescue citizens from infected territories, failed evacuations can pose new risks. Last week, the US Centers for Disease Control urged to keep 14 infected US citizens in Japan, yet the State Department put the infected on a plane with healthy people claiming that a plastic-aligned enclosure would mitigate infection risks.
Risks of poorly-monitored self-quarantines (several countries). On February 21, California health officials said that 7,600 people who had returned to the state after visiting China during the virus outbreak had been asked to quarantine themselves at home this month. Laxness in self-quarantine could endanger far more lives. However, the CDC is not tracking how many people from each US state who have returned from China have been asked to isolate themselves. Further, local health departments have discretion in how to carry out the quarantines.
Unknown risks
In addition to the threats that we know, there are potential, more challenging risks which we understood poorly or don’t even know about.
Risks of untraceable virus clusters (several countries). In South Korea, Singapore and Iran, virus clusters have led to rapid leaps in cases. As it is becoming harder to trace where the clusters started, the virus may be spreading too broadly for traditional public-health steps to contain it. That highlights the importance of Chinese standard-setting measures that several countries are now emulating in part or fully.
Risk of real incubation period (faster, longer than presumed). Initially, clinical evidence suggested that the incubation period was 2-14 days, which then became the standard for quarantine measures. In the past weeks, Chinese authorities have extended these periods because new evidence suggests that, with possible outliers, the incubation period could be 0-27 days.
Risks of weaker healthcare systems (poorer developing countries). In late January, the WHO declared the ongoing virus outbreak a “public health emergency of international concern” (PHEIC). The goal was to boost international coordination against the expected internationalization of the outbreaks. As WHO officials have repeatedly noted, the PHEIC was motivated by the possible effects of the virus, if it would spread to countries with weaker healthcare systems.
In addition to proximate Asia, virus clusters have emerged in emerging Asia, big European economies, North America, Middle East, and Russia. Even though Italy has been the only European country to have barred flights to and from China, Hong Kong, Macau and Taiwan, it has seen a dramatic increase of cases, centered in the regional towns of Lombardi, near Milan – the country’s business hub.
The world’s most vulnerable
The big question is how forcefully the virus will arrive in the rest of Americas and particularly Africa.
Risks of local transmission. On Feb 21, when the virus had spread to 25 countries, local cycles of transmission had already occurred in 12 countries after case importation. In Africa, Egypt has so far confirmed one case. As such cases are expected to proliferate, the probability of such risks will climb accordingly.
In modeling simulations based on air travel, new research indicates that the highest importation risk involves a set of countries – including Egypt, Algeria, and South Africa – that have moderate to high capacity to respond to outbreaks. In turn, countries at moderate risk – including Nigeria, Ethiopia, Sudan, Angola, Tanzania, Ghana, and Kenya – have variable capacity and high vulnerability.
Several African countries are already struggling to contain another Ebola virus outbreak, while others are fighting the worst locust in decades. Having already decimated crops throughout Ethiopia, Kenya and Somalia, Eritrea and Djibouti, locust swarms threaten South Sudan, Uganda and Tanzania, while breeding along the both sides of the Red Sea in Egypt, Sudan, Eritrea and Saudi Arabia.
Old risks could resurface along with the new
As new risks are evolving, old risks are not yet fully contained and can still pose lingering threats in China and particularly in countries outside China.
Risk of “closed spaces” (prison systems, nursing homes). On February 21, Chinese prisons reported some 500 new cases of infections among inmates and guards. It was followed by news of infections in nursing homes. Both cases highlight the high transmissibility of the virus in spaces of confinement.
Risks of new potential mutations and infection scenarios. The plausible current assumption is that, like seasonal influenza, the COVID-19 is causing mild and self-limiting disease in most people who are infected, with severe disease more likely among older people or those with comorbidities (e.g., diabetes, pulmonary disease).
But if the scenario changes towards wider community transmission with multiple international foci (or toward new kind of mutations), current mitigation procedures will prove inadequate and countries will be more likely to emulate Chinese measures.
About the Author:
Dr. Dan Steinbock is an internationally recognized strategist of the multipolar world and the founder of Difference Group. He has served at the India, China and America Institute (USA), Shanghai Institutes for International Studies (China) and the EU Center (Singapore). For more, see https://www.differencegroup.net
Based on Dr. Steinbock’s briefing of Feb 23, 2020, on COVID-19 human and economic impact.
By TheTechnicalTraders – Over the past 5+ days, a very clear change in market direction has taken place in the US and global markets. Prior to this, the US markets were reacting to Q4 earnings data and minimizing the potential global pandemic of the Coronavirus. The continued “rally to the peak” process was taking place and was very impressive from a purely euphoric trader standpoint. Our researchers found it amazing that the markets continued to rally many weeks after the news of economic contraction and quarantines setup in China/Asia.
Make sure to opt-in to our free market trend signals newsletter before you continue reading this or you may miss our next special report!
We believe a number of critical factors may have pushed global investors away from their comfortable, happy, bullish attitude over the past 5+ days – most importantly the reality that the virus pandemic was very real and would continue to result in a more severe global economic contraction process and the outcome of the Caucus voting where Bernie Sanders appears to be leading almost every early voting event. There are now two major concerns hanging over the global markets and the future of the US 2020 Presidential elections. These two major issues may be enough to change investor sentiment and present a very real volatility event.
Uncertainty breeds fear and can cause traders to move away from risk. We discussed these topics in research posts many months ago.
Our researchers believe the underlying concerns that are becoming more evident to global traders are the very real facts that the global economy may continue to contract because of the spreading Corona Virus and risks of a global pandemic event and the fact that the US 2020 Presidential election process appears to be setting up to become a real battle between Donald Trump and Bernie Sanders. Our researchers believe the combination of these two unknowns is creating an environment where global traders are fearful of the future growth opportunities within the US and global markets.
Bernie Sanders has been dominating the Caucus events in the US as a Socialist/Progressive candidate. For many Americans, this is a frightening concept. Even early into the Caucus voting cycle, it appears Mr. Sanders has taken a very clear leadership role headed into the 2020 Presidential election event. Business and global investors are not going to like the concept of a Socialist/Progressive US Presidential candidate. This is going to cause investors and business owners to avoid engaging in projects and opportunities until after the November 2020 elections.
Add into this fear contagion the fact that the Coronavirus event may continue to add to the global fear component of the US and global economy. How much more risk is involved because of the spread of this virus over the next 12+ months and how will this concern complicate the concerns related to the US Presidential electing event?
Daily Dow Jones Industrial Chart
This Daily Dow Jones Industrial chart highlights the huge Gap lower that took place early on Monday, February 24, 2020. This huge move resulted from an extended fear of a growing potential for a global pandemic event and a renewed fear that global economic activity may be greatly reduced over the next 12+ months. We believe the extended fear of a potential Socialist/Progressive Democrat candidate may be adding to this massive decline in the global markets.
Transportation Index Daily Chart
The Transportation Index is an excellent measure of future economic activity expectations and investors belief that the global economy will recover from this potential contagion event. On Monday, February 24, 2020, the Transportation Index collapsed below 10,600 on a Gap Down move as the markets collapsed. This is a real sign that global investors suddenly believe the global markets will contract over the next 3 to 6+ months and are moving away from risky instruments in the US and global markets.
Weekly Transportation Index
This Weekly Transportation index chart illustrates just how far the TRAN could move while still saying within the range of price activity from 2018 to 2019. The TRAN could fall all the way to levels near 8,800 before reaching the lows of December 2018. Thus, from current levels near 10,500, we could see a continued price decline in the global markets of at least 15% to 20% before we near the 2018 lows.
As our research team has been predicting, it appears a Waterfall event is beginning to take place. This Gapping downside move may become the catalyst top in the global markets that presents a broader market rotation/decline. As we’ve been warning, be prepared for broad sector market rotation and for precious metals to skyrocket as greater fear sets up in the global markets. We hope you were paying attention to our research over the past 5+ months. We’ve been all over this setup and have issued multiple warnings for all our friends and followers.
As a technical analysis and trader since 1997, I have been through a few bull/bear market cycles. I believe I have a good pulse on the market and timing key turning points for both short-term swing trading and long-term investment capital. The opportunities are massive/life-changing if handled properly.
I urge you visit my ETF Wealth Building Newsletter and if you like what I offer, join me with the 1-year subscription to lock in the lowest rate possible and ride my coattails as I navigate these financial market and build wealth while others lose nearly everything they own during the next financial crisis. Join Now and Get a Free 1oz Silver Bar!
As we can see in the daily chart, XAUUSD is totally dominated by bulls. After finishing the correction, the pair has broken its previous high and right now is trading to reach 76.0% fibo at 1708.10. At the same time, there is a divergence on MACD, which may indicate a possible pullback after the instrument reaches the target. The support is 50.0% at 1482.50.
In the H4 chart, the pair has broken the post-correctional extension area between 138.2% and 161.8% fibo and right now is moving towards 76.0% fibo at 1708.10.
USDCHF, “US Dollar vs Swiss Franc”
As we can see in the H4 chart, the divergence on MACD made the pair reverse after reaching 50.0% and start a new descending movement, which has already tested the support at 38.2% fibo (0.9769). If the price breaks this level and fixes below it, the instrument may continue falling to reach the low at 0.9613.
The H1 chart shows more detailed structure of the current downtrend. The pair has already reached 23.6% fibo and may continue falling towards 38.2% and 50.0% fibo at 0.9764 and 0.9738 respectively. The resistance is local high at 0.9848.
Attention! Forecasts presented in this section only reflect the author’s private opinion and should not be considered as guidance for trading. RoboForex LP bears no responsibility for trading results based on trading recommendations described in these analytical reviews.
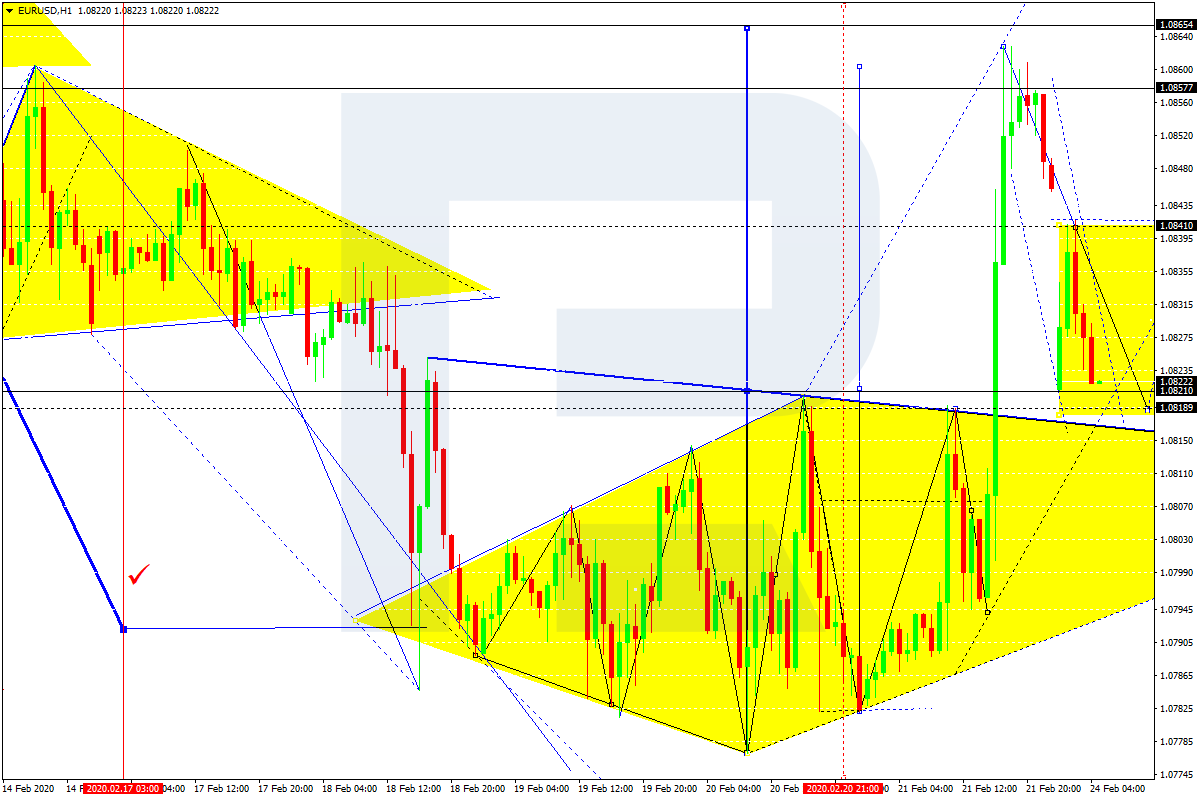
After breaking the consolidation range upwards and reaching the short-term target at 1.0857, EURUSD is moving downwards. Possibly, today the pair may test 1.0818 from above and then form one more ascending structure to reach 1.0865. After that, the instrument may start a new correction to return to 1.0818.
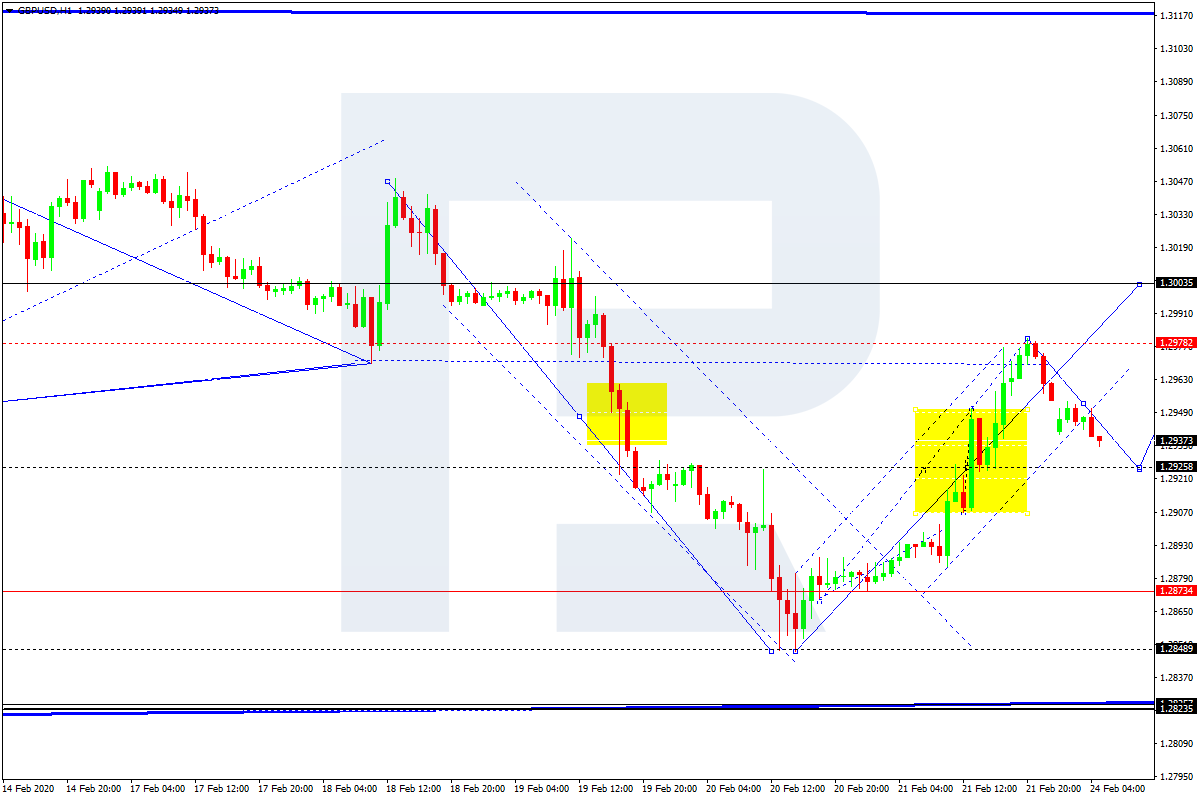
GBPUSD, “Great Britain Pound vs US Dollar”
GBPUSD has reached the short-term upside target at 1.2978; right now, it is falling towards 1.2925. Later, the market may start a new growth to reach 1.3003.
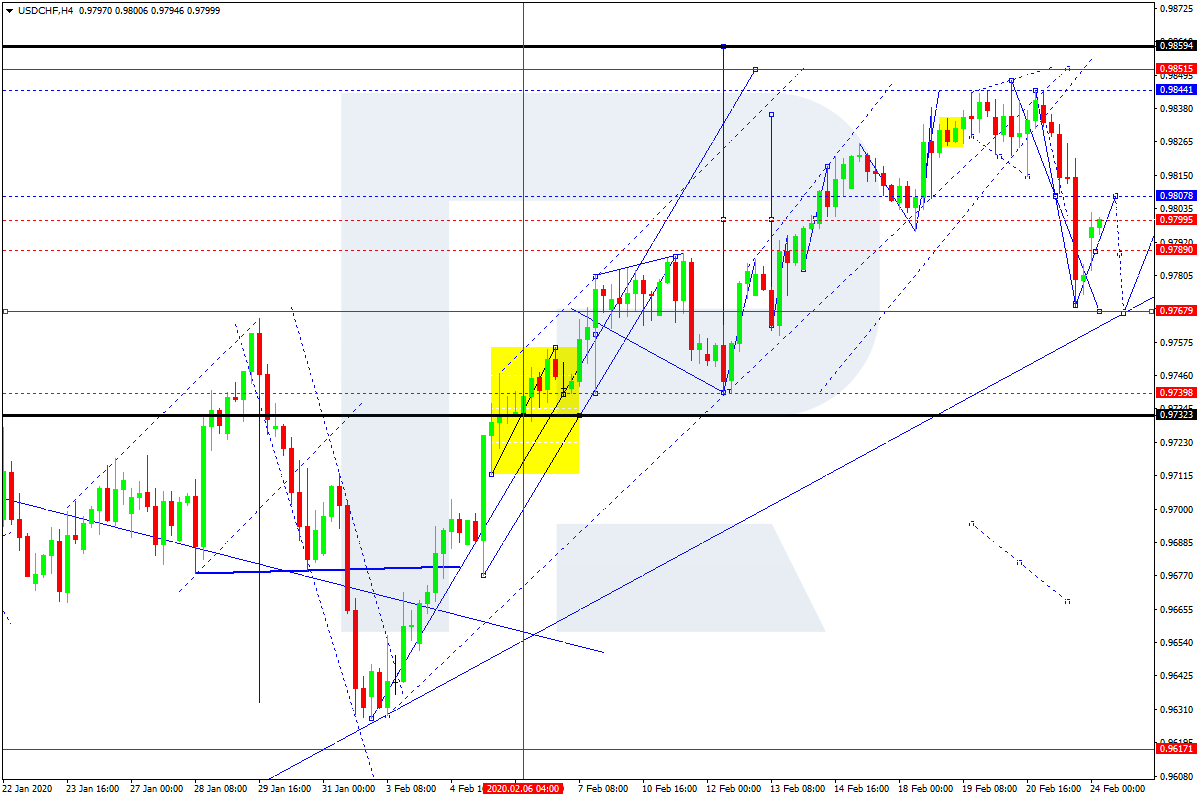
USDCHF, “US Dollar vs Swiss Franc”
After finishing the descending wave at 0.9777, USDCHF has completed one more ascending structure towards 0.9808. The main scenario implies that the pair may fall to reach 0.9766 and then grow with the target at 0.9851.
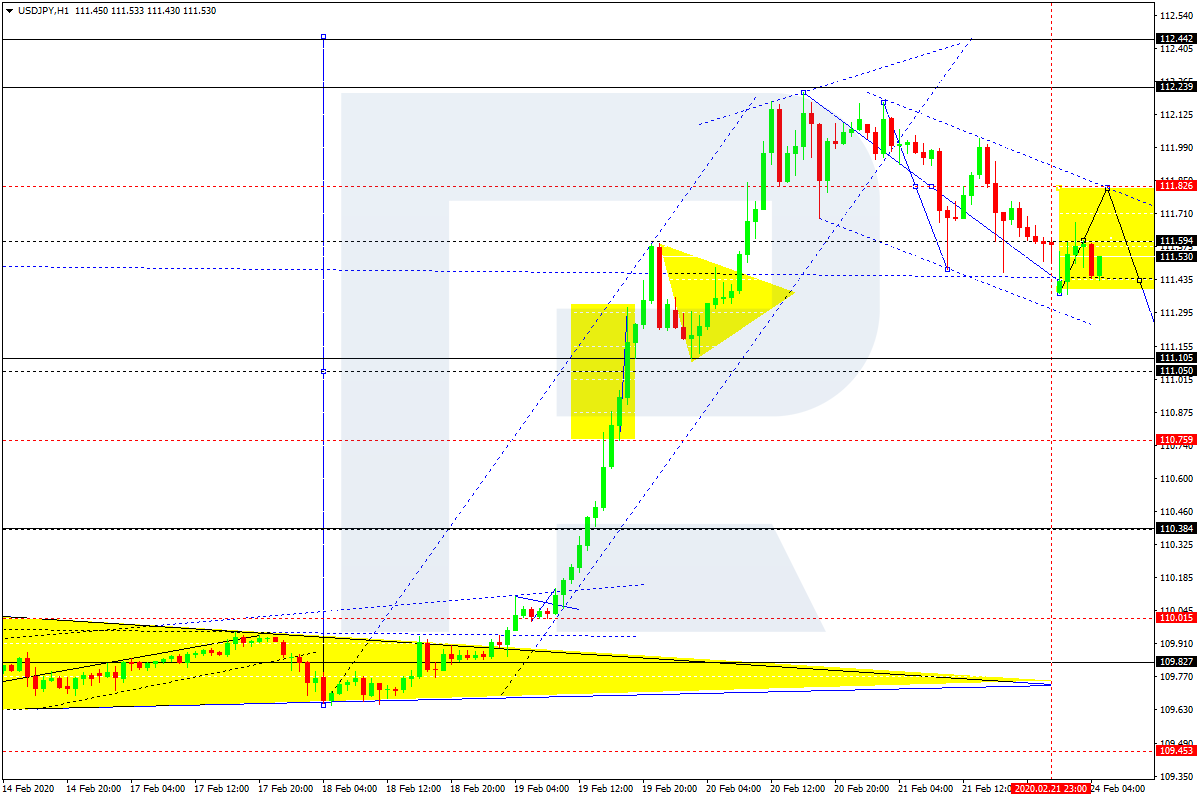
USDJPY, “US Dollar vs Japanese Yen”
USDJPY has completed the descending wave towards 111.40. Today, the pair may correct towards 111.82 and then start another decline with the target at 111.11.
AUDUSD, “Australian Dollar vs US Dollar”
AUDUSD has completed the correction at 0.6638; right now, it is falling towards 0.6575. Possibly, today the pair may reach this level and then start another continue the correction with the target at 0.6660.
USDRUB, “US Dollar vs Russian Ruble”
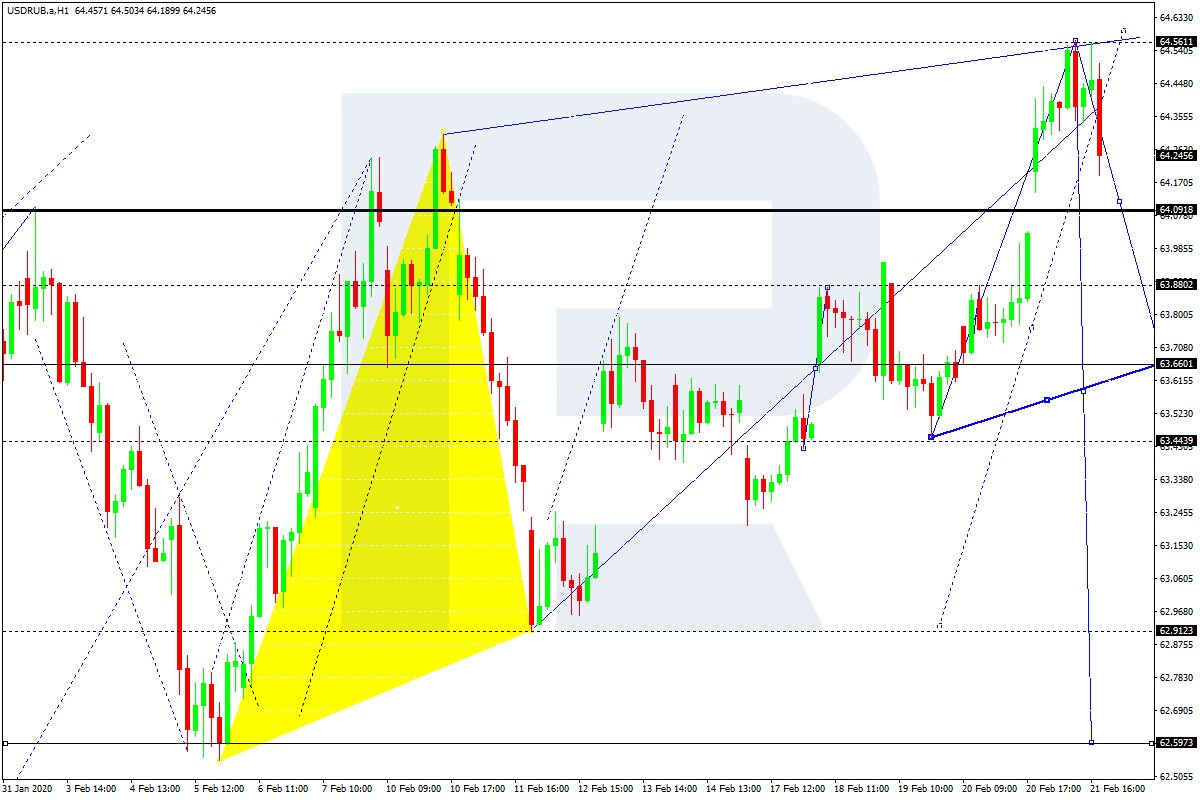
USDRUB is moving downwards to reach 64.10. After that, the instrument may grow towards 64.40, thus forming a new consolidation range between these two levels. Later, the market may expand the range up to 64.50 and then resume trading inside the downtrend with the first target at 63.60.
USDCAD, “US Dollar vs Canadian Dollar”
USDCAD is still consolidating around 1.3245. Possibly, today the pair may grow towards 1.3288 and then form a new descending structure to reach 1.3162.
XAUUSD, “Gold vs US Dollar”
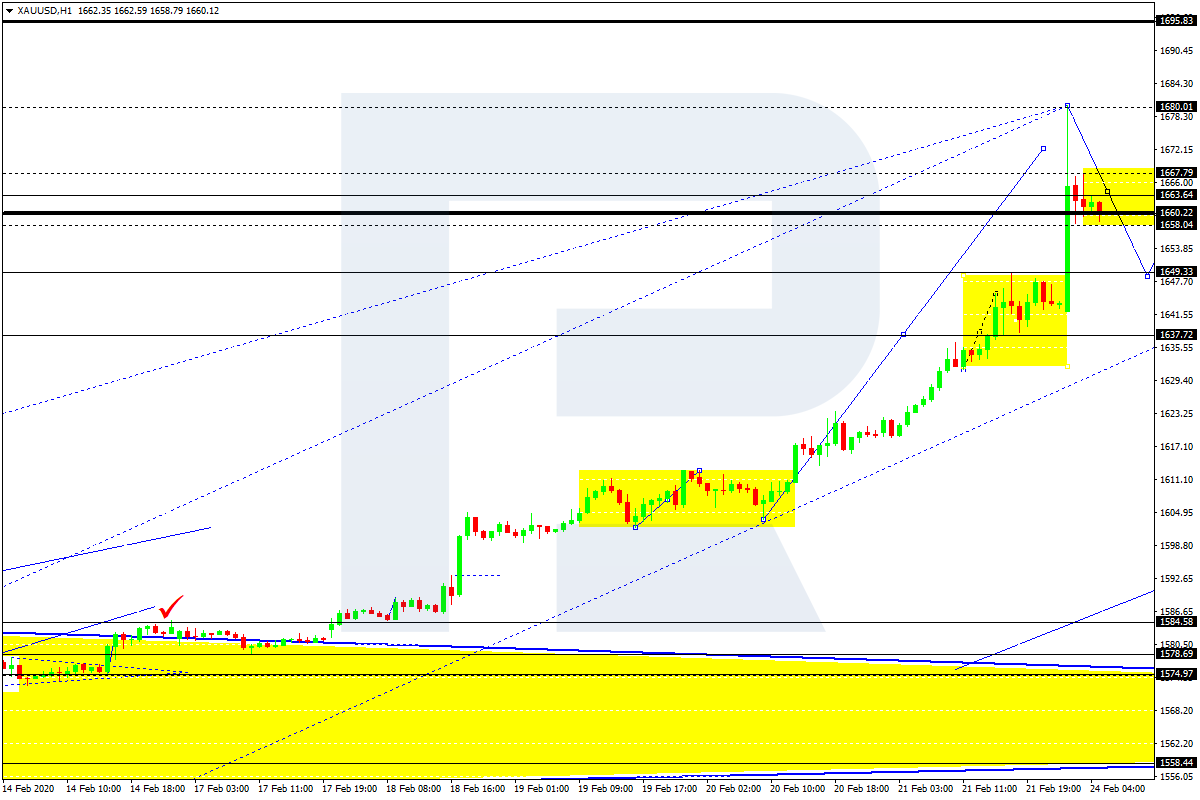
Gold has reached 1680.00; right now, it is moving downwards with the target at 1649.33. Later, the market may form one more ascending structure towards 1663.63.
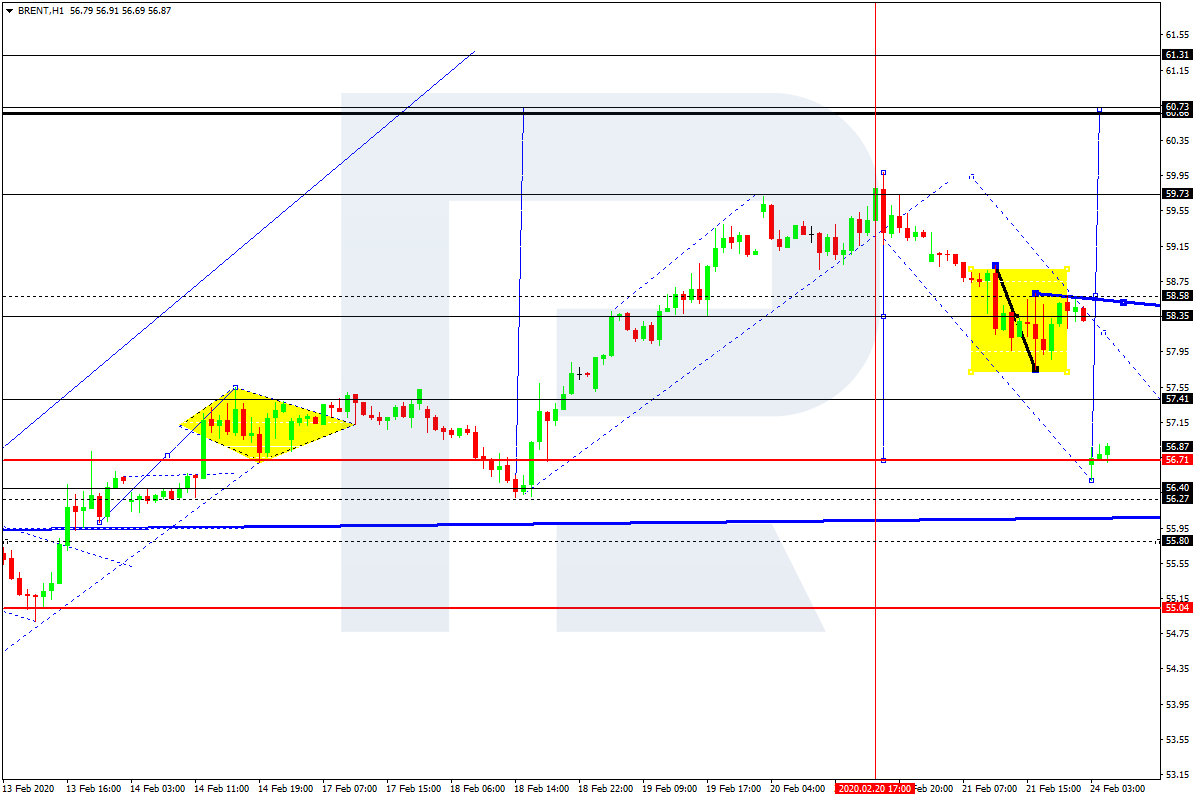
BRENT
After forming the consolidation range around 58.35 and breaking it to the downside, Brent has reached 56.70. Possibly, the pair may form one more ascending structure to return to 58.35 and then resume trading downwards with the target at 57.40.
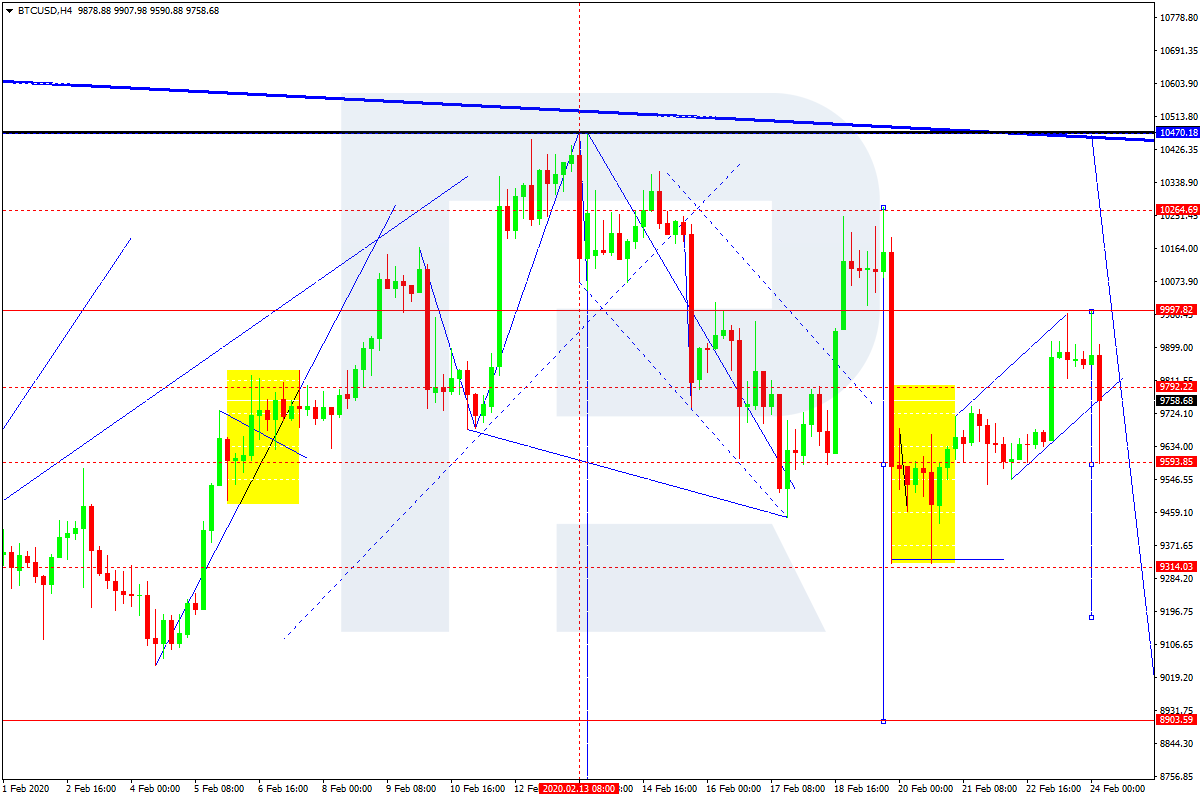
BTCUSD, “Bitcoin vs US Dollar”
After completing the correction towards 9990.00, BTCUSD has finished the descending structure at 9600.00, thus forming a new consolidation range between these two levels. Possibly, today the pair may break the range to the downside and then continue trading downwards with the short-term target at 8900.00.
Attention! Forecasts presented in this section only reflect the author’s private opinion and should not be considered as guidance for trading. RoboForex LP bears no responsibility for trading results based on trading recommendations described in these analytical reviews.
Investors remain complacent about an imminent Coronavirus-triggered market correction of up to 10 per cent, warns the CEO of one of the world’s largest independent financial advisory organizations.
The warning from deVere Group’s chief executive and founder, Nigel Green, comes as global equities registered losses on Monday following a surge in cases in Italy, Iran and South Korea over the weekend, and as the first cases are confirmed in Kuwait, Bahrain and Afghanistan.
Mr Green comments: “Global financial markets retreated on Monday as they reacted to the coronavirus headlines over the weekend. But it is likely that they will quickly rebound, as they have consistently done in recent weeks.
“Indeed, stocks keep on reaching record highs.
“This is because many investors remain complacent about the far-reaching impact of coronavirus, which is continuing to spread – and a faster pace. This will inevitably hit financial markets and investors’ complacency leaves many wide open to nasty surprises.”
He continues: “Major global companies, especially those with heavy exposure to the Chinese economy, are lowering profit guidances due to the outbreak. This will have a knock-on effect across international supply chains and throughout economies. But is the message being heard by investors?
“In addition, coronavirus has struck at a time when major economies, including Japan, Germany, India and Hong Kong are facing a downturn due to other factors such as the U.S.-China trade dispute and political protestors, which could hit the world economy.”
The deVere CEO goes on to add: “Until such time as governments pump liquidity into the markets and coronavirus cases peak, a near-term correction – of up to 10 per cent – is increasingly likely.
“We are hoping for a V-shaped recovery, but our current view is that it will be U-shaped.
“Against this backdrop and with the ongoing uncertainty over the direction of stocks and other risk assets, multi-asset portfolios might be favoured by global investors, given that they offer diversification of risk as well as of return.”
Nigel Green concludes with a warning: “Global markets are at high valuations and the impact of the coronavirus on profits appears largely underestimated.
“In general terms, stocks have hardly been deterred by the coronavirus outbreak. This complacency is concerning.
“Investors need to ensure that their portfolios are coronavirus-proofed as cases jump and a market correction looks more likely.”
About:
deVere Group is one of the world’s largest independent advisors of specialist global financial solutions to international, local mass affluent, and high-net-worth clients. It has a network of more than 70 offices across the world, over 80,000 clients and $12bn under advisement.