by JustForex
The EUR/USD currency pair
- Prev Open: 1.08804
- Open: 1.08823
- % chg. over the last day: +0.05
- Day’s range: 1.08776 – 1.09179
- 52 wk range: 1.0879 – 1.1572
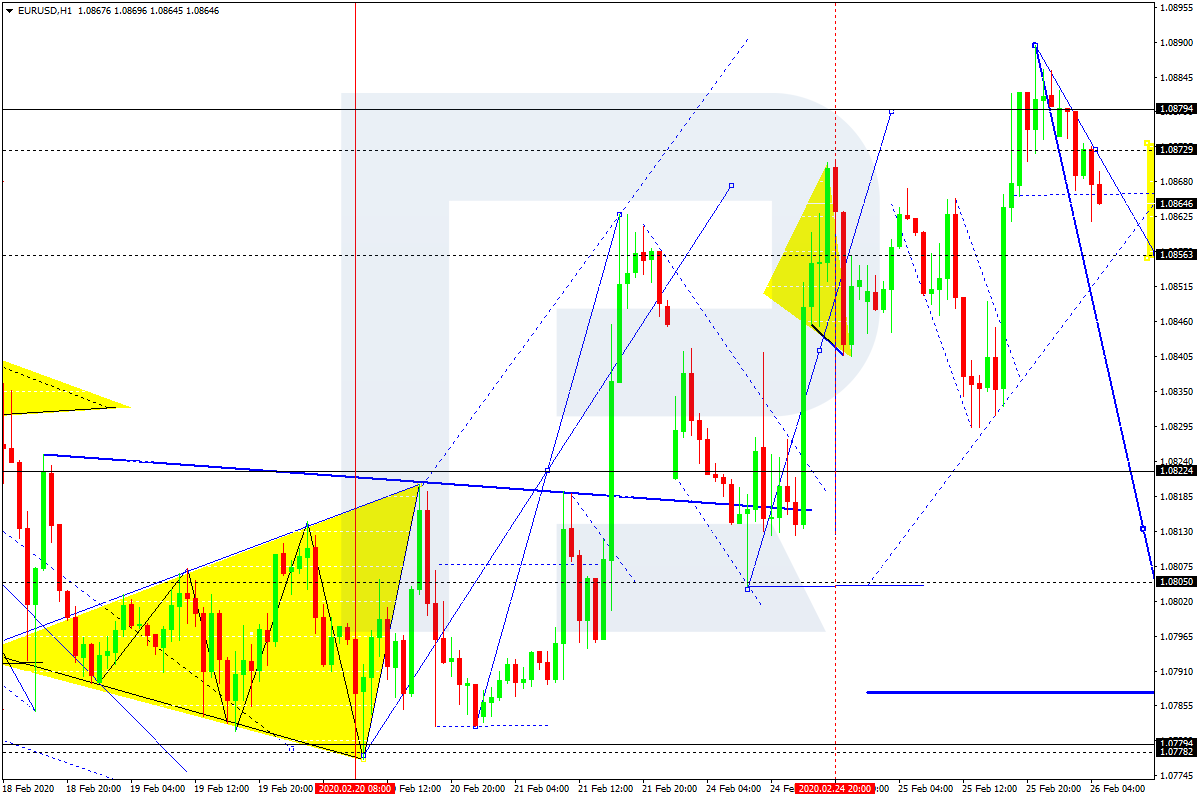
The EUR continued its growth against the greenback. The EUR/USD quotes updated the local highs again. At the moment the trading instrument is testing resistance at 1.09150. The mark 1.08850 is already a mirror support. The Euro has a potential for further strengthening. Investors are closely monitoring the situation with the coronavirus COVID-19 spreading outside China. Today, participants of financial markets will assess important economic releases from the USA. Positions need to be opened from key levels.
The Economic News Feed for 27.02.2020:
- – Report on orders for durable goods (US) – 15:30 (GMT+2:00);
- – GDP report (US) – 15:30 (GMT+2:00);
- – Pending home sales report (US) – 17:00 (GMT+2:00);

The indicators signal the strength of buyers: the price has fixed above 50 MA and 100 MA.
MACD histogram is in the positive zone and above the signal line, which gives a strong signal to buy EUR/USD.
The Stochastic Oscillator is in the neutral zone, the %K line is below the %D line, which indicates a bearish sentiment.
- Support levels: 1.08850, 1.08600, 1.08300
- Resistance levels: 1.09150, 1.09500
If the price fixes above 1.09150, expect further growth of EUR/USD toward 1.09500-1.09700.
Alternatively, the quotes could descend toward 1.08600-1.08400.
The GBP/USD currency pair
- Prev Open: 1.30053
- Open: 1.28956
- % chg. over the last day: -0.77
- Day’s range: 1.28949 – 1.29379
- 52 wk range: 1.1959 – 1.3516
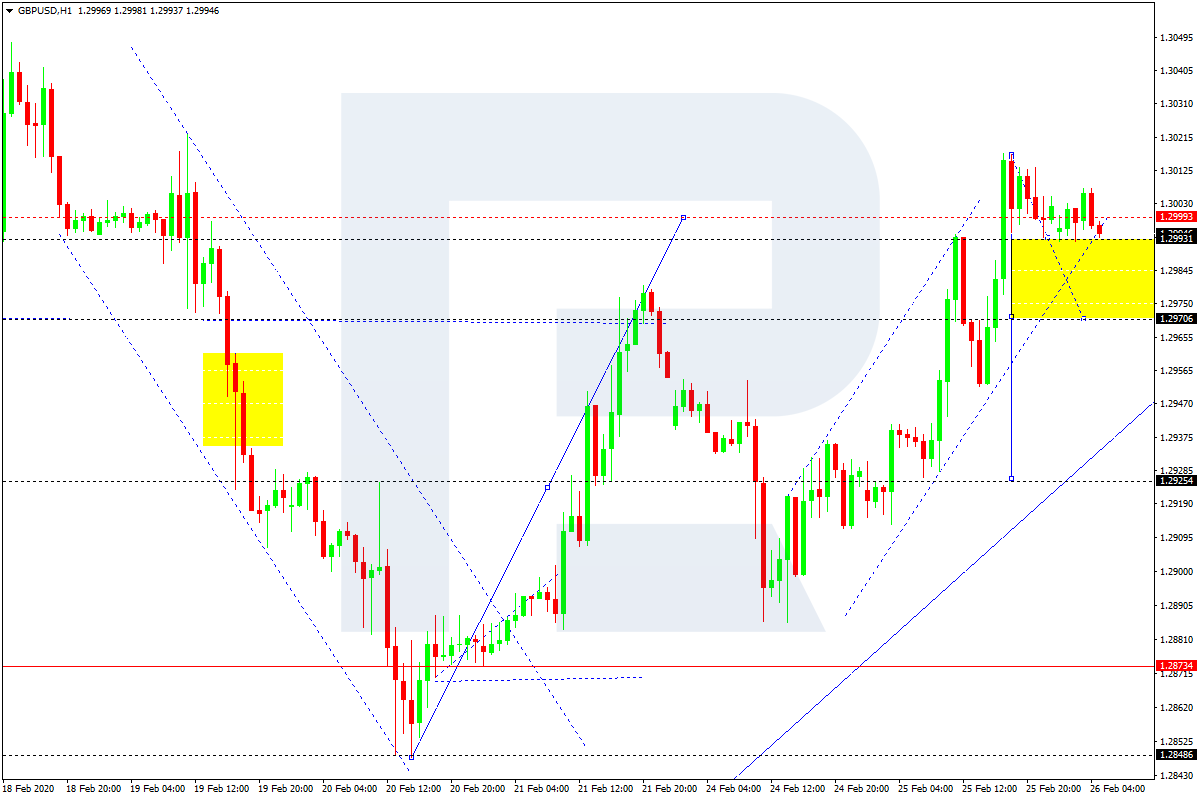
The GBP/USD currency pair has gone down. Yesterday the drop in quotes exceeded 100 points. GBP reached the round level of 1.29000. The local resistance is at the level of 1.29400. The technical pattern signals a further decrease in the trading instrument. Today the statistical data on the US economy is in the spotlight. We recommend opening positions from key levels.
The Economic News Feed for 27.02.2020 is calm.

The indicators signal the sellers’ strength: the price has fixed below 100 MA.
The MACD histogram is in the negative zone, but above the signal line, which gives a weak signal to sell GBP/USD.
The Stochastic Oscillator is located in the overbought zone, the %K line crossed the %D line. There are no signals at the moment.
- Support levels: 1.29000, 1.28500
- Resistance levels: 1.29400, 1.29750, 1.30150
If the price fixes above resistance level 1.29400, correction of GBP/USD quotes is expected to 1.30000.
Alternatively, the quotes could descend toward 1.28700-1.28400.
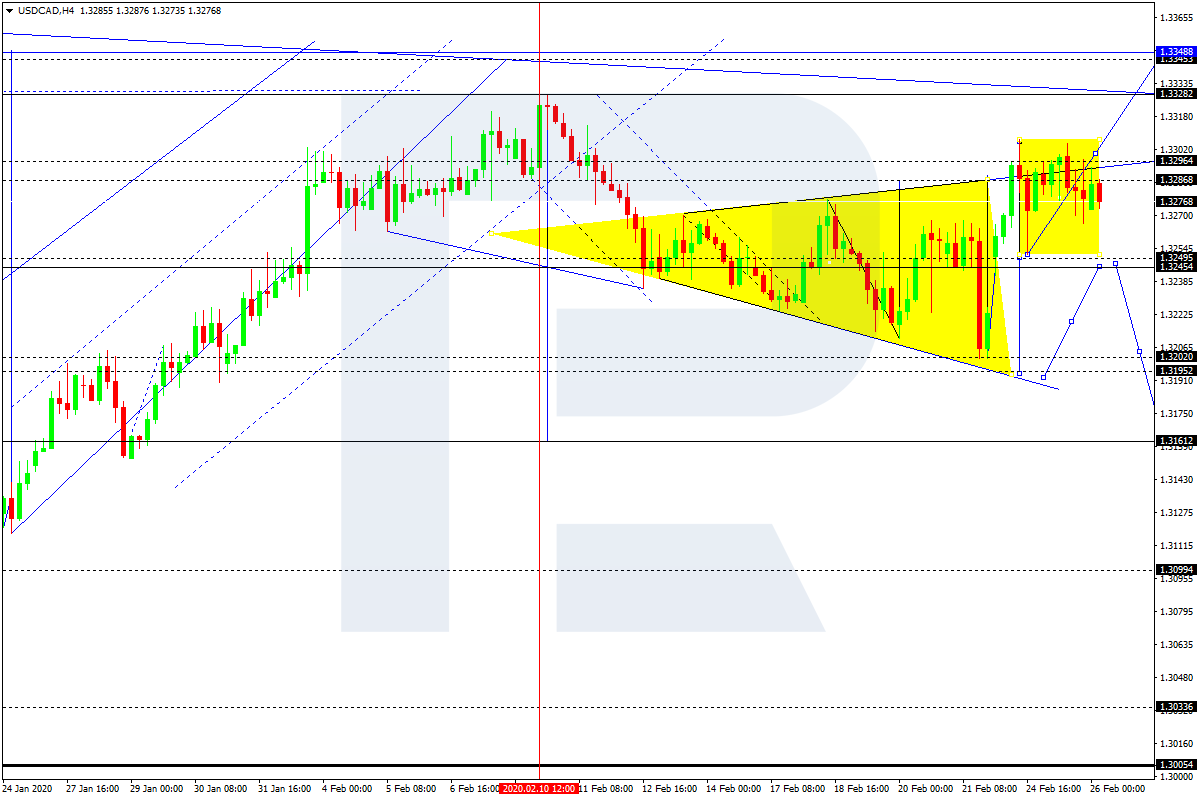
The USD/CAD currency pair
- Prev Open: 1.32787
- Open: 1.33292
- % chg. over the last day: +0.49
- Day’s range: 1.33247 – 1.33475
- 52 wk range: 1.2949 – 1.3566
The USD/CAD currency pair has moved up again. During yesterday’s and today’s trades the growth of quotations exceeded 60 points. The trading instrument has set new local highs. The CAD found resistance at 1.33450. The mark 1.33100 is already a mirror support. The Canadian dollar continues to be under pressure from the negative dynamics of oil prices. The USD/CAD quotes can grow further. Positions should be opened from key levels.
The Economic News Feed for 27.02.2020 is calm.

The indicators signal the strength of buyers: the price has fixed above 50 MA and 100 MA.
MACD histogram is in the positive zone, which indicates a bullish sentiment.
The Stochastic Oscillator is in the neutral zone, the %K line is below the %D line, which gives a sell signal for USD/CAD.
- Support levels: 1.33100, 1.32700, 1.32450
- Resistance levels: 1.33450, 1.33800
If the price fixes above 1.33450, expect further growth of USD/CAD quotes ito 1.33800-1.34000.
Alternatively, the quotes could descend toward 1.32800-1.32600.
The USD/JPY currency pair
- Prev Open: 110.196
- Open: 110.401
- % chg. over the last day: +0.49
- Day’s range: 109.967 – 110.457
- 52 wk range: 104.45 – 113.53
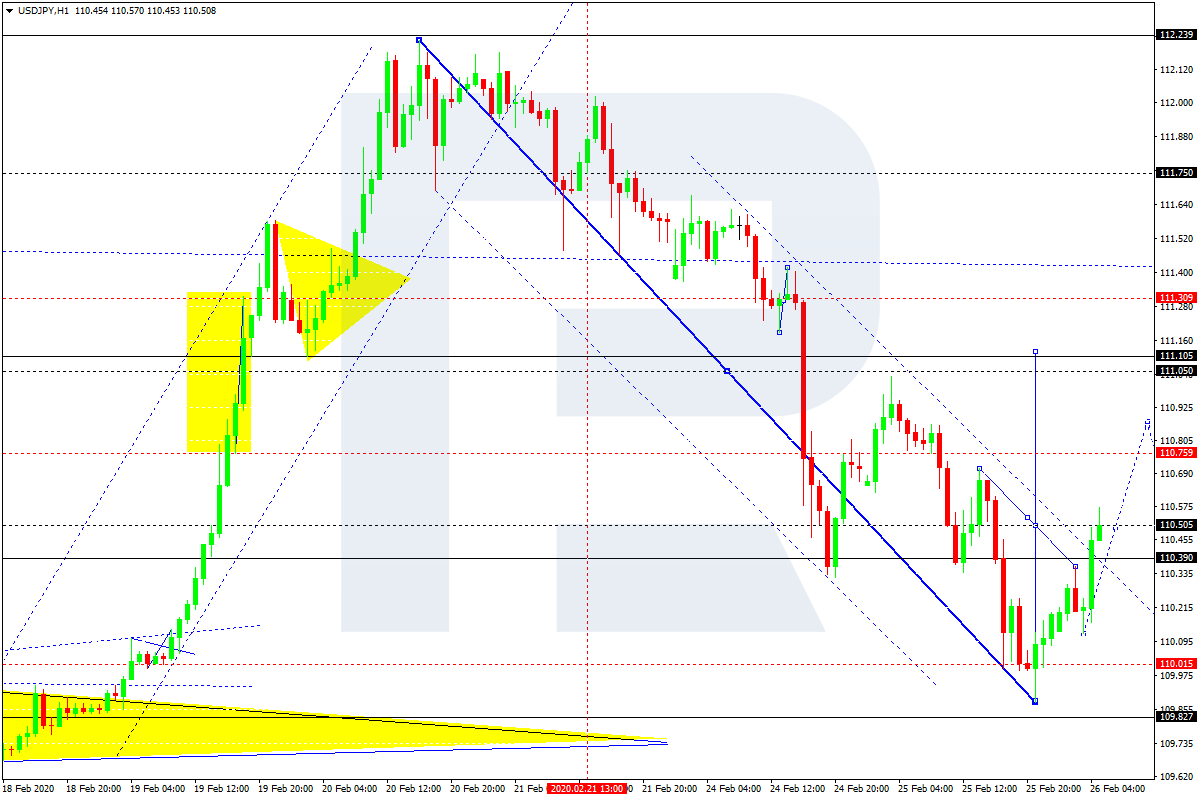
USD/JPY stabilized after a prolonged decline. At the moment the trading instrument is in sideways movement. USD/JPY quotes are testing the round level of 110.000. The mark 110.500 is the nearest resistance. Demand for safe haven currencies is still at a high enough level. Investors estimate the risks of further coronavirus spreading from China. Today, we recommend that you pay attention to the economic reports, as well as the dynamics of yield on U.S. government securities. Positions should be opened from key levels.
The Economic News Feed for 27.02.2020 is calm.

The indicators signal the sellers’ strength: the price has fixed below 50 MA and 100 MA.
MACD histogram is in the negative zone, which gives a sell signal for USD/JPY.
The Stochastic Oscillator started to exit the oversold zone, the %K line is above the %D line, which indicates a correction of the USD/JPY currency pair.
- Support levels: 110.000, 109.650
- Resistance levels: 110.500, 110.700, 111.100
If the price fixes below the round 110.000, expect the quotes to fall 1.09700-1.09400.
Alternatively, the quotes could grow toward 110.800-111.100.
by JustForex