by JustForex
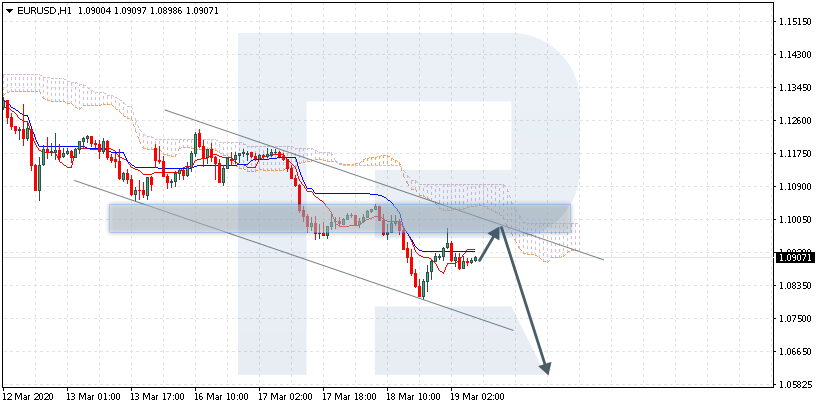
The EUR/USD currency pair
- Prev Open: 1.09119
- Open: 1.06560
- % chg. over the last day: -2.64
- Day’s range: 1.06547 – 1.08306
- 52 wk range: 1.0777 – 1.1494
The EUR/USD currency pair has stabilized after a significant drop. The sentiments of financial market participants improved slightly amid the global support measures taken by the central banks. At the moment EUR/USD quotes are consolidating. The key support and resistance levels are 1.06550 and 1.08200, respectively. Technical correction is not ruled out in the nearest future. We recommend opening positions from key levels.
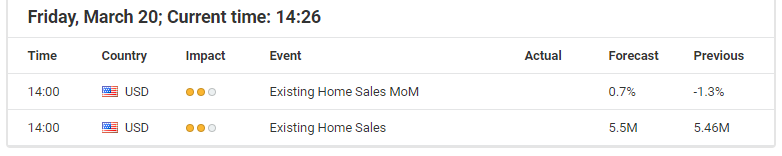
At 16:00 (GMT+2:00) data on the existing home sales in US will be published.

Indicators do not give accurate signals: the price tests 50 MA, which is currently a dynamic resistance.
Histogram of MACD started to rise, which indicates a possible correction of the EUR/USD currency pair.
The Stochastic Oscillator is located in the overbought zone, the %K line crossed the %D line. There are no signals at the moment.
- Support levels: 1.06550, 1.06000
- Resistance levels: 1.08200, 1.09550, 1.10600.
If the price fixes above 1.08200, expect the qutoes to correct toward 1.09000-1.09700
Alternatively, the quotes could descend toward the round 1.06000.
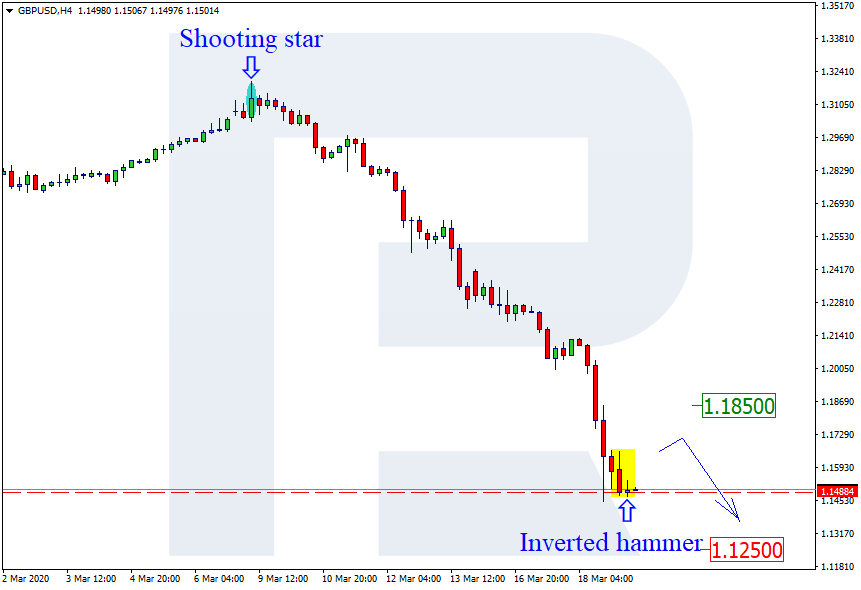
The GBP/USD currency pair
- Prev Open: 1.15803
- Open: 1.14620
- % chg. over the last day: -1.04
- Day’s range: 1.14096 – 1.18765
- 52 wk range: 1.1466 – 1.3516
GBP/USD quotes went up after a significant collapse. Pound has updated local highs. At the moment the trading instrument is testing the round level 1.19000. The mark 1.16600 is the nearest support. The GBP/USD currency pair has a potential for further correction. We recommend you to monitor the current information about the spread of the virus COVID-19. Open positions from key levels.
The news background on the UK economy is calm.

Indicators do not give accurate signals: the price has crossed 50 MA and 100 MA.
MACD has moved to the positive zone, which indicates the correction of the currency pair GBP/USD.
The Stochastic Oscillator is located in the overbought zone, the %K line crossed the %D line. There are no signals at the moment.
- Support levels: 1.16600, 1.14500
- Resistance levels: 1.19000, 1.21350
If the price fixes above the round level of 1.19000, expect a correction toward 1.19000.
Alternatively, the quotes could descend toward 1.15000-1.14000.
The USD/CAD currency pair
- Prev Open: 1.45086
- Open: 1.45003
- % chg. over the last day: -0.06
- Day’s range: 1.42074 – 1.45359
- 52 wk range: 1.2949 – 1.4668
The USD/CAD currency pair shows a correction movement after a prolonged rally. The quotes have updated the local lows. The CAD is supported by the “black gold” price recovery. At the moment the trading instrument is testing the level of 1.41700. The round level 1.44000 is already a “mirror” resistance. The USD/CAD currency pair has a potential for further decline. Open positions from key levels.
At 14:30 (GMT+2:00) Canada will publish a report on retail sales.

Indicators do not give accurate signals: the price has crossed 100 MA.
MACD histogram is in the negative zone, which indicates further correction of USD/CAD quotes.
The Stochastic Oscillator is located in the oversold area, the %K line has crossed the %D line. There are no signals at the moment.
- Support levels: 1.41700, 1.40150, 1.38750
- Resistance levels: 1.44000, 1.46600
If the price fixes below 1.41700, expect a correction toward 1.40200-1.39000.
Alternatively, the quotes could grow toward 1.45000-1.46000.
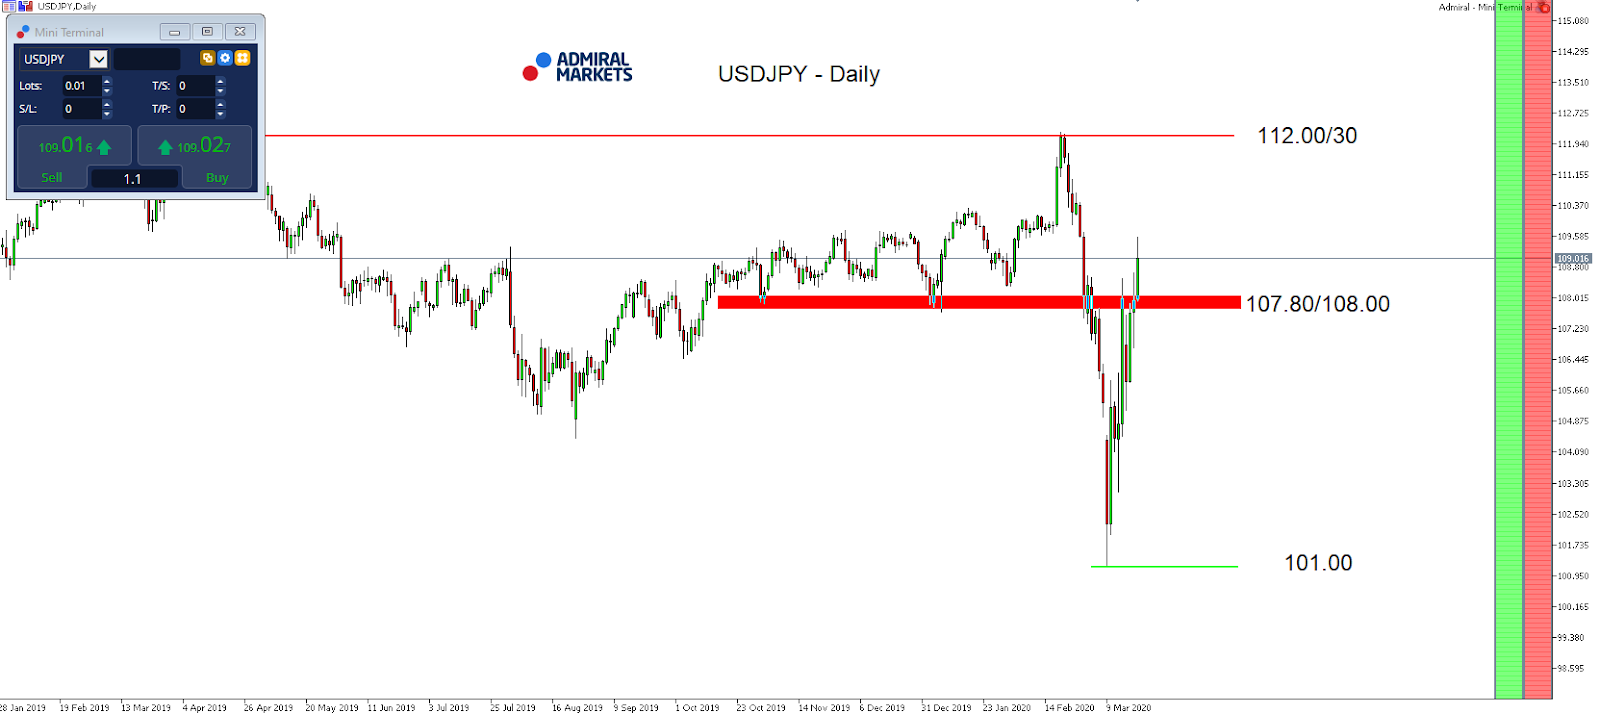
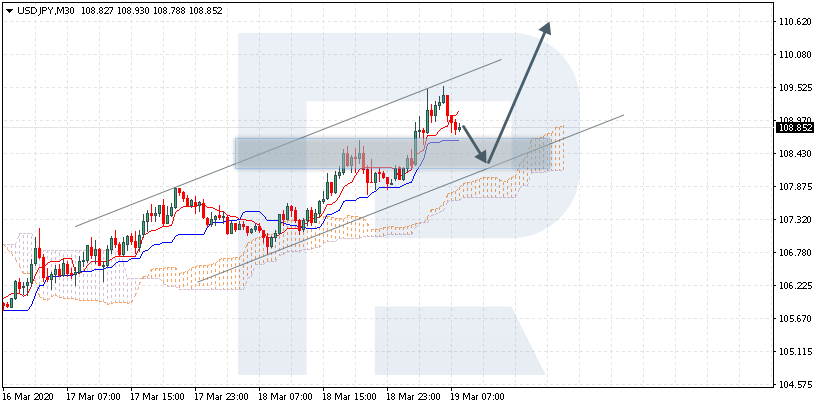
The USD/JPY currency pair
- Prev Open: 108.042
- Open: 110.888
- % chg. over the last day: +2.16
- Day’s range: 109.329 – 111.359
- 52 wk range: 101.19 – 112.41
USD/JPY currency pair shows a pronounced upward trend. The quotes have renewed the local highs. Demand for safe haven currencies has weakened. At the moment the trading instrument is testing the “mirror” support level 109.500. The mark 111.300 is the nearest resistance. USD/JPY quotes have potential for further growth. We recommend you to pay attention to the dynamics of the US government securities yield. Open positions from key levels.
The Economic News Feed for 20.03.2020 is calm.

The indicators signal the power of buyers: the price has fixed above 50 MA and 100 MA.
The MACD histogram is in the positive zone, but below the signal line, which gives a weak signal to buy USD/JPY.
The Stochastic Oscillator is in the neutral zone, the %K line is above the %D line, which indicates a bullish sentiment.
- Support levels: 109.500, 108.500, 107.850.
- Resistance levels: 111.300, 112.000
If the price fixes above 111.300, expect further growth.
Alternatively, the quotes could descend toward 108.500-107.500.
by JustForex