Author Archive for InvestMacro – Page 602

Murrey Math Lines 27.01.2017 (EUR/USD, USD/CAD)

Article By RoboForex.com

EUR USD, “Euro vs US Dollar”

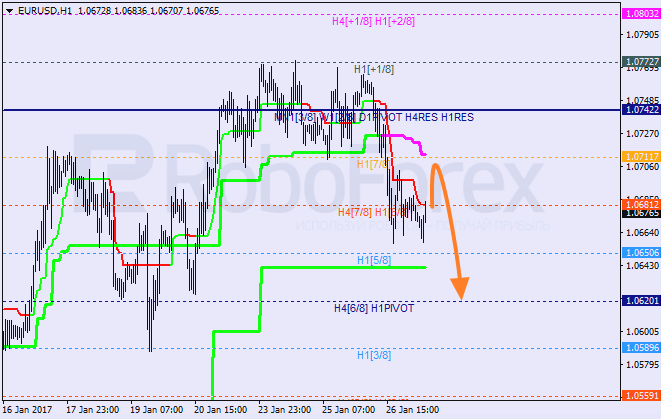
The EUR/USD pair is consolidating between Super Trends. Earlier, the price failed to fix above the 8/8 level after all. Consequently, in the nearest future the market may fall towards the 6/8 level. After reaching it, the pair may start a new ascending movement.

As we can see at the H1 chart, Super Trends formed “bearish cross”. On Friday, the pair may start a local correction, which may later be followed by the test of the 4/8 level. If the price rebounds from this level and fixes above the daily Super Trend, the market may resume growing.


USD CAD, “US Dollar vs Canadian Dollar”

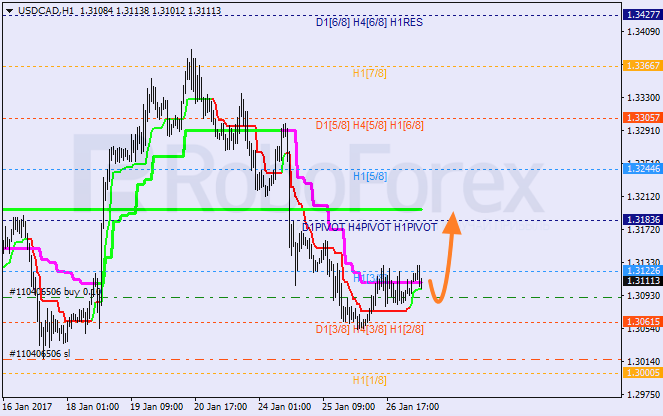
In case of the USD/CAD pair, the lines at the daily and H4 charts are completely the same. The price rebounded from the 3/8 level three times, which means that it may start an ascending correction, at least. The closest target for bulls is at the daily Super Trend.

At the H1 chart, Super Trends may form “bullish cross” soon. In this case, the pair may start a short-term growth towards the 4/8 level.


RoboForex Analytical Department
Article By RoboForex.com

Attention!
Forecasts presented in this section only reflect the author’s private opinion and should not be considered as guidance for trading. RoboForex LP bears no responsibility for trading results based on trading recommendations described in these analytical reviews.

Gold Slips on Dollar Strength, Profit Taking, Trump Comments and Futures Expiration

By Jason Hamlin, GoldStockBull.com

The gold price rallied sharply during the start of 2017, advancing nearly $100 from $1,125 to $1,220 in less than a month. But the price failed on two separate attempts to break out above $1,220, forming a short-term double top. The last time such a pattern filled on the chart, it led to a sharp 4-month decline. The gold price appears to be headed lower with room to continue dropping before becoming technically oversold.

gold chart

It would be bullish to see a bounce off the 50-day moving average at $1,179. Bulls certainly do not want to see the gold price fall below the December low of $1,125, which is just $65 below the current price. Such a move would be very bearish for the gold price and suggest an immediate test of $1,075 and potential test of $1,000.

The advance in the gold price over the past month has been driven largely by a weaker dollar. But a bounce in the USD index over the past few days has led to lower commodity prices. The USD index briefly dipped below the key technical level at 100 on January 25th, but quickly bounced back towards 101 the following day. This bounce has given hope to dollar bulls and created weakness in the gold price.

usd short term

But two days of advances does not make a trend and the current trajectory for the dollar remains to the downside. Since the beginning of 2017, the index has been putting in lower lows and lower highs. So the bounce over the past few days is not yet significant and would require a move above 101.60 before dollar bulls should get excited.

The 100 level for the USD index is not just psychologically important, but is also technically significant. The 100 level was key resistance twice during 2015, then turned into support in late 2016. It remains to be seen if the 100 level turns into long-term support. The double-bottom pattern shown in the USD index is typically bullish, but anything can happen in the months ahead with a new party in power and unconventional leader.

usd index

Fundamental Factors are Pressuring the Gold Price

While most currencies are down versus the dollar today, the weakness has been driven primarily by the Mexican Peso sliding versus the dollar. This has occurred as a trade war is heating up between the Trump administration and the Mexican government. Mexican President Enrique Peña Nieto on Thursday canceled a meeting with US President Donald Trump that had been set for next week after renewed tensions erupted over Trump’s plan to build a wall on the border. Nieto refused to pay for the wall and Trump insists that he must, threatening import tariffs of 20%.

Much of the dollar’s future will depend on what the Trump administration announces in the weeks and months ahead, as well as any changes to the FED rate-hike trajectory. With the long dollar trade so crowded, I have predicted dollar weakness in 2017 and this has proven true thus far. But most analysts are still expecting a much stronger dollar in 2017.

The Trump effect on the markets may be wearing thin. Investor faith that President Trump will be able to generate economic growth has pushed equity values to record levels, with the Dow Jones finally taking out 20,000 yesterday. But a report from UBS says that investors are scaling back optimism that emerged shortly after the U.S. elections.

“We think this is warranted and see room for gold to extend upwards as markets digest uncertainty around U.S. fiscal policy. But gold has also recovered considerably and market uncertainty at this point could encourage investors to lock in whatever profits they can for now, especially as seasonal gold demand fades,” UBS said in a note.

Profit-taking after the huge run in early 2017 is surely part of gold’s latest decline. The sliding gold price may also be driven by the expiration of COMEX futures and options contracts. Gold options contracts for February expired today (1/26) and futures expire tomorrow (1/27). There is evidence that the big banks routine collude to manipulate commodity prices just prior to expiration dates. Long contracts will then expire worthless and short sellers profit. This could be another factor explaining gold’s price weakness over the past few days.

Lastly, weaker demand leading up to the Chinese Lunar New Year may help explain why gold was unable to continue higher this week. Gold is heading out of its seasonally strong period, which may put further pressure on prices over the next few months.

Of course, any number of black swan events or announcements by a President implementing significant changes could completely change gold’s direction. So, while we are generally bearish in the short-term, we plan to maintain core positions for the time being. Hedging long portfolios makes sense at this juncture, but we will be prepared to quickly close those positions should the gold price bottom above prior lows.

In the meantime, we believe there are investment opportunities in other sectors that are bouncing off multi-year lows and could have significant upside ahead. We have taken positions in some of the following sectors and continue to research our top turnaround picks for subscribers. These include select industrial metals, lithium, uranium, critical metals, agriculture, emerging technologies and high-growth Canadian cannabis growers.

The Gold Stock Bull portfolio returned nearly 70% in 2016 and is up 12% in just the first few weeks of 2017. You can get all of our stock picks, trade alerts and the monthly contrarian newsletter here.

About the Author:

Jason Hamlin is the founder of Gold Stock Bull and has been investing in precious metals for over 20 years. Jason spent nearly a decade in analytics for the world’s largest market research firm, before finding success investing full time. He launched Gold Stock Bull in 2005 and turned his focus from helping fortune 500 companies to helping individual investors that were struggling to achieve strong gains in the stock market.

Forex Technical Analysis & Forecast 27.01.2017 (EUR/USD, GBP/USD, USD/CHF, USD/JPY, AUD/USD, USD/RUB, GOLD, BRENT)

Article By RoboForex.com

EUR USD, “Euro vs US Dollar”

The EUR/USD pair has broken the consolidation range to the downside. Possibly, today the price may form another descending structure to reach 1.0650. After that, the instrument may grow towards 1.0707 and then and then continue falling with the target at 1.0640.


GBP USD, “Great Britain Pound vs US Dollar”

The GBP/USD pair is moving downwards to reach 1.2415. Possibly, today the price may form the first structure of this wave with the target at 1.2470. After that, the instrument may test 1.2550 from below and then continue falling towards 1.2415.


USD CHF, “US Dollar vs Swiss Franc”

The USD/CHF pair is consolidating. Possibly, today the price may break this range to the upside and expand it towards 1.0080.


USD JPY, “US Dollar vs Japanese Yen”

The USD/JPY pair is consolidating. Possibly, the price may grow with the target at 115.50 and then fall to reach 114.26. After that, the instrument may grow towards 116.00.


AUD USD, “Australian Dollar vs US Dollar”

Being under pressure, the AUD/USD pair is moving downwards. The price is expected to reach 0.7500. Possibly, today the price may fall towards 0.7510 and then grow with the target at 0.7555. Later, in our opinion, the market may continue falling to reach 0.7500.


USD RUB, “US Dollar vs Russian Ruble”

The USD/RUB pair has returned to 60.40. Possibly, today the price may start falling to reach 58.78.


XAU USD, “Gold vs US Dollar”

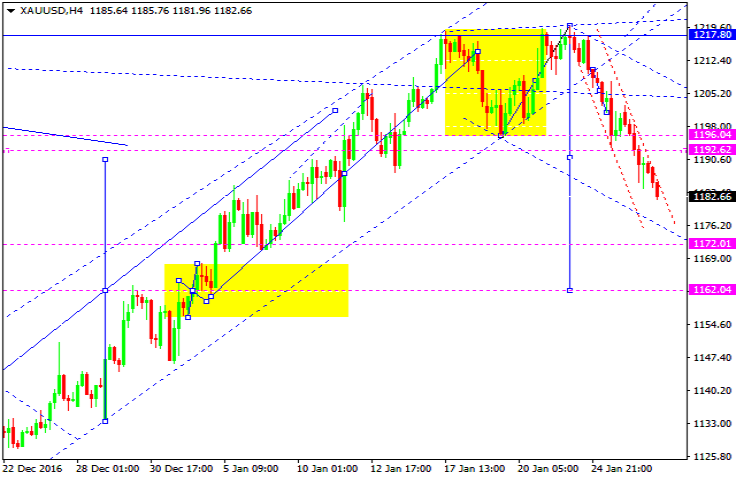
Being under pressure, Gold is moving downwards; it has reached the target of the descending movement. Possibly, today the price may continue falling and extend this structure towards 1172. After that, the instrument may be corrected to reach 1196 and test it from below. Later, in our opinion, the market may form another descending structure with the target at 1100.


BRENT

Brent has completed another ascending structure; it has reached the triangle’s upside border. Possibly, today the price may rebound downwards and start falling to reach 55.00. This structure may be considered as a part of the wave with the target at 53.05.


RoboForex Analytical Department
Article By RoboForex.com

Attention!
Forecasts presented in this section only reflect the author’s private opinion and should not be considered as guidance for trading. RoboForex LP bears no responsibility for trading results based on trading recommendations described in these analytical reviews.

EUR/USD: all eyes on US GDP figures for Q4

By Gabriel Ojimadu, Alpari

Previous:

On Thursday, trading on the euro closed down. From the Asian high of 1.0766, the pair fell by 108 points to 1.0658. The American dollar underwent a correction after its fall on Wednesday due to the growing US bonds yields. This growth is also responsible for the euro’s slide. After the euro fell at the beginning of the American session, it was subsequently restored to 1.0704. After some sharp fluctuations, the pair’s volatility subsided and went into a consolidative phase.

The American statistics:

  • The index of leading indicators in the US for December stood at 0.5% (forecasted: 0.5%, previous figure: 0.1%).
  • 536,000 new homes were sold in the US in November (forecasted: 588,000, previous figure: 598,000).
  • The number of unemployment benefit applications rose to 259,000 (forecasted: 247,000, previous figure: 237,000).
  • America’s goods trade deficit rose to 65 billion USD (forecasted: 64.5 billion).
  • The Business Activity Index (RMI) in the service sector stood at 51.1 (forecasted: 54.4, previous figure: 53.9).

Market expectations:

On Friday the 27th of January, traders’ attention will mainly be focused on the US’ GDP data for the 4th quarter, as well as the actions of the new administration. Upon knowing when the final figures will be published, we can expect a press release from the American government within a day.

In the final trading day of this week, I expect the euro to fall to 1.0637, followed by a bounce up to 1.0695. I think that in the coming days, the rate will fall within a range of 1.0614 – 1.0640.

Day’s news (GMT+3)

  • 12:00 Eurozone – M3 money supply for December; private loans report for December;
  • 16:30 USA – preliminary GDP growth data for Q4 of 2016; durable goods orders for December;
  • 18:00 USA – revised figures for the Consumer Sentiment Index from the University of Michigan (January); revised figures on inflation expectations according to data from the University of Michigan (January);
  • 21:00 USA – Baker Hughes operational US oil rig count.

EURUSD rate on the hourly. Source: TradingView

Intraday forecast: low: 1.0637, high: 1.0695, close: 1.0651.

The euro slid from its high of 1.0770 by 90 degrees. This degree is unimportant with regards to the euro. The rate can bounce, but inversions are rare. What happens more often, is that the rate falls to somewhere between the 112th and 135th degrees. The corresponding range in this case is from 1.0614 to 1.0640.

I’ve had to readjust the trend line, as the hourly candles closed above it. According to the forecast, prices are expected to recover to 1.0695 by 11:00 on the back of a correction of the euro/pound cross. During the American session I’m expecting the trend line to be broken. The price is unlikely to reach the 112th degree before the US releases its Q4 GDP growth data.

It’s worth noting that long positions exceed short ones. Now the market will do a number on consumers. They will be building up positions and the price will go down. According to the latest data from myfxbook, the short/long ratio is at 45/54, or 7982/9581 lots. I should warn you that it’s not a good idea to rely on this indicator completely. It’s greatly helpful as a general guideline, but no more than that.

Inflation: Here’s What the Wrong-Way Bet Looks Like

Chart of the Day

By Elliott Wave International


Markets all around the world are at a critical juncture — you must see this free report now.

This is the fifth year EWI has created their annual State of the Global Markets Report. And since many markets around the world are at a critical juncture, this may be the most-timely edition of the State of the Global Markets Report yet!

It comes right out of the pages of their paid publications. For a limited time, you can see this report at no cost.

Get your 21-page State of the Global Markets Report — 2017 Edition now.

This article was syndicated by Elliott Wave International and was originally published under the headline Inflation: Here’s What the Wrong-Way Bet Looks Like. EWI is the world’s largest market forecasting firm. Its staff of full-time analysts led by Chartered Market Technician Robert Prechter provides 24-hour-a-day market analysis to institutional and private investors around the world.

Ichimoku Cloud Analysis 26.01.2017 (GBP/USD, GOLD)

Article By RoboForex.com

GBP USD, “Great Britain Pound vs US Dollar”

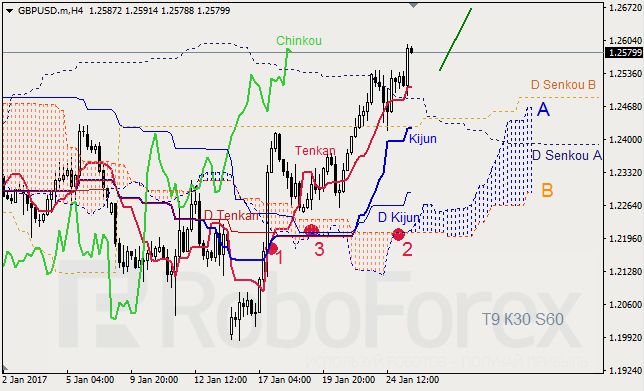
GBP USD, Time Frame H4. Indicator signals: D Tenkan-Sen and D Kijun-Sen are forming D “Golden Cross” (3); Tenkan-Sen and Kijun-Sen are still influenced by “Golden Cross” (1). Ichimoku Cloud is going up (2) and expanding, Chinkou Lagging Span is above the chart, and the price is above Tenkan-Sen. Short-term forecast: we can expect a descending correction, support from Kijun-Sen, and then growth of the price.

GBP USD, Time Frame H1. Indicator signals: Tenkan-Sen and Kijun-Sen are influenced by “Golden Cross” (1). Ichimoku Cloud is heading up (2), Chinkou Lagging Span is getting closer to the chart, and the price is on Kijun-Sen. Short-term forecast: we can expect support from Kijun-Sen, resistance from Tenkan-Sen, and decline of the price.


XAU USD, “Gold vs US Dollar”

XAU USD, Time Frame H4. Indicator signals: Tenkan-Sen and Kijun-Sen intersected and formed “Dead Cross” (1), but the lines are still influenced by D “Golden Cross” (3). Ichimoku Cloud is closed (2), Chinkou Lagging Span is below the chart, and the price is near Kumo’s downside border inside the daily cloud. Short‑term forecast: we can expect resistance from Senkou Span B, and the price to be corrected towards D Kijun-Sen.


RoboForex Analytical Department

Article By RoboForex.com

Attention!
Forecasts presented in this section only reflect the author’s private opinion and should not be considered as guidance for trading. RoboForex LP bears no responsibility for trading results based on trading recommendations described in these analytical reviews.

EUR/GBP: Is recent GBP rally coming to an end?

By GrowthAces.com

Macroeconomic overview

Sterling hit a three-week high against the EUR on Thursday after data showed Britain’s economy kept its robust momentum in the final three months of 2016, again wrong-footing expectations that the vote for Brexit would rapidly take a toll on growth.

British GDP rose at a quarterly rate of 0.6% between October and December, Britain’s Office for National Statistics said, maintaining the above-average pace seen in the first three months after June’s Brexit referendum. Compared with a year earlier, the economy grew by 2.2%, again slightly faster than expected.

UK GDP and its structure

Britain was probably one of last year’s fastest-growing major advanced economies, and there are some signs this will continue into early 2017, with the Confederation of British Industry reporting strong orders for manufacturers in January.

Bank of England Governor Mark Carney has warned that growth has become more reliant on consumer spending. Unbalanced growth could prove a problem for 2017, when the weaker currency is forecast to make itself felt through higher inflation, curbing consumers’ spending power and hitting businesses with higher costs.

In November the BoE forecast growth would slow to 1.4% this year as inflation exceeds 2.7% by the end of the year. The Bank is widely expected to revise its forecast for inflation up further next week.

Prime Minister Theresa May has said she plans to launch formal divorce talks between Britain and the EU before the end of March, something that is likely to highlight the uncertain outlook for the country’s economy in the years ahead. Her finance minister Philip Hammond has said the resilience of the British economy since the vote means the country will enter the Brexit negotiations from a position of strength.

Technical analysis

The EUR/GBP broke below the rising December-January trendline and the nearest support level is 0.8450 low on January 3. We think there is a chance for a recovery move from here and today’s close will show us whether it worth to risk a long position for the coming sessions.

EURGBP Daily Forex Signals Chart

Trading strategy

The situation is unclear now and we are waiting for today’s close to decide whether to open a long position.


NZD/USD: Strong CPI acceleration in New Zealand

Macroeconomic overview

New Zealand inflation sped up smartly to 1.3% last quarter on an annual basis, moving back into the central bank’s target range for the first time in two years in a relief for policy makers. A reading of 1.2% had been expected.

New Zealand inflation and RBNZ rate

The revival should reinforce the Reserve Bank of New Zealand’s determination to keep interest rates on hold after slashing to a record low of 1.75% last November, when inflation was hovering at just 0.4%.

High construction costs, rising petrol prices and increased spending and demand for services from the country’s record number of migrants and tourists pushed up the index.

In its last monetary policy statement, the RBNZ forecast inflation would pick up to 1.7% by the end of this year and 2.0% by the close of 2018. In our opinion these forecasts are probably too dovish. The central bank next meets on February 9 and is considered certain to stand pat with a neutral bias on policy.

Technical analysis

The trend is bullish now but some bear warning signals appear. The pair pierced the 76.4% fibo of 0.7402-0.6859 fall but could not hold above that level.

NZDUSD Daily Forex Signals Chart

Trading strategy

We think that the NZD/USD is likely to retreat to near 0.7160 in the coming days and we will consider entering a long position at that point.


TRADING STRATEGIES SUMMARY:

(Detailed trading strategies are available only for VIP subscribers)

About the Author:

By GrowthAces.com – Daily Forex Trading Strategies


Wave Analysis 26.01.2017 (EUR/USD, GBP/USD, USD/JPY, AUD/USD)

Article By RoboForex.com

EUR USD, “Euro vs US Dollar”

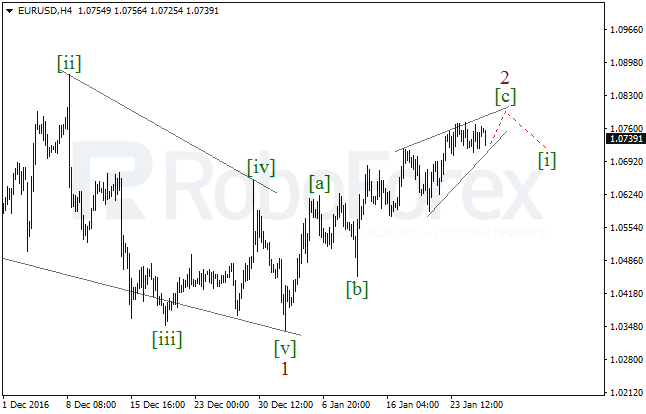
Possibly, the wave [c] of 2 is taking the form of the diagonal triangle. If this assumption is correct, in the nearest future the market may continue moving towards the pattern’s upside border. If later the price rebounds from it, bears nay try to resume the downtrend.

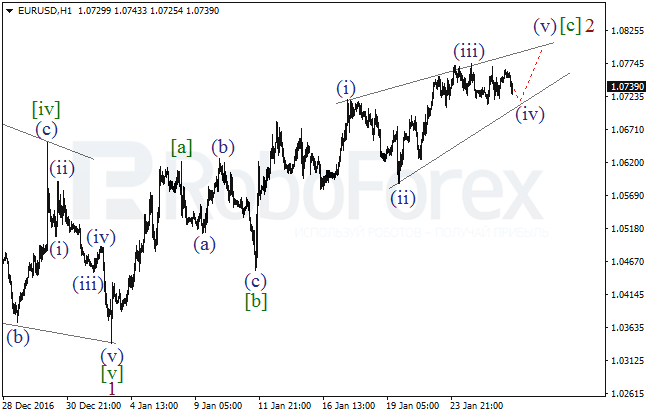
More detailed structure is shown on the H1 chart. It looks like the pair is about to complete the fourth wave in the diagonal triangle [c]. As a result, during the day the price may resume moving upwards and form the wave (c) of [v].


GBP USD, “Great Britain Pound vs US Dollar”

After finishing the wave (v) and, as result, completing the wave [iii], the GBP/USD pair started the current correction. It’s highly likely that right now the price is forming the zigzag, which may be the wave (a) or (w). In the nearest future, the market may continue growing in the wave c.

As we can see at the M30 chart, the pair is about to complete the third wave in the wave c. Consequently, in the nearest future the price is expected to start the wave [4], which may be followed by a new growth in the wave [5] of c.


USD JPY, “US Dollar vs Japanese Yen”

In case of the USD/JPY pair, the price is still forming the wave 2 in the form of the double zigzag. Possibly, during the next several days the pair may continue falling in the wave [y]. As a result, in the nearest future the market may reach a new local low.

As we can see at the H1 chart, the pair is probably forming the descending zigzag in the wave [y] of 2. Consequently, after finishing the correctional wave (b), the market may form another bearish impulse in the wave (c) of [y].


AUD USD, “Australian Dollar vs US Dollar”

The AUD/USD pair is still forming the ascending impulse, which may be the wave (a) of [ii]. On a longer timeframe, the price is probably forming the diagonal triangle in the wave 5. During the next several days, the market may continue moving upwards in the zigzag [ii].

More detailed structure of the ascending impulse in the wave (a) is shown on the H1 chart. Probably, the pair completed the wave iv and may soon resume moving upwards in the wave v of (a) and, as a result, break the local high.


RoboForex Analytical Department

Article By RoboForex.com

Attention!
Forecasts presented in this section only reflect the author’s private opinion and should not be considered as guidance for trading. RoboForex LP bears no responsibility for trading results based on trading recommendations described in these analytical reviews.

EUR/USD: euro consolidating under resistance

By Gabriel Ojimadu, Alpari

Previous:

On Wednesday, trading on the euro closed up. Over the whole day, the single currency rose against the dollar from 1.0730 to 1.0746. Against the backdrop of the weakening of the American dollar, investors ignored the rise in US bond yields, as well as the fall of the euro/pound cross. The euro fell against the pound by 0.75% to 0.8507. The dollar may weaken further due to the uncertainty surrounding Donald Trump’s intentions with regards to his tax and budget plans.

Market Expectations:

In Asia, the euro restored to 1.0766. At the time of writing, one euro sells for 1.0758 USD. For Thursday I’ve decided not to make a forecast given that the market is ignoring the rise in US bond yields. The market could go either way, it looks to be 50/50. the price may go up, following the pound, and it could see a correction at around 1.0711, subsequently rising to 1.0676. The cross looks to be gearing towards a 50 point drop, but there is support at 0.8450. If the euro doesn’t weaken with the cross, then it should break through to 1.0775 in its correctional phase. The faster the price returns to 1.0720, the higher the probability of the euro falling to 1.0676.

Day’s news (GMT+3):

  • 10:00 Switzerland – trade balance sheet for December. Germany – Gfk consumer happiness index for January;
  • 12:30 UK – preliminary data for GDP change in the 4th quarter of 2016, the number of mortgage approvals for December according to BBA and the gross value added to the service sector in November;
  • 14:00 UK – realised sales from CBI in January
  • 16:30 USA – number of initial applications for unemployment benefits for 16-22 of January, figures for foreign trade in December and preliminary data on the volume of wholesale inventories for December;
  • 17:45 USA – preliminary data from the PMI index on the service sector for January
  • 18:00 USA – Sales in the primary housing market in December, index of leading indicators from the Conference Board for December.

Technical Analysis:

EUR/USD rate on the hourly. Source: TradingView

Intraday forecast: minimum – n/a, maximum – n/a, close – n/a

The single currency against the general weakening of the American dollar is staying around its one-week high. From a low of 1.0711, the pair has bounced by 45 degrees. As I’ve already written above, the reason for the fall in the dollar is unclear given that US bond yields continue to rise. We should be seeing either a reduction in bond yields, or the dollar strengthening. This irregularity may be down to Trump.

Over three days of trading, a resistance for the euro has formed at 1.0775. For today and yesterday, cyclical analysis indicates a weakening of the euro. On the cross the single currency will fall, and its pairing with the American dollar is showing a sideways trend.

As for the resistance, everything is clear. The supports are at 1.0715 (45 degrees), 1.0700 (bottom channel line) and 1.0690 (67 degrees). Today I’m not making a forecast. If the situation becomes clearer, then I’ll revise it within a day. The merchant ratio for this pair stands at 72%. As you all know, the market is moving against the crowd, and if it declines, it won’t be very profitable for merchants.

Real Leadership Requires True Globalization

By Dan Steinbock

After 2008, world trade, investment and migration have come to a standstill. What the world requires is responsible leadership, which rests on inclusive globalization.

During his first state visit to Switzerland and the World Economic Forum (WEF), President Xi Jinping hoped to inject a positive impetus for the recovery of the world economy.

Amidst rising economic uncertainty and market volatility, Xi offered China’s vision on economic growth and free trade in a global economy overshadowed by protectionism.

The old path of globalization led by advanced economies, which are now turning inward, no longer works – as evidenced by the dire state of current global economic integration.

From slowdowns to elevated negative risks

Globalization can be measured by world trade, investment and migration. By the 1870s, capital and trade flows rapidly became substantial, driven by falling transport costs. However, this first wave of globalization was reversed by the retreat of the US and Europe into nationalism and protectionism between 1914 and 1945.

After World War II, trade barriers came down, and transport costs continued to fall. As foreign direct investment (FDI) and international trade returned to the pre-1914 levels, globalization was fueled by Western Europe followed by the rise of Japan. This second wave of globalization benefited mainly the advanced economies.

After 1980 many developing countries broke into world markets for manufactured goods and services, while they were also able to attract foreign capital. This era of globalization peaked around China’s membership in the World Trade Organization (WTO) in 2001 and the global recession in 2008. During the global financial crisis, China and large emerging economies fueled the international economy, which was thus spared from a global depression.

But as the G20 cooperation has dimmed, so have global growth prospects, too. With the incoming Trump administration in the US, the downside risks have grown elevated, as even the International Monetary Fund (IMF) has recently warned.

Stagnating world investment

Before the global crisis, world investment soared to almost $2 trillion. But those days have been gone, for almost a decade. In 2016, global FDI flows are expected to decline by 10–15%, reflecting the fragility of global economy, continued weakness of demand, sluggish growth in commodity exporting countries, and a slump in multinational companies’ profits.

According to the UN, global FDI flows are projected to resume growth in 2017 and to surpass $1.8 trillion in 2018 over the medium-term. Yet, such projections remain almost 10% below the pre-crisis peak.

In advanced economies, FDI activity seemed to recover in 2015. But as the upturn is unlikely to be sustained, the sentiment is turning less optimistic. In the West, large emerging economies have recently portrayed as yesterday’s promises, yet FDI flows to BRICs economies could return to growth, increasing by some 10%.

In the current landscape, the only bright spots are large emerging economies and developing nations that are the last to industrialize.

Plunging world trade

If the state of world investment is bad, that of world trade is worse. World export volumes reached a plateau already in early 2015, in both advanced and emerging economies.

In 2008, when the advanced economies led by the US could no longer contain the global financial crisis, large emerging economies joined the G20 to contain the crisis. At the time, the leaders of major advanced economies (G7) pledged to accelerate governance reforms in multilateral international organizations.

However, as advanced economies enjoyed a brief recovery, thanks to huge stimulus packages and more debt, those pledges were largely ignored. Instead, advanced countries have sought to overcome stagnation through ultra-low interest rates and rounds of quantitative easing.

At the same time, protectionism has returned to world trade. In 2015, protectionism was 50% up from the previous year, while policy initiatives harming foreign commercial interests outnumbered trade liberalization by three-to-one.
Since the collapse of the Soviet Union, the world economy has not seen such a long trade slump, except during global recessions.

From geopolitical friction to migration crises

After advanced West took greater control of migration in early 20th century, global migration – the third leg of globalization – has shrunk dramatically. Yet, the number of globally displaced has exploded.

After the terrorist attacks of 9/11 in 2001, the subsequent US-led wars in Afghanistan and Iraq, the West’s interventions in North Africa and the Middle East and elsewhere, wars and persecution have driven more than 65 million people from their homes. It is the greatest global forced displacement since 1945.

Despite international media focus on migration burden in Europe and the United States, the simple reality is that in 2015 developing regions – not advanced regions – hosted 86% of the world’s refugees under UN mandate. Moreover, the top-hosts of the globally displaced do not feature the US, Germany or the UK, but Turkey (2.5 million), Pakistan (1.6m), Lebanon (1.1m), Iran (0.8m), Ethiopia (0.7m) and Jordan (0.7m).

The wealthy nations do not host the “wretched of the earth.” Rather, it is the wretched who struggle to host even more wretched.

Ominous footprints

In the past, world investment, trade and migration habitually picked up as recessions ended. Today, that is no longer the case.

In 2017, the Trump tariffs will pave way to greater protectionism, which could be supported by several elections in Europe. Moreover, the supportive effect of world trade and investment could deteriorate further as tit-for-tat retaliation scenarios are likely to ensue.

The footprints are dark. In the 1930s, the Smoot-Hawley Tariff Act in the US undermined a fragile recovery and paved the way for international disorder. At Davos, President Xi likened protectionism to “locking oneself in a dark room” in the hopes of protecting oneself from danger; yet in so doing, cutting off all “light and air.” The result is a trade war in which “no one will emerge as a winner.”

What the world needs today is responsible leadership, say WEF leaders at Davos. That is not possible without truly inclusive global economic integration, which, in turn, is not viable without broader, deeper and faster global governance reforms and purposeful cooperation by the G20 and other international multilateral organizations.

Globalization must not serve just a few wealthy advanced economies, which no longer fuel global economy. It must also serve poorer and faster-growing emerging and developing economies, which today account for global growth.

About the Author:

Dr Steinbock is the founder of Difference Group and has served as research director at the India, China and America Institute (USA) and visiting fellow at the Shanghai Institutes for International Studies (China) and the EU Center (Singapore). For more, see http://www.differencegroup.net/

The commentary was originally published by China Daily on January 19, 2017.