Author Archive for InvestMacro – Page 576

EUR/USD long at 1.0780, USDCAD short at 1.3370

By GrowthAces.com

EUR/USD: Fed will remove accommodation patiently and gradually

Macroeconomic overview: Fed Governor Jerome Powell said the impact of the new Trump administration’s effect on the economy remains too uncertain for the U.S. Federal Reserve to react or begin recasting its outlook.

Asked about the collapse of the healthcare bill last week, Powell said that uncertainty about “the scope, the timing and the contents” of President Donald Trump’s policies were making it difficult for Fed policymakers to assess what they might mean.

Powell added: “It is appropriate we stay on this path to gradually raise interest rates. March was a good time… There will be scope for more.”

Kansas City Federal Reserve President Esther George said she needs to see more details on the Trump administration’s fiscal proposals before factoring them into her economic forecasts.

U.S. Federal Reserve Vice Chair Stanley Fischer that two more rate hikes this year seemed about right.

Dallas Federal Reserve Bank President Robert Kaplan said the Fed should be careful not to jolt the economy with aggressive rates hikes. He added: “I think it would be healthy to remove accommodation… patiently and gradually.”

The Conference Board said U.S. consumer confidence index hit 125.6 in March, surpassing expectations for a reading of 114, and much higher than 116.1 in February. The March level marked the highest since December 2000. The data pushed up U.S. Treasury yields and supported the USD.

European Central Bank Governing Council member Jan Smets said that hawkish views are reflecting a “minority position”. This is an important comment given the comments from other ECB members of late especially those from Mersch and Nowotny. In February ECB Executive Board member Mersch indicated a desire for the ECB to adjust its forward guidance on rates in its communication. Then, earlier this month, ECB’s Nowotny said that the ECB will only decide later whether to raise rates before or after QE stops. These comments from Mersch and Nowotny cast doubt and helped fuel an expectation that the ECB could announce a change in forward guidance. The ECB’s current forward guidance is that rates will remain “at present or lower levels” for an “extended period of time” and “well past the horizon” of net asset purchases. Our own expectation is for the ECB to drop the reference to “or lower” in its forward guidance in June and to announce a tapering of QE at the October ECB meeting.

Smets comment does little to help clear the uncertainty over the speed at which the ECB wants to move toward the exit. Core inflation has yet to rebound strongly and is likely to play an important role. Progress is still needed on Draghi’s criteria that an improvement in inflation should be over the medium term, any rise should be durable, self-sustainable, and for the whole of Eurozone. It is likely that Draghi will at the next meeting on April 27 provide greater clarity and the position of the ECB majority.

It is likely that Draghi will leave sufficient wiggle room for a change in forward guidance while sticking to the current script that current policy will remain in place until the end of the year, as well as reiterate current forward guidance. However, following the March meeting there was a dilution of the forward guidance language from Draghi who said that the “present or lower level” is an expectation, and that the probability of this expectation has gone down.

It is likely that at the June meeting the probability of an expectation that rates will remain at “present or lower levels” will have adjusted sufficiently to promote an adjustment in communication. This should help please the hawks and not displease the doves as the latter will still find comfort in that current policy will remain in play until end-2017. The debate over an ECB exit is likely to help support EUR/USD.

Technical analysis: In line with our expectations, we see some corrective moves on the EUR/USD. We think that the rate is likely to fall near 14-day exponential moving average, currently at 1.0753. Long-term charts remains bullish.

EURUSD Daily Forex Signals Chart

Short-term signal: We think that the reaction to stronger U.S. consumer confidence data could be a good opportunity to buy EUR/USD, as medium-term outlook has not changed. We have opened EUR/USD long at 1.0780 for 1.0960.

Long-term outlook: We stay long for 1.1125.


USD/CAD: Loonie supported by oil prices rise

Macroeconomic overview: The CAD hung in with a broadly stronger USD, helped by rising prices for oil, a major Canadian export, as the Bank of Canada stuck to its cautious tone.

Oil prices on Wednesday extended gains from the previous session, lifted by supply disruptions in Libya and expectations that an OPEC-led output reduction will be extended into the second half of the year.

Oil production from the western Libyan fields of Sharara and Wafa has been blocked by armed protesters, reducing output by 252k barrels per day.

Iranian Oil Minister Bijan Zanganeh said that a global oil cuts deal is likely to be extended, but that time is needed to discuss the subject thoroughly first. Asked whether Iran would be ready to cut its own output under the possible extension, Zanganeh said: “I think it is necessary that all members comply with their commitments.” The OPEC, along with some other producers including Russia, have agreed to cut production by almost 1.8 million bpd during the first half of the year in order to rein in a global fuel supply overhang and prop up prices.

Bank of Canada Governor Stephen Poloz said Canada’s economy has a lot more room to grow, with higher unemployment and more excess capacity than the United States, and if interest rates were raised today Canada would tip into recession. Poloz defended the bank’s dovish outlook – which contrasts with the U.S. Federal Reserve’s hike earlier this month and plan for more – in the face of recent stronger-than-expected growth in jobs, GDP and retail sales. Canada is due to report GDP data for January on Friday.

Technical analysis: The USD/CAD has not managed to close above the 23.6% fibo of January-March rise. The technical analysis does not provide a clear signal, but a recovery in oil prices suggest that downward move is more likely now.

USDCAD Daily Forex Signals Chart

Short-term signal: We have opened a short position at 1.3370. Our target is at 1.3260

Long-term outlook: Long-term target of our short position is 1.3100.


GBP/USD: We closed all GBP positions in the run up to Brexit

Macroeconomic overview: The GBP/USD is under pressure as investors braced for British Prime Minister Theresa May’s move later on Wednesday to formally file paperwork to leave the European Union.

Investors were also assessing news that Scotland’s parliament had backed a vote for independence even though the British government said it would not enter independence negotiations with Scotland.

Further weighing on the pound, Bank of England interest rate-setter Ian McCafferty highlighted a weak outlook for the economy on Tuesday, and said he did not know if he would vote to increase borrowing costs at the next BoE meeting in May.

Technical analysis: The GBP/USD continues to pullback in the daily cloud, the base is at 1.2356. 50% fibo support of the March rise at 1.2361 is just ahead. Technical analysis suggests further GBP/USD fall, but these suggestions will be overshadowed by Brexit news.

GBPUSD Daily Forex Signals Chart

Short-term signal: We have closed all our GBP positions today due to high uncertainty in the run up to Brexit . The GBP/USD long hit the stop-loss at 1.2400. We closed EUR/GBP long at 0.8690 with a smaller profit than initially planned.

Long-term outlook: We stay sideways on all GBP pairs.


TRADING STRATEGIES SUMMARY:

FOREX – MAJOR PAIRS:

Please enable images to upload to view this email properly

FOREX – MAJOR CROSSES:

Please enable images to upload to view this email properly

PRECIOUS METALS:

Please enable images to upload to view this email properly

It is usually reasonable to divide your portfolio into two parts: the core investment part and the satellite speculative part. The core part is the one you would want to make profit with in the long term thanks to the long-term trend in price changes. Such an approach is a clear investment as you are bound to keep your position opened for a considerable amount of time in order to realize the profit. The speculative part is quite the contrary. You would open a speculative position with short-term gains in your mind and with the awareness that even though potentially more profitable than investments, speculation is also way more risky. In typical circumstances investments should account for 60-90% of your portfolio, the rest being speculative positions. This way, you may enjoy a possibly higher rate of return than in the case of putting all of your money into investment positions and at the same time you may not have to be afraid of severe losses in the short-term.

How to read these tables?

1. Support/Resistance – three closest important support/resistance levels
2. Position/Trading Idea:
BUY/SELL – It means we are looking to open LONG/SHORT position at the Entry Price. If the order is filled we will set the suggested Target and Stop-loss level.
LONG/SHORT – It means we have already taken this position at the Entry Price and expect the rate to go up/down to the Target level.
3. Stop-Loss/Profit Locked In – Sometimes we move the stop-loss level above (in case of LONG) or below (in case of SHORT) the Entry price. This means that we have locked in profit on this position.
4. Risk Factor – green “*” means high level of confidence (low level of uncertainty), grey “**” means medium level of confidence, red “***” means low level of confidence (high level of uncertainty)
5. Position Size (forex)– position size suggested for a USD 10,000 trading account in mini lots. You can calculate your position size as follows: (your account size in USD / USD 10,000) * (our position size). You should always round the result down. For example, if the result was 2.671, your position size should be 2 mini lots. This would be a great tool for your risk management!
Position size (precious metals) – position size suggested for a USD 10,000 trading account in units. You can calculate your position size as follows: (your account size in USD / USD 10,000) * (our position size).
6. Profit/Loss on recently closed position (forex) – is the amount of pips we have earned/lost on recently closed position. The amount in USD is calculated on the assumption of suggested position size for USD 10,000 trading account.
Profit/Loss on recently closed position (precious metals) – is profit/loss we have earned/lost per unit on recently closed position. The amount in USD is calculated on the assumption of suggested position size for USD 10,000 trading account.
About the Author:

By GrowthAces.com – Daily Forex Trading Strategies


Wealth Minerals Ltd, Hottest Salar in Chile

By Peter Epstein, CFA, MBA    [email protected]    Epstein Research

In this article I discuss a Lithium (“Li”) junior that has successfully locked down, via option agreements, several key lithium properties / projects in Chile (mgmt. still looking for more) and owns or controls 4 precious / base metal projects in Mexico, Peru & Canada.  Each of the Company’s assets is good to very good, but my focus is on the crown jewel.  On March 17, Wealth Minerals [TSX-V: WML] / [OTCMRKTS: WMLLF] delivered a NI 43-101 Technical Report (the “Report“) on its optioned Proyecto Atacama Lithium (“PAL”) project in the northern part of the Salar de Atacama (the “Salar“), located ~220 km east of the Chilean city of Antofagasta.  The Salar itself is the largest in Chile and 3rd largest in the world, measuring about 85 x 50 km = 4,250 sq. km.  The Report represents an important milestone in the Company’s early-stage Li exploration activities.  {See Corporate Presentation}

For non-experts, like myself, in hydrology / hydrodynamics, chemistry, geochemistry, geology, hydrogeology, volcanology, stratigraphy, etc., I’ve condensed roughly 10,000 words, maps, charts, images & schematics into a few key takeaways.

Wealth Minerals’ NI 43-101 Technical Report… in Under 500 Words

Wealth’s exclusive option on a 100% royalty-free Interest in, and to, the PAL project in Chile consists of 144 exploration mining concessions covering 46,200 hectares (~114,160 acres = 462 sq. km / 178 sq. miles) in the northern part of the Salar.  The PAL project abuts claims held by SQM [NYSE: SQM] & Albemarle Corp’s [NYSE: ALB], subsidiary Rockwood Lithium, roughly 30 km & 50 km north, respectively, of those companies’ world-class operations.  NOTE:  {46,200 contiguous hectares is a huge land position, larger than that of any other (entire) salar in Chile}.

The principal origin of lithium is interpreted to be surface & subsurface lithium-bearing geothermal waters from the El Tatio Geyser Field situated north of the Salar, flowing south onto concessions controlled by Wealth Minerals Chile, (“WMC”), then onto SQM’s / Albemarle’s concessions & production facilities.  The chemistry of the brines in the south is said to be, “almost identical” to that of the geothermal fluids of El Tatio, strongly suggesting those mobilized fluids are the main source of lithium & potassium (“K”) in the Salar.  From the Technical Report, Section 6.0, page 18,

“….because there’s been Li & potassium production from brines located in the southern part of the Salar, and because there has been significant development of deep water sources for nearby mining activities (copper mines Escondida & Zaldivar, among others), significant studies of the geology, hydrogeology and natural resources are available for the region.  These regional studies have been carried out by several third-party private companies and by Chilean agencies.  As well, numerous cooperative assessments of geology and hydrogeology have been carried out by international scientific agencies.”

Whereas SQM & Albemarle are harvesting near-surface brines, WMC’s target zone is in subsurface aquifers several hundred meters deep.  NOTE:  {the company’s goal is to identify similar brine chemistry at depth, as that of nearer-surface brines being extracted 30-50 km to the south.}  There has been no exploration whatsoever for Lithium on the northern part of the Salar, including the PAL project.  WMC’s Technical Report offers 10 recommendations for a Phase 1 exploration program;

i) consultation with a geophysical contractor, ii) confirm methodology, iii) consider the use of Time Domain EM, iv) determine sedimentary regime, v) consider gravity survey to determine basin configuration, vi) consider Magneto Telluric methodology for deep target evaluation, vii) conduct geophysical programs, viii) initiate community relations programs, ix) prepare reports & analysis to develop drill targets and x) permit & drill 5 test holes.

The above mention steps are estimated to cost just $550k.  The Report’s author concluded that although the PAL project is early-stage, exploration for lithium resources is warranted for the following reasons, section 1.0, page 5;

“1)  Lithium-rich brines produced in the northern part of the Salar flow to the south, across the PAL project.  2)  Sustained production of lithium, potassium & byproducts has occurred in the Salar since the 1970’s from properties contiguous to the PAL project.  3)  Regional and multidisciplinary studies by several companies and government agencies have confirmed the similarity of geology and hydrogeology of the northern and southern parts of the Salar.  4)  Although not necessarily an indication of brine potential, surface sampling of sediment & surface waters returned anomalous lithium concentrations.”

Who Will Survive Inevitable Industry Shakeout? 

Above is a comparison chart of well known South American salars.  NOTE:  {the metrics associated with “Salar de Atacama” are those of known producers SQM & Albemarle, there’s been no exploration on WMC’s concessions}.

Wealth Minerals has locked up a very large block of contiguous exploration concessions in northern Chile, host to the undisputed lowest-cost lithium (brine, hard rock or clay) operations in the world.  There are at least 18 publicly-listed, pre-production Li juniors with property or project interests in Argentina.  There are just 4, (2 of which Bearing Resources [TSX-V: BRZ] and Lithium Power Intl. [ASX: LPI] are partners on the same project), focusing on Chile.  LiCo Energy [TSX-V: LIC] is another junior in Chile with an option on exploitation concessions (plus it has significant Li assets in Nevada and promising cobalt assets in Canada).  Both countries will be top 3 or 4 Li suppliers.  The question is, which juniors will break into the ranks of SQM, Albemarle & FMC Corp. [NYSE: FMC] in South America’s Lithium Triangle?

There are several contending projects in Argentina, most notably Lithium America’s [TSX: LAC]& SQM’s joint venture Cauchari-Olaroz project in Jujuy Province and Galaxy Resources’ [ASX:GXY] Sal de Vida project in Salar del Hombre Muerto.  As mentioned, the race is on among over a dozen other new entrants there.  By contrast, if one believes as I do that new producer(s) will emerge in Chile, then Wealth Minerals’ PAL, Lithium Power’s/Bearing Resources’ Maricunga and LiCo Energy’s Purickuta (located in the same Salar de Atacama) projects are virtually the only games in town(among publicly-listed companies).

The Report explains lithium production methodology at active production sites on the Atacama Salar in section 7.3, page 23:

“The production method utilized by SQM and Rockwood is: lithium-containing brine is pumped out of the lithium-potassium-bearing brine aquifer into evaporation ponds, where it’s concentrated by evaporation. The brine is further purified on its way through the system by continued evaporation, when the brine is pumped through a cascade of ponds where impurities or by-products are crystallized and removed. Main by-products are potash for the fertilizer industry and bischofite used for road paving. During the evaporation process, the lithium concentration is increased from about 2,000 ppm to up to 60,000 ppm (6%) in the final brine. The final brine is transported to a processing plant for further purification and processing to yield lithium carbonate and lithium chloride.”

Of the three, the scale of Wealth Minerals’ flagship project really stands out at 46,200 hectares, (114,160 acres).  If the Company is successful in identifying high-grade Li & K, with acceptable levels of deleterious elements, there would be the real possibility of a large production profile.  That remains to be seen, there’s no proof (just theory) that Wealth’s optioned property contains potentially economic brines.

But, the theory seems a good one for the reasons laid out in the NI 43-101 Technical Report.  Could there possibly be a better location on the planet to explore for concentrated Li-bearing brines?  To reiterate, the concessions are just 30-50 km north of Albemarle & SQM’s operations (lowest cost in the world).  Geologically speaking, in the context of aquifers, that distance is small.  Investors in Li juniors have likely already picked a few Argentina plays, Chile should not be ignored.  I believe that Wealth Minerals [TSX-V: WML] / [OTCMRKTS: WMLLF] offers a compelling investment proposition, well worth readers further attention.  {See Corporate Presentation}

Disclosures:  The content of this article is for informational purposes only.  Readers fully understand and agree that nothing contained herein, written by Peter Epstein of Epstein Research[ER] including but not limited to, commentary, opinions, views, assumptions, reported facts, estimates, calculations, etc. is to be considered, in any way whatsoever, implicit or explicit investment advice. Further, nothing contained herein is a recommendation or solicitation to buy or sell any security.  Mr. Epstein and [ER] are not responsible, under any circumstances whatsoever, for investment actions taken by a reader. Mr. Epstein and [ER] have never been, and are not currently, a registered or licensed financial/investment advisor, broker/dealer, stockbroker, trader, money manager, compliance or legal officer, and they do not perform market making activities. Mr. Epstein and [ER] are not directly employed by any company, group, organization, party or person. Shares of Wealth Minerals are highly speculative.  Readers understand and agree that investments in small cap stocks can result in a 100% loss of invested funds. It is assumed and agreed upon by readers that they consult with their own licensed or registered financial advisors before making investment decisions.

At the time this article was posted, Peter Epstein owned shares and/or stock options in Wealth Minerals and the Company was a sponsor of [ER].  Readers understand and agree that they must conduct their own research, above and beyond reading this article. While the author believes he’s diligent in screening out companies that are unattractive investment opportunities, he cannot guarantee that his efforts will (or have been) successful. Mr. Epstein & [ER] are not responsible for any perceived, or actual, errors, including but not limited to, commentary, opinions, views, assumptions, reported facts & financial calculations, or for the completeness of this article. Mr. Epstein & [ER] are not expected or required to subsequently follow or cover events & news, or write about any particular company or topic. Mr. Epstein and [ER] are not experts in any company, industry sector or investment topic.

What A Westinghouse Bankruptcy Could Mean For U.S. Utilities

By OilPrice.com

International news services now report that Japan’s Toshiba Corporation (9502.T) is preparing to make a chapter 11 bankruptcy filing for its Westinghouse Electric subsidiary as soon as this Monday, March 27. For most of our readers this news evokes little surprise. This is merely another chapter of a slow moving financial and accounting train wreck involving nuclear design and construction firm Westinghouse and its troubled Japanese parent, Toshiba. But like an old, leaky garbage scow there is much to clean up in its wake.

The two U.S. utilities with the most at risk are Southern Company and SCANA Corp. Westinghouse is presently constructing two unit, AP 1000 nuclear power stations for each utility. These projects are over-budget and behind schedule. It appears that Westinghouse offered both utilities a fixed price contract for these new nuclear plants. Our best guess is that this fixed price construction guarantee has doomed Westinghouse and prevented other potentially willing buyers from stepping in. No one it seems is willing to take on this seemingly open-ended nuclear construction liability.

What does this mean for the two domestic utilities embroiled in this international financial quagmire?

First, we expect that they will complete both nuclear construction projects. The bulk of heavy capital expenditures for both utilities seem to be in the 2017-2019 period.

Second, it is in all interest of all potential litigants to see these plants completed. Westinghouse/Toshiba, for one, would at least get to showcase the AP 1000 design and its successor entity could advocate for additional sales of this reactor design. A working design has value. (What happens in the UK is another matter where Toshiba hoped to build several plants). The utilities, which need new power stations, get large, rate based, non-fossil base load power generating resources for the next 40-60 years.

The worst case scenario for utility investors would be if the utilities had to cancel the projects and take big write offs. But we assign a very low probability to this scenario.

Perhaps, more likely, a Westinghouse bankruptcy means abrogation of the fixed price contracts signed with Southern and SCANA. News reports this week indicated that both utilities had hired bankruptcy counsel.

As these plants are brought on line, presumably in the 2020-2021 time frame, the matter will go before the state utility commissions of Georgia and South Carolina. Both commissions approved these nuclear projects. It’s just that the plants will cost more than expected.

Unfortunately for investors, they will have to live with uncertainty until the regulators make their decisions. There are no clear precedents for the decisions, other than that commissions typically allocate or split unexpected financial burdens like these between shareholders and consumers. And that the amounts at risk won’t be modest given the size of the projects.

Link to original article: http://oilprice.com/Latest-Energy-News/World-News/What-A-Westinghouse-Bankruptcy-Could-Mean-For-US-Utilities5507.html

By Leonard Hyman and Bill Tilles for Oilprice.com


Japanese Candlesticks Analysis 28.03.2017 (EUR/USD, USD/JPY)

Article By RoboForex.com

EUR USD, “Euro vs. US Dollar”

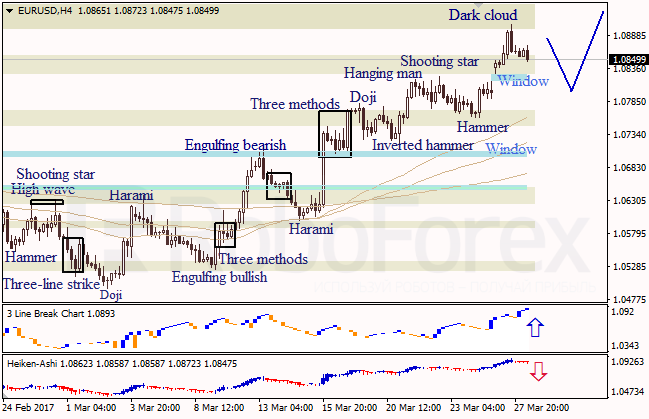
At the H4 chart of EUR USD, bearish Dark Cloud pattern indicates a descending correction. A new Window remains open. Three Line Break chart shows a bullish direction; Heiken Ashi candlesticks confirm the descending correction.

At the H1 chart of EUR USD, bearish Harami pattern indicated a descending correction. The upside Window is a support level. Three Line Break chart and Heiken Ashi candlesticks confirm a bearish direction.


USD JPY, “US Dollar vs. Japanese Yen”

At the H4 chart of USD JPY, Engulfing Bullish pattern indicates an ascending correction. Three Line Break chart shows a bearish direction; Heiken Ashi candlesticks confirm an ascending movement.


RoboForex Analytical Department

Article By RoboForex.com

Attention!
Forecasts presented in this section only reflect the author’s private opinion and should not be considered as guidance for trading. RoboForex LP bears no responsibility for trading results based on trading recommendations described in these analytical reviews.

EUR/USD: Dollar steadied after comments from Fed

By GrowthAces.com

Macroeconomic overview: Dallas Federal Reserve Bank President Robert Kaplan said on Monday that he would support further interest rate hikes if the U.S. economy takes more steps toward reaching the Fed’s goals of full employment and 2% inflation. Kaplan, who votes this year on Fed policy, repeated his view that the economy will likely grow about 2.25% this year, but could grow faster, or more slowly, depending in part on the policies the new administration implements. With government debt rising, reform of entitlement programs such as Medicare and Social Security must be on the table, he said.

Chicago Fed President Charles Evans said that the case for four interest rate hikes in the United States this year is not yet solid and would require a stronger lift in inflation. Evans said he saw three rate hikes in 2017 as “plausible”, but added that two or four increases were also a possibility. In his opinion long-term inflation expectations may still be running below the U.S. Federal Reserve’s target of 2%, though in the shorter term prices are rising towards that figure. Evans said he did not expect core inflation, which strips out volatile elements like energy prices, would reach the 2% target until 2019.

The dollar steadied on Tuesday after its worst week since U.S. President Donald Trump’s election in November, promises of more rises in Federal Reserve interest rates this year helping it recover from multi-month lows in still shaky global markets.

Technical analysis: The EUR/USD managed to close above 1.0825 (38.2% retrace of May-January fall), which means that 1.0976 (50%) is unmasked. Tenkan line is pointing north, indicative of positive momentum. The 7-day exponential moving average is positively aligned.

EURUSD Daily Forex Signals Chart

Short-term signal: We are looking to buy EUR at 1.0780. Our next short-term target will be 1.0960, just below 50% fibo of May-January drop.

Long-term outlook: Long-term target is 1.1125.


USD/CAD: Near-term outlook is unclear, all eyes on Poloz today

Macroeconomic overview: The Canadian dollar was little changed on Monday against its U.S. counterpart as lower oil prices offset broadbased losses for the greenback. Investors are focused on a today’s speech by Bank of Canada Governor Stephen Poloz. He is likely to be asked about the recent better-than-expected economic performance in Canada.

Canada’s annual inflation hit the central bank’s 2.0% target in February for the second month in a row, but closely watched core measures remained tame, indicating little pressure for a rate hike. The market had expected inflation to remain at 2.1%.

Earlier this month, the Bank of Canada said it was looking past what it called the temporary impact of higher energy prices, noting that muted underlying inflation continued to point to material excess capacity. Of the three new core inflation measures, CPI common, which the central bank says is the best gauge of the economy’s underperformance, was furthest away from target, remaining at 1.3%. CPI median, which shows the median inflation rate across CPI components, remained at 1.9%, while CPI trim, which excludes upside and downside outliers, slipped to 1.6% from 1.7%.

We expect the next move of the Bank of Canada will be a hike in the second quarter of 2018

Technical analysis: The USD/CAD did not manage to break below support at 38.2% fibo of January-March rise and is testing the resistance at 23.6% fibo of that move now. The technical analysis does not provide a clear signal for now, but a close above 1.3399 will support USD/CAD bulls.

USDCAD Daily Forex Signals Chart

Short-term signal: Small profit taken on USD/CAD short after the rate hit the lowered stop-loss level at 1.3410. We stay sideways now.

Long-term outlook: In our opinion long-term outlook is slightly bearish, given improving fundamentals of Canadian economy. But there is still a risk of upward move in the near term.


TRADING STRATEGIES SUMMARY:

FOREX – MAJOR PAIRS:

Please enable images to upload to view this email properly

FOREX – MAJOR CROSSES:

Please enable images to upload to view this email properly

PRECIOUS METALS:

Please enable images to upload to view this email properly

It is usually reasonable to divide your portfolio into two parts: the core investment part and the satellite speculative part. The core part is the one you would want to make profit with in the long term thanks to the long-term trend in price changes. Such an approach is a clear investment as you are bound to keep your position opened for a considerable amount of time in order to realize the profit. The speculative part is quite the contrary. You would open a speculative position with short-term gains in your mind and with the awareness that even though potentially more profitable than investments, speculation is also way more risky. In typical circumstances investments should account for 60-90% of your portfolio, the rest being speculative positions. This way, you may enjoy a possibly higher rate of return than in the case of putting all of your money into investment positions and at the same time you may not have to be afraid of severe losses in the short-term.

How to read these tables?

1. Support/Resistance – three closest important support/resistance levels
2. Position/Trading Idea:
BUY/SELL – It means we are looking to open LONG/SHORT position at the Entry Price. If the order is filled we will set the suggested Target and Stop-loss level.
LONG/SHORT – It means we have already taken this position at the Entry Price and expect the rate to go up/down to the Target level.
3. Stop-Loss/Profit Locked In – Sometimes we move the stop-loss level above (in case of LONG) or below (in case of SHORT) the Entry price. This means that we have locked in profit on this position.
4. Risk Factor – green “*” means high level of confidence (low level of uncertainty), grey “**” means medium level of confidence, red “***” means low level of confidence (high level of uncertainty)
5. Position Size (forex)– position size suggested for a USD 10,000 trading account in mini lots. You can calculate your position size as follows: (your account size in USD / USD 10,000) * (our position size). You should always round the result down. For example, if the result was 2.671, your position size should be 2 mini lots. This would be a great tool for your risk management!
Position size (precious metals) – position size suggested for a USD 10,000 trading account in units. You can calculate your position size as follows: (your account size in USD / USD 10,000) * (our position size).
6. Profit/Loss on recently closed position (forex) – is the amount of pips we have earned/lost on recently closed position. The amount in USD is calculated on the assumption of suggested position size for USD 10,000 trading account.
Profit/Loss on recently closed position (precious metals) – is profit/loss we have earned/lost per unit on recently closed position. The amount in USD is calculated on the assumption of suggested position size for USD 10,000 trading account.
About the Author:

By GrowthAces.com – Daily Forex Trading Strategies


Forex Technical Analysis & Forecast 28.03.2017 (EUR/USD, GBP/USD, USD/CHF, USD/JPY, AUD/USD, USD/RUB, GOLD, BRENT)

Article By RoboForex.com

EUR USD, “Euro vs US Dollar”

The EUR/USD pair is growing towards 1.0914. Possibly, the price may be corrected to test 1.0836 from above and then continue moving upwards with the target at 1.0914. Later, in our opinion, the market may form another correction to reach 1.0836 and then continue its growth towards 1.0954. This growth is considered only as an alternative scenario.


GBP USD, “Great Britain Pound vs US Dollar”

The GBP/USD pair is growing to reach 1.2654. Possibly, today the price may be corrected towards 1.2537 and then start growing to reach the local target. After that, the instrument may fall with the target at 1.2537.


USD CHF, “US Dollar vs Swiss Franc”

The USD/CHF pair is moving downwards. Possibly, today the price may be corrected towards 0.9885. Later, in our opinion, the market may reach 0.9775 and then resume moving upwards with the target at 0.9885.


USD JPY, “US Dollar vs Japanese Yen”

The USD/JPY pair is falling; it has formed the ascending impulse, but it’s not strong enough to continue. Possibly, today the price may reach 110.00 and then grow towards 110.74. After that, the instrument may fall with the target at 109.90.


AUD USD, “Australian Dollar vs US Dollar”

The AUD/USD pair is forming the forming the fifth descending wave with the target at 0.7541. Possibly, today the price may fall towards 0.7595 and then start consolidating. After breaking this range to the downside, the market may reach 0.7550.


USD RUB, “US Dollar vs Russian Ruble”

Being under pressure, the USD/RUB pair is falling. Possibly, today the price may move to reach 57.45. After that, the instrument may continue falling with the target at 55.50.


XAU USD, “Gold vs US Dollar”

Being under pressure, Gold is trading to the upside. Possibly, today the price may complete the correction at 1251.60. Later, in our opinion, the market may grow towards 1262.60 and then continue falling with the target at 1230.00.


BRENT

Being under pressure, Brent is trading to break 51.15 downwards. The price is expected to continue moving upwards with the local target at 52.50. After that, the instrument may fall to reach 51.20 and then grow with the first target at 52.80.


RoboForex Analytical Department

Article By RoboForex.com

Attention!
Forecasts presented in this section only reflect the author’s private opinion and should not be considered as guidance for trading. RoboForex LP bears no responsibility for trading results based on trading recommendations described in these analytical reviews.

EUR/USD: rebound from the trend line

By Gabriel Ojimadu, Alpari

Previous:

Trading on the single currency closed up on Monday. Towards the end of the session, the Euro depreciated by 45 pips to 1.0861. The gap stayed closed, but after the correctional movement from 1.0906, a long shadow appeared on the candlestick.

Remember that the dollar’s slide was brought about by the new US administration’s failure to secure enough votes for their healthcare reform bill. Traders sold their Euros in a move that signals new doubt over the new president’s ability to deliver on the reforms he promised.

Market expectations:

So far in Asia, the exchange rate has renewed its session minimum of 1.0855. At the time of writing, the price has just rebounded from the trend line. The hourly indicators have unloaded, so I’m expecting the single currency to appreciate to 1.0895 in the first half of the day. I don’t see Monday’s maximum being renewed.

Day’s news (GMT+3):

  • 14:45 EU: ECB member Cœuré’s speech;
  • 15:30 USA: wholesale inventories (Feb);
  • 16:00 USA: S&P/Case-Shiller home prices indices (Jan);
  • 17:00 USA: consumer confidence (Mar), Richmond Fed manufacturing index (Feb);
  • 17:10 Canada: BoC governor Poloz’s speech;
  • 19:50 USA: Fed’s Yellen speech;
  • 20:00 USA: FOMC member Kaplan’s speech;
  • 23:30 USA: FOMC member Powell’s speech.

EURUSD rate on the hourly. Source: TradingView.

Intraday forecast: low: 1.0855 (current in Asia), high: 1.0895, close: 1.0874.

On Monday, the EUR/USD rate reached 1.0906 level. A correction began during the American session from around the 112-135 degree range. The downwards correction amounted to 45 pips. At this moment in time, there are grounds for a new rise in quotes.

Given that the hourly indicators have offloaded, my forecast is looking north. The target for buyers is 1.0895. I can’t see the price going any higher than that as the four-hour indicators haven’t unloaded. If we take a look at the weekly period, the rate has rebounded from the trend line, which takes its starting point from the top at 1.3994 (08/05/14). I don’t think that it’ll be broken through today.

There’s one other thing I must warn you about. Cyclical analysis points towards a strengthening Euro from 12:15 EET. Before this, we should see a minimum form. I ignored this in my forecast given that the price is perched on the trend line. If it gets broken through and the hourly candlestick closes below 1.0850, the potential for growth for the Euro disappears.

In our current situation, we must consider the possibility of a false breakthrough because the 38.2 Fibonacci level runs through 1.0850, projected from growth from 1.0760 to 1.0906. It’s also located below the trend line. So, if buyers can induce a rebound from the line, then a phase of depreciation should set in after 17:30 EET. The quicker quotes rise, the likelier yesterday’s maximum of 1.0906 will be reached.

Positives for the euro (+):

Fundamental:

(+) US president Donald Trump favours a weaker dollar;

(+) The threshold for acceptable US government debt of 20.1 trillion USD may be reached by March this year. This will create headaches for new US president Donald Trump. A new law on the debt ceiling came into force on the 16th of March 2017;

(+) The Greek government has made some progress in its talks with international creditors on the second stage of their reform program;

(+) Head of the ECB, Mario Draghi, has hinted that the central bank may not need to provide any further stimulus to revitalise Europe’s economy. From April to December 2017, the ECB will reduce their monthly assets purchases to 80 to 60 billion EUR;

(+) ECB bosses have discussed the possibility of raising interest rates before the QE program comes to an end;

(+) Ewald Nowotny, a member of the ECB’s governing council, has said that the bank could raise the deposit rate before the main refinancing rate;

(+) On the 24th of March, Donald Trump withdrew his proposed healthcare bill to replace Obamacare from the US Congress’ agenda;

(+) ECB member Lautenschläger warns that it’s time to prepare for a change in the bank’s policy;

Technical (short-term):

(+) According to data from 21/03/17, large speculators on the Chicago Exchange have significantly increased their long and decreased their short positions. Long positions have grown by 10,138 to 158,646 contracts, while short positions have fallen by 10,325 to 176,891 contracts. Net short positions have fallen from 38,707 to 18,245 contracts. Small speculators have increased their long positions by 3,811 to 65,280 contracts and short positions by 4,779 to 63,093 contracts. Net long positions have fallen from 3,158 to 2,178 contracts.

(+) Short/long ratio according to myfxbook as of 07:38 EET: 84%/15%, lots: 34751/6549 (previous day: 10206/2033), positions: 69240/22454 (previous day: 27422/7518);

(+) US 10-year bond yields: 2.380% (down 1.57% from 27/03/17);

(+) EURGBP (W):  the CCI (20), AO and AC are up;

(+) EURGBP (D): the AO and Stochastic (5,3,3) indicators are up. Bullish engulfing pattern;

(+) EURUSD (M): the Stochastic (5,3,3) is up;

(+) EURUSD (W): The Stochastic (5,3,3), AO, AC, and CCI (20) are up;

(+) EURUSD (D): the AO and Stochastic (5,3,3) indicators are up. The CCI (20) is trying to reverse upwards;

Negatives for the euro (-):

Fundamental:

(-) According to CME Group’s FedWatch Tool on Monday  the 27th of March, the probability of a rate hike in May has fallen from 6.4% to 4.3%, in June from 54% to 48.5% and in July from 60.8% to 56.1%;

(-) Political risks in Europe (French elections and Brexit);

(-) Fed member Evans is expecting 2-3 rate hikes in 2017. The Federal Reserve will make a decision about the next hike in June;

(-) President of the Philadelphia Fed, Harker, announced that the Federal Reserve will continue to gradually increase interest rates throughout 2017;

Technical factors (short-term):

(-) German 10-year bond yields: 0.402% (down 1.23% from 27/03/17);

(-) In Asia, US 10Y bond yields have grown by 0.06% to 2.376%;

(-) EURGBP (W): The Stochastic (5,3,3) is down;

(-) EURGBP (D): the AO and CCI (20) indicators are down;

(-) EURUSD (M): the AO and AC indicators are down;

(-) EURUSD (D): the AC indicator is down;

Built into the price:

(-)  The Ex-Prime Minister of France, Alain Juppe, has ruled himself out of participating in the presidential election;

(+) François Bayrou, leader of the “Democratic Movement” party, has ruled out running for the presidency and thrown his weight behind independent candidate Emmanuel Macron;

(+) Marine Le Pen has had her EU parliamentary immunity from prosecution lifted for political reasons.

Admiral Markets Appoints New Country Manager in Poland

By Admiral Markets

Admiral Markets announced that Adam Narczewski, a highly experienced industry professional, has accepted the post of Country Manager for Admiral Markets Poland, effective as of March 2017.

Mr. Narczewski has a vast experience in helping companies become industry leaders. Prior to joining Admiral Markets Poland, he served as Deputy Regional Director at X-Trade Brokers DM, where he was responsible for the growth of the largest region in the XTB group.

From an academic perspective, Mr. Narczewski earned a Bachelor’s Degree of Science (Finance) from Winthrop University, USA and is certified as a Chartered Financial Analyst, Professional Risk Manager and Investment Advisor.

A brief interview with Mr. Narczewski reveals more details about his future plans as Country Manager at Admiral Markets Poland, as well as a piece of advice for anyone interested in personal development.

1. How excited are you to be moving into the new Country Manager role at Admiral Markets Poland? What in particular are you most excited about?

I’m very excited to be joining a top international Forex & CFDs Broker. The values and goals of Admiral Markets, such as excellence, integrity, innovation  and continuous growth,  complement my own beliefs and make it a perfect place for me to grow with. I have been in the industry for many years, but I am always looking for new challenges. The Polish Forex & CFDs market has experienced enormous growth, but also changes in the last 10 years. There is still place to grow and I am really excited that I will be able to that along with the Admiral Markets team.

2. As the new Country Manager for Admiral Markets Poland, what are your plans for the coming year?

Poland has become a very competitive Forex and CFDs market. Many brokers, local and foreign, are offering their services to Polish clients. Admiral Markets has been present on the market for many years, working very hard to achieve a strong reputation among traders. We have certain unique features that distinguish our offer from the others. My goal is to exploit  this competitive advantage, by focusing on the optimisation of our education offer. My plan for Admiral Markets is to be listed among the top 3 forex brokers in Poland within the next 2 years.

3. Tell us about your leadership style and why you think it will help you be successful in this new position?

I believe in the potential of my team. I think people achieve their best when the goals are clear and everyone is looking in the same direction, but at the same time they have the independence to be creative. I’m here to support them and help them grow. Basically, I want to focus on empowering people to achieve their highest potential.

4. You’re a fan of active sports and also find time for reading, working and even managing your own personal blog. How do you juggle so many different activities?

I have been an active person since I can remember. I played tennis when I was younger and I went to college in the U.S to play in the NCAA. Nowadays, I try to stay fit by playing football and jogging. As you need to practice your muscles or strokes to become better at sports, you also need to exercise your brain to stay mentally fit. That is why I enjoy reading books and during my free time, I manage my own blog. My advice? You just need to manage your time wisely and avoid wasting it on browsing the internet or watching useless tv shows.

About Admiral Markets:

Admiral Markets is a leading online trading provider specialising in Forex and CFDs on stocks, indices, precious metals and energy. In addition to a wide range of financial instruments, Admiral Markets offers free educational materials, including analytics, webinars and seminars. For more information, please contact [email protected] or visit Admiral Markets’ website.


Managing Risk during Black Swan Type of events

By Adinah Brown

On January 15th, 2015, when the SNB suddenly decoupled the Euro from the Swiss Franc, perhaps unbeknownst to the SNB at the time, they released a torrential avalanche, where traders all over the world lost millions of dollars in a matter of moments. The EUR/CHF crash forced numerous forex brokers into insolvency in their inability to cover their client’s positions and stop losses were unable to catch the momentous fall causing devastating slippage. Within minutes trillions of dollars were wiped out of the financial markets, with little resources for the traders to call on, once the proverbial shit hit the global-market-fan. With incidents like these at the forefront of our mind, we consider a range of risk management techniques that would be effective at times of high volatility such as the infamous Black Swan event.

One of the most common techniques is the application of modern portfolio theory (MPT) where diversification is used to create groups of assets that are able to withstand volatility. This technique applies statistical measures to determine an efficient frontier for an expected amount of return in relation to a defined level of risk. Applying this theory involves examining the correlations between different assets and determining the volatility of those assets in order to create an optimum and well balanced portfolio. In the Black Swan event, financial institutions such as Alpari UK, were not applying the MPT theory to sufficiently manage their risk, undoubtedly causing their insolvency as a result of the plummeting value of the EUR/CHF.

Options are another valuable tool to manage risk during volatile periods. An investor who wishes to hedge a particular stock with reasonable liquidity can buy a put option to protect themselves against the risk of a downward movement. The option gains value as the price of the underlying security drops. However, the drawback to using an option is that its price will often go at a premium. Furthermore, an option is also subject to time decay as it loses value as time encroaches upon its expiry date. This strategy although effective, will only protect the individual stock that it’s being hedged against, an investor with diversified holdings will not be able to afford covering each of his positions with an option put.

Investors who want to hedge a larger portfolio of stocks should use index options. These broad based indexes track larger stock indexes such as the S&P 500 and Nasdaq which cut across many sectors and therefore their movements represent a good reflection of the overall economy. Historic charts have shown that stocks tend to be correlated, meaning that they generally move in the same direction, especially during periods of high volatility. By using index options an investor can hedge a diversified portfolio of stocks and hedge indexes with put options to minimize risk. Although doing this in a dooming period of volatility can also be expensive, at least this strategy provides protection across an entire portfolio.

Lastly, there is also the possibility to hedge using the volatility index indicator (VIX). This strategy measures the implied volatility of “at the money calls” and puts that are currently on the S&P500 index. Otherwise known as “the fear gauge”, it rises during periods where there is a lot of volatility. As a guide, a level below 20, indicates that the market is in low volatility, while a level above 30 indicates a highly volatile market. Investors also make use of exchange traded funds (ETFs) to track the VIX, ETF shares or options can go long on the VIX explicitly for the purpose of being used as a volatility specific hedge.

About the Author:

Adinah Brown is a professional writer who has worked in a wide range of industry settings, including corporate industry, government and non-government organizations. Within many of these positions, Adinah has provided skilled marketing and advertising services and is currently the Content Manager at Leverate.


Wave Analysis 24.03.2017 (EUR/USD, GBP/USD, USD/JPY, AUD/USD)

Article By RoboForex.com

EUR USD, “Euro vs US Dollar”

It’s highly likely that the EUR/USD pair is about to complete the wave 2 in the form of the double zigzag. Right now, the price is finishing the zigzag in the wave [y]. As a result, in the nearest future the market may form the bullish impulse in the wave v of (c) of [y].

More detailed structure is shown on the H1 chart. The pair completed the extended wave iii along with the correctional wave iv. Consequently, on Friday the market may break the high. To confirm a new decline, the price has to form the bearish impulse in the wave i.


GBP USD, “Great Britain Pound vs US Dollar”

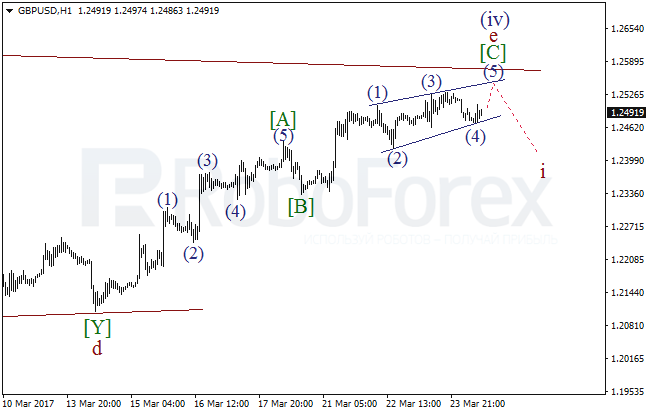
The GBP/USD pair is about to complete the horizontal triangle in the wave (iv). In the nearest future, the market may finish the wave e. If the price rebounds from the pattern’s upside border, it may start falling in the wave i.

At the H1 chart, the pair is forming the zigzag in the wave e of (iv). Possibly, the wave [C] of e is taking the form of the diagonal triangle. If the market rebounds from the triangle’s upside border, bears may try to reverse the pair to the downside.


USD JPY, “US Dollar vs Japanese Yen”

After finishing the double zigzag in the wave [x], the USD/JPY pair started falling in the wave (a). As a result, in the nearest future the market may be corrected in the wave (b), which may later be followed by a new decline in the wave (c) of [y].

More detailed structure of the descending impulse (a) is shown on the H1 chart. Possibly, the pair is finishing the fifth wave in the extended wave iii. Consequently, after breaking the local low, the market may start a local ascending correction.


AUD USD, “Australian Dollar vs US Dollar”

After completing the wave [e] of the horizontal triangle 4, the AUD/USD pair resumed falling.  Consequently, to confirm a new decline, the market has to form the descending impulse in the wave (i) during the next several days.

As we can see at the H1 chart, the pair is about to complete the third wave of the wave (i). As a result, in the nearest future the market may be corrected in the iv, which may be later followed by a new descending movement.


RoboForex Analytical Department

Article By RoboForex.com

Attention!
Forecasts presented in this section only reflect the author’s private opinion and should not be considered as guidance for trading. RoboForex LP bears no responsibility for trading results based on trading recommendations described in these analytical reviews.