Author Archive for InvestMacro – Page 575

USDJPY: Short at 111.90

By GrowthAces.com

EUR/USD: U.S. Q4 growth better than previously reported

Macroeconomic overview: Revised U.S. GDP data on Thursday showed that U.S. fourth quarter growth slowed less than previously reported as consumer spending provided a boost that was partially offset by the largest gain in imports in two years.

Gross domestic product increased at a 2.1% annualized rate instead of the previously reported 1.9% pace. The economy grew at a 3.5% rate in the third quarter. Despite the upward revision to the fourth quarter, the economy grew only 1.6% for all of 2016, its worst performance since 2011, after expanding 2.6% in 2015.

There are signs that economic activity slowed further in the first quarter, with the trade deficit widening in January and both consumer and construction spending weakening. The Atlanta Federal Reserve is forecasting GDP rising at a rate of 1.0% in the first quarter.

The government also reported that corporate profits after tax with inventory valuation and capital consumption adjustments increased at an annual rate of 2.3% in the fourth quarter after rising at a 6.7% pace in the previous three months.

Profits were held back by a USD 4.95 billion settlement between the U.S. subsidiary of Volkswagen and the U.S. federal and state governments for violation of environmental regulations. As a result, the economy grew at only a 1.0% rate when measured from the income side, braking sharply from the 5.0% pace of growth in the third quarter.

Growth in consumer spending, which accounts for more than two-thirds of U.S. economic activity, was revised up to a 3.5% rate in the fourth quarter. It was previously reported to have risen at a 3.0% rate.

Consumer spending is being supported by a tightening labor market. A separate report from the Labor Department on Thursday showed initial claims for state unemployment benefits fell 3kk to a seasonally adjusted 258k for the week ended March 25.

Domestic demand increased at a robust 3.4% rate in the fourth quarter, the fastest pace in two years. Some of the increase in demand was satiated with imports, which increased at a 9.0% rate. That was the biggest rise since the fourth quarter of 2014 and was an upward revision from the 8.5% growth pace reported last month. Exports fell more than previously estimated, leaving a trade deficit that subtracted 1.82 percentage point from GDP growth instead of the previously reported 1.70 percentage points.

Robust domestic demand and import growth meant stronger inventory investment than previously estimated. Businesses accumulated inventories at a rate of USD 49.6 billion in the last quarter, instead of the USD 46.2 billion reported last month.

Business investment was revised lower to reflect a more modest pace of spending on intellectual property, which increased at a 1.3% rate instead of the previously estimated 4.5% pace.

Later on Friday, Trump will sign executive orders aimed at identifying abuses that are causing massive U.S. trade deficits and clamping down on non-payment of anti-dumping and anti-subsidy duties on imports, according to his top trade officials. Commerce Secretary Wilbur Ross said that one of the orders directs his department and the U.S. Trade Representative to conduct a major review of the causes of U.S. trade deficits, including “currency misalignment”.

While the foreign exchange market’s reaction to the news was muted, market participants were warily watching for developments.

Eurozone inflation data release is scheduled for today. German and Spanish consumer price data disappointed on Thursday, showing inflation slowed more sharply than expected in March as oil prices slumped. That is why we think that today’s lower reading will not have much impact on the EUR/USD.

Technical analysis: A close under 50% fibo of March rise (1.0699) increases bearish sentiment. The next support is 1.0650 (61.8% fibo).

EURUSD Daily Forex Signals Chart

Short-term signal: Our EUR/USD long was stopped at 1.0695. We see no fundamental reasons for deeper EUR/USD move and are considering another long position in the coming days.

Long-term outlook: Bullish


USD/JPY: Japan’s economy has shown signs of life, short at 111.90

Macroeconomic overview: Japanese factory output rose at the fastest pace in eight months and the jobless rate hit a two-decade low in February, a sign a rebound in overseas demand continued to brighten prospects for the country’s export-reliant economy.

But household spending remained soft and consumer inflation was flat when stripping away the effect of rising energy costs, underscoring the challenges the Bank of Japan faces in generating sustained price rises backed by steady wage growth.

The data may reinforce market expectations that while the BOJ’s next policy move could be to withdraw its massive stimulus, the timing would be some time away.

Industrial output rose 2.0% in February from the previous month, beating market forecasts for a 1.2% gain to mark the biggest increase since June last year, as automakers ramped up production of new models, data showed on Friday.

Separate figures showed Japan’s jobless rate hit a 22-year low of 2.8% in February, down 0.2 percentage point from the previous month.

But household spending fell 3.8% in February from a year earlier, a bigger decline than market forecasts for a 1.7% drop, suggesting a tightening labour market has yet to drive up wages enough to boost consumption.

A rebound in energy costs pushed core consumer inflation to 0.2% in February, matching a median market forecast and marking the fastest annual pace in nearly two years. But a separate consumer price index that excludes the effect of volatile fresh food and energy costs rose just 0.1% in February, suggesting that weak consumption was preventing companies from raising prices of non-energy items.

With inflation far from his 2% target, however, BOJ Governor Haruhiko Kuroda has stressed that he sees “no reason” to dial back the bank’s massive stimulus programme anytime soon. BOJ officials have stressed that they would look at various data, not just the core consumer price figures, in determining whether underlying trend inflation is accelerating backed by solid economic growth. They argue that wage rises must accompany price gains for inflation to sustainably hit 2%.

We expect inflation to accelerate near 1% in the coming months and predict that the BOJ’s next move will be to start scaling back its stimulus.

Technical analysis: The USD/JPY recovery was stopped at  38.2% fibo of March rise yesterday. A break above this level would open the way to 50% fibo at 112.80. But we expect a return of bearish sentiment on this pair soon. The next bears’ target will be 109.93 – 50% retrace of 101.19-118.66 rise.

USDJPY Daily Forex Signals Chart

Short-term signal: We opened USD/JPY short at 111.90 with the short-term target at 111.00.

Long-term outlook: Bearish


TRADING STRATEGIES SUMMARY:

FOREX – MAJOR PAIRS:

Please enable images to upload to view this email properly

FOREX – MAJOR CROSSES:

Please enable images to upload to view this email properly

PRECIOUS METALS:

Please enable images to upload to view this email properly

It is usually reasonable to divide your portfolio into two parts: the core investment part and the satellite speculative part. The core part is the one you would want to make profit with in the long term thanks to the long-term trend in price changes. Such an approach is a clear investment as you are bound to keep your position opened for a considerable amount of time in order to realize the profit. The speculative part is quite the contrary. You would open a speculative position with short-term gains in your mind and with the awareness that even though potentially more profitable than investments, speculation is also way more risky. In typical circumstances investments should account for 60-90% of your portfolio, the rest being speculative positions. This way, you may enjoy a possibly higher rate of return than in the case of putting all of your money into investment positions and at the same time you may not have to be afraid of severe losses in the short-term.

How to read these tables?

1. Support/Resistance – three closest important support/resistance levels
2. Position/Trading Idea:
BUY/SELL – It means we are looking to open LONG/SHORT position at the Entry Price. If the order is filled we will set the suggested Target and Stop-loss level.
LONG/SHORT – It means we have already taken this position at the Entry Price and expect the rate to go up/down to the Target level.
3. Stop-Loss/Profit Locked In – Sometimes we move the stop-loss level above (in case of LONG) or below (in case of SHORT) the Entry price. This means that we have locked in profit on this position.
4. Risk Factor – green “*” means high level of confidence (low level of uncertainty), grey “**” means medium level of confidence, red “***” means low level of confidence (high level of uncertainty)
5. Position Size (forex)– position size suggested for a USD 10,000 trading account in mini lots. You can calculate your position size as follows: (your account size in USD / USD 10,000) * (our position size). You should always round the result down. For example, if the result was 2.671, your position size should be 2 mini lots. This would be a great tool for your risk management!
Position size (precious metals) – position size suggested for a USD 10,000 trading account in units. You can calculate your position size as follows: (your account size in USD / USD 10,000) * (our position size).
6. Profit/Loss on recently closed position (forex) – is the amount of pips we have earned/lost on recently closed position. The amount in USD is calculated on the assumption of suggested position size for USD 10,000 trading account.
Profit/Loss on recently closed position (precious metals) – is profit/loss we have earned/lost per unit on recently closed position. The amount in USD is calculated on the assumption of suggested position size for USD 10,000 trading account.
About the Author:

By GrowthAces.com – Daily Forex Trading Strategies


Wave Analysis 31.03.2017 (EUR/USD, GBP/USD, USD/JPY, AUD/USD)

Article By RoboForex.com

EUR USD, “Euro vs US Dollar”

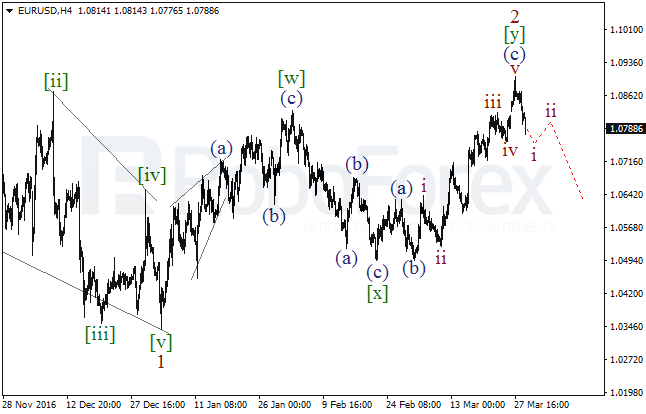
The EUR/USD pair is still falling. Earlier, the price completed the wave 2 in the form of the double zigzag and then started forming the descending impulse in the wave [i]. Possibly, later the market may start the correctional wave [ii].

More detailed structure is shown on the M30 chart. It looks like the pair is forming the fourth wave in the wave [i]. Consequently, soon the market may resume falling in the wave (v) of [i].


GBP USD, “Great Britain Pound vs US Dollar”

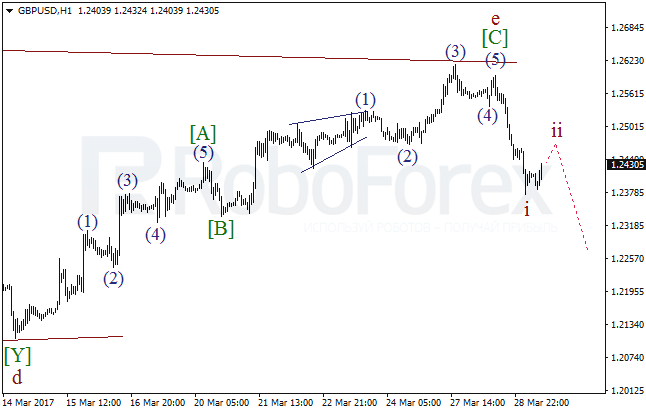
After rebounding from the upside border of the horizontal triangle, the GBP/USD pair formed the descending impulse in the wave i. After finishing the local correction, the price may start a new decline in the wave iii.

As we can see at the H1 chart, the wave ii took the form of the zigzag. As a result, during the next several days the pair may form the descending impulse in the third wave and break the local low.


USD JPY, “US Dollar vs Japanese Yen”

The USD/JPY pair continues forming the wave 2, which is taking the form of the double zigzag. Right now, the price is forming the wave [y] of 2. After finishing the wave (b), the market may resume falling in the wave (c) of [y].

More detailed structure is shown on the H1 chart. On Friday, the pair may complete the ascending impulse in the wave c of (b), which may later be followed by a new decline.


AUD USD, “Australian Dollar vs US Dollar”

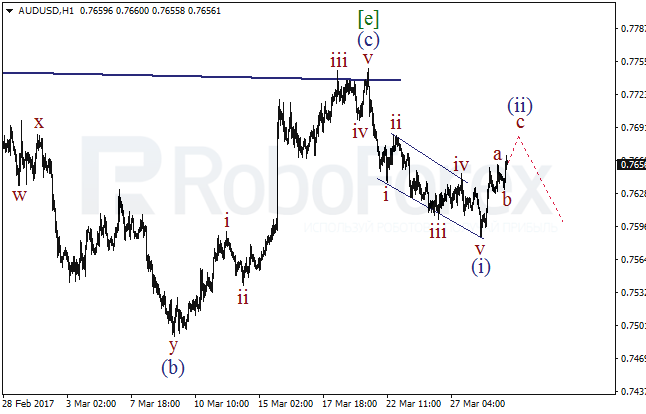
After rebounding from the upside border of the horizontal triangle, the AUD/USD pair formed the descending impulse in the wave (i). As a result, after finishing the wave (ii), the market may continue falling.

At the H1 chart, the pair completed the wedge in the wave (ii) and then started the correctional wave (ii), which is taking the form of the zigzag. In the nearest future, the price may resume falling and form the bearish impulse in the wave iii of (iii).


RoboForex Analytical Department

Article By RoboForex.com

Attention!
Forecasts presented in this section only reflect the author’s private opinion and should not be considered as guidance for trading. RoboForex LP bears no responsibility for trading results based on trading recommendations described in these analytical reviews.

EUR/USD: Euro still under pressure from the EUR/GBP cross

By Gabriel Ojimadu, Alpari

Previous:

On Thursday, the Euro once again closed down against the greenback. The common European currency has now fallen by 190 pips against the dollar over the last 3 days to 1.0673 and by 89 pips against the British pound to 0.8560.

The Euro started to depreciate faster against the pound after the UK officially started the process of exiting the EU on the 29th of March. Judging by cash flows, investors look to be converting their Euros into pounds. They’re clearly of the opinion that Brexit won’t have such a drastic effect on the British economy. The divorce process should come to an end at some point in 2019. On the other hand, the Euro’s collapse against the pound could be related to the coming to an end of this year’s first quarter. All the strong levels from which the price could have rebounded have been broken through. US 10Y bond yields have grown by 1.17% to 2.413%.

Market expectations:

Today is Friday, the end of the week, month, and first quarter. I’ve decided not to make a forecast given that the Euro’s two-day fall on the cross has obscured all the technical pictures on the EUR/USD pair. Buyers’ attempts to induce a rebound from the 38.2% Fibo level (growth from 1.0495 to 1.0906) fell flat. The EUR/USD has fallen to 1.0672. The closest support from which we can possibly expect a rebound is between 1.0628 and 1.0652.

Day’s news (GMT+3):

  • 09:00 Germany: retail sales (Feb), UK: Nationwide housing price index (Mar);
  • 10:55 Germany: unemployment change (Mar);
  • 11:30 UK: current account (Q4), GDP (Q4), total business investment (Q4);
  • 12:00 Eurozone: CPI (Mar), CPI core (Mar);
  • 15:30 Canada: GDP (Jan), USA: core personal consumption expenditure price index (Feb), personal income (Feb);
  • 16:45 USA: Chicago PMI (Mar);
  • 17:00 USA: FOMC member Kashkari’s speech, Michigan consumer sentiment index (Mar).

EURUSD rate on the hourly. Source: TradingView.

Intraday forecast: low: n/a, high: n/a, close: n/a.

On Thursday, the Euro closed down against the US dollar. Neither the 135th degree nor the 38.2% Fibo level was able to stop sellers. The EUR/USD pair fell to 1.0672 on the back of a rise in US bond yields and a fall on the EUR/GBP cross.

On the 29th of March, after Britain’s withdrawal from the EU officially got underway, the Euro broke through the trend line at 1.0782. From there, the projected course put the target at around the 1.0630 mark. Investors seem to be slightly concerned about the triggering of Article 50 of the Lisbon Treaty judging by the fact that they are now buying pounds.

The 38.2% Fibonacci level has been broken through. The 61.8% level runs through 1.0652, and the 257thdegree through 1.0646. A new support zone is forming between 1.0628 and 1.0652 levels. The current exchange rate on the EUR/USD is 1.0676.

Given that today marks the end of the month as well as the first quarter, I’ve decided not to make any predictions. It’s worth noting that the trend correction was 22.5 degrees. It currently runs through 1.0698 level. If the bulls manage to get past this, then it is likely that the trend line at 1.0869 will be broken through, followed by a restoration to the lb line at 1.0724.

Positives for the euro (+):

Fundamental:

(+) Head of the ECB, Mario Draghi, has hinted that the central bank may not need to provide any further stimulus to revitalise Europe’s economy. From April to December 2017, the ECB will reduce their monthly assets purchases to 80 to 60 billion EUR;

(+) ECB bosses have discussed the possibility of raising interest rates before the QE program comes to an end;

(+) On the 24th of March, Donald Trump withdrew his proposed healthcare bill to replace Obamacare from the US Congress’ agenda;

Technical (short-term):

(+) According to data from 21/03/17, large speculators on the Chicago Exchange have significantly increased their long and decreased their short positions. Long positions have grown by 10,138 to 158,646 contracts, while short positions have fallen by 10,325 to 176,891 contracts. Net short positions have fallen from 38,707 to 18,245 contracts. Small speculators have increased their long positions by 3,811 to 65,280 contracts and short positions by 4,779 to 63,093 contracts. Net long positions have fallen from 3,158 to 2,178 contracts;

(+) In Asia, US 10Y bond yields have fallen by 0.22% to 2.413%;

(+) EURGBP (W):  the CCI (20), AO and AC are up;

(+) EURUSD (M): the Stochastic (5,3,3) is up;

(+) EURUSD (W): The Stochastic (5,3,3), AO, AC, and CCI (20) are up;

Negatives for the euro (-):

Fundamental:

(-) Eric Rosengren, president of the Boston Fed, argues that the central bank should raise interest rates every other session, meaning that he expects to see another 3 hikes this year;

(-) FOMC member Williams is envisaging another 2-3 rate hikes this year and isn’t ruling out the possibility of even more;

(-) According to CME Group’s FedWatch Tool, on Thursday  the 30th of March, the probability of a rate hike in May has risen from 4.3% to 6.4%, in June from 52.9% to 54.0% and in July from 58.8% to 60.8%;

(-) Political risks in Europe (French elections);

Technical factors (short-term):

(-) Short/long ratio according to myfxbook as of 07:34 EET: 27%/72%, lots: 17069/44373 (previous day: 23661/25376), positions: 41132/67660 (previous day: 54075/51699);

(-) US 10-year bond yields: 2.413% (up 1.17% from 30/03/17);

(-) German 10-year bond yields: 0.340% (down 1.16% from 30/03/17);

(-) EURGBP (W): The Stochastic (5,3,3) is down;

(-) EURGBP (D): the AC, AO, CCI (20) and Stochastic (5,3,3) indicators are down;

(-) EURUSD (M): the AO and AC indicators are down;

(-) EURUSD (D): the AO, AC, CCI (20) and Stochastic (5,3,3) indicators are down;

Built into the price:

(-)  The Ex-Prime Minister of France, Alain Juppe, has ruled himself out of participating in the presidential election;

(-) Fed member Evans is expecting 2-3 rate hikes in 2017. The Federal Reserve will make a decision about the next hike in June;

(-) President of the Philadelphia Fed, Harker, announced that the Federal Reserve will continue to gradually increase interest rates throughout 2017;

(+) François Bayrou, leader of the “Democratic Movement” party, has ruled out running for the presidency and thrown his weight behind independent candidate Emmanuel Macron;

(+) Marine Le Pen has had her EU parliamentary immunity from prosecution lifted for political reasons;

(+) US president Donald Trump favours a weaker dollar;

(+) The threshold for acceptable US government debt of 20.1 trillion USD may be reached by March this year. This will create headaches for new US president Donald Trump;

(+) The Greek government has made some progress in its talks with international creditors on the second stage of their reform program;

(+) Ewald Nowotny, a member of the ECB’s governing council, has said that the bank could raise the deposit rate before the main refinancing rate;

(+) ECB member Lautenschläger warns that it’s time to prepare for a change in the bank’s policy.

There Is No Such Thing As Peak Oil Demand

By OilPrice.com

Notwithstanding that oil demand has increased for over 150 years, it will eventually stop increasing. If oil demand were to reach an actual peak, then the top might be easier to predict. As it stands, the forecast models of demand are likely predicting peak demand far later than it will be.

The so-called balance of supply and demand has always been a moving target, a race to the top in which the two run neck and neck. Imbalances result from out-of-step growth rates and not from movements away from a stationary balance. Perversely, imbalances breed further imbalances as the supply and demand components are provoked in opposite directions but with different timing, magnitudes and inertias. Without sufficient damping, the market has often overcompensated. Of course, there are also exogenous events like political turmoil, policy shifts, technological innovations and demographic changes which can unexpectedly and significantly alter not just the immediate balance but fundamentally shift the way supply and demand curves respond to price movements. The trends are plagued by inherent and irreducible irregularities.

Such a structural change has recently occurred. High prices persisted long enough for the industry in the U.S. to build a larger fleet of modern rigs and to learn how effectively to hydraulically fracture shale wells. It also persisted long enough for new efficiencies to incubate towards maturity, and the Paris accords promised to further reduce carbon emissions through policy changes. By the time that Saudi Arabia finally acted to protect not only its place among suppliers but also, and more importantly, the role of oil in the world economy. The backbone of shale supply in the U.S. was strong, and the seeds of lesser use were established. After these fundamental shifts, the rest of the world realized what Saudi Oil Minister Al-Naimi argued long ago and what Shell Oil has more recently asserted, namely that peak demand will occur long before peak supply.

To understand the trajectory of demand growth, we turn to econometric models like those published by the EIA and IEA. The central problem with long term supply and demand models is that they require assumptions about the many and interrelated responses to today’s prices. Though modeled responses may be tuned with low precision to relatively recent events and new realities, the actual response curves are poorly constrained and continue to evolve, in some cases at an accelerating pace. As the aphorism goes, all models are wrong, but some are useful.

The EIA, IEA and other public econometric models call for global oil demand to continue growing through 2040, and the EIA even calls for renewed growth in the U.S. and OECD demand. The forecasts of growth in global demand rely upon increased use by developing countries, most importantly China and India. On the other hand, the United States has already seen demand decline for about 13 years. In fact it was the second to last of the world’s seven major developed countries to enter demand decline, and the entire OECD group of countries has, as a whole, seen shrinking demand since 2007. EIA data shows that 35 countries in all have already reached and descended from maximum oil demand. The experience of projected versus actual peak oil demand in the U.S. and OECD countries provides an empirical test and thus context to evaluate the current forecasts of growth and delayed maximum.

The following chart compares actual oil demand in the U.S. to several relevant demand forecasts of the EIA, all data coming from the EIA itself. U.S. demand reached a plateau for four years ending in 2007. Before, during, and even after the actual maximum demand, the models predicted decades of growth.


The next chart shows the same kind of comparison for the IEA’s models of OECD oil demand. Actual demand gently achieved its maximum in 2005. Even the alternative policy (lower demand) case in 2006 failed to capture the impending decline, but the reference cases adapted to the reality of declining demand much more quickly than did the EIA. Still the IEA over predicted the actual demand. Though not shown in charts, the EIA’s model of OECD demand growth and the IEA’s model of U.S. demand growth follow the same patterns. In short, these deeply technical and widely used referenced models missed badly the pivot point, the watershed of the object of analysis. For truly exculpatory reasons, the second and third order dynamics of reality were not captured by the models.


Rather than the theoretical calculation by such models, empirical observation of history is likely more informative when it comes to anticipating the timing of maximum demand. The graph below normalizes annual oil demand from the G7 countries with the U.S. shown in black, each normalized to its own year and volume of maximum demand. The scales show a 15 year window around the maximum annual consumption, and the pattern of the G7 is repeated in the OECD total and in most all of the 28 other countries.


The same data viewed on the scale of generations may resemble an alpine peak, but from the experience of living through it, demand does not peak. It sputters, surges and stalls as it rolls over from a slow incline into a slow decline. It is less a peak and more a crest of demand.

Sequential global demand forecasts over the last decade have projected slower growth, mostly now forecast at less than 1 percent, and sensitivity cases now allow for the possibility of substantial demand decline by 2040. Unfortunately, experience demonstrates that the crest will likely occur unexpectedly and sooner than predicted. And then our industry enters a whole new world as the moving balance of supply and demand turns into a race to the bottom.

Link to original article: http://oilprice.com/Energy/Oil-Prices/There-Is-No-Such-Thing-As-Peak-Oil-Demand.html

By Dwayne Purvis for Oilprice.com


The Australian Dollar is slightly falling. Overview for 30.03.2017

Article By RoboForex.com

The AUD/USD pair started falling a little bit on Thursday after the market sentiments for the American currency changed.

On Thursday afternoon, the Australian Dollar is retreating against the USD. The current quote for the instrument is 0.7654.

The statistics published today showed that the HIA New Home Sales in Australia in February, added 0.2% m/m after losing 2.2% m/m the month before. As a result, the correction towards the disastrous reading of the beginning of the year turned out to be insignificant. However, the fact that the indicator moved to the positive area is good: when consumers spend their money not only on real estate, but on reparation, furniture, and accessories as well, they create demand for many other related industries.

Concurrently, investors are analyzing possible future result of the next meeting of the Reserve Bank of Australia, which is set to take place on April 4th. Opinions about the RBA’s decision concerning the rate are rather different, but four largest banks of the country think that the rate will remain unchanged.

However, so far there are no reasons for the Aussie to continue falling: for this, there have to be additional distress calls from the employment market or core inflation readings. At the same time, the real estate market situation doesn’t imply the rate to be decreased.

In view of this, the RBA rate may probably remain the same this year. And the RBA’s conservative approach may keep it unchanged the next year as well, if necessary.


RoboForex Analytical Department

Article By RoboForex.com

Attention!
Forecasts presented in this section only reflect the author’s private opinion and should not be considered as guidance for trading. RoboForex LP bears no responsibility for trading results based on trading recommendations described in these analytical reviews.

Forex Technical Analysis & Forecast 30.03.2017 (EUR/USD, GBP/USD, USD/CHF, USD/JPY, AUD/USD, USD/RUB, GOLD, BRENT)

Article By RoboForex.com

EUR USD, “Euro vs US Dollar”

The EUR/USD pair has tested 1.0740 from above and right now is consolidating. Possibly, today the price may reach 1.0777 and then fall towards 1.0758. If later the market breaks this consolidation range to the upside, it may grow to reach 1.0834; if to the downside – fall with the target at 1.0708.


GBP USD, “Great Britain Pound vs US Dollar”

The GBP/USD pair has fallen towards 1.2379; so far, it has formed three descending structure. Possibly, today the price may form another one to reach 1.2357. Later, in our opinion, the market may grow towards 1.2488.


USD CHF, “US Dollar vs Swiss Franc”

The USD/CHF pair has completed its ascending structure and right now is consolidating above 0.9953. If later the market breaks this consolidation range to the upside, it may grow to reach 1.0081; if to the downside – start another correction towards 0.9881.


USD JPY, “US Dollar vs Japanese Yen”

The USD/JPY pair has formed the five-wave ascending structure. Possibly, today the price may start a new correction towards 110.75. After that, the instrument may continue growing to break 111.40. The local target is at 112.25.


AUD USD, “Australian Dollar vs US Dollar”

The AUD/USD pair is trying to move upwards. However, the main scenario implies that the price may fall while forming the fifth wave with the target at 0.7541.


USD RUB, “US Dollar vs Russian Ruble”

The USD/RUB pair continues reaching new lows. The current wave may be considered as the fifth one inside the downtrend towards 55.50.


XAU USD, “Gold vs US Dollar”

Gold is forming the descending impulse towards 1244.55. Possibly, today the price may reach this level and start growing with the target at 1252.60, thus forming another consolidation range. If later the market breaks this consolidation range to the downside, it may fall towards 1233.50; if to the upside – reach 1262.60.


BRENT

Brent has almost reached its local target. Possibly, the price may form the third ascending structure as the extension with the target at 52.80. After that, the instrument may be corrected towards 51.50 and then grow with the target at 53.00. The entire wave may be considered as the first one inside the uptrend. The main target is at 56.10.


RoboForex Analytical Department

Article By RoboForex.com

Attention!
Forecasts presented in this section only reflect the author’s private opinion and should not be considered as guidance for trading. RoboForex LP bears no responsibility for trading results based on trading recommendations described in these analytical reviews.

EUR/USD: W-model forming

By Gabriel Ojimadu, Alpari

Previous:

On Wednesday, the Euro fell against the dollar to 1.0740. The pair has now closed down for the second day in a row. The 29th of March saw the process of the UK’s exit from the European Union officially begin. The triggering of Article 50 sets negotiations in motion, for which there is a two-year time limit. As such, the process should be completed in 2019.

Following the pound’s collapse yesterday, trader sentiment towards it improved after Chancellor Phillip Hammond spoke. He expressed his confidence that the government would reach a favourable deal for Britain. The EUR/GBP cross grew on this news, putting the single currency under pressure.

Market expectations:

The scales are starting to tip in buyers’ favour. Now, it’s important to keep an eye on US 10Y bond yields seeing as they slid yesterday from 2.43% to 2.378%. After a phase of growth, the subsequent rebound was a big one at over 62%. Seeing as the Euro was under pressure from the cross at the time, traders ignored the fall in bond yields.

In Asia, bonds are trading up, but it’s not a foregone conclusion that this growth will continue into the European session. Should US 10Y fall below 2.373%, the Euro should jump to 1.0795 level. The EUR/GBP cross is also starting to reverse upwards after it’s morning slide. There’s no significant data expected from Europe today.

Day’s news (GMT+3):

  • 10:00 Switzerland: KOF leading indicator (Mar);
  • 12:00 EU: consumer confidence (Mar), economic sentiment indicator (Mar);
  • 15:00 Germany: CPI (Mar);
  • 15:30 Canada: raw material price index (Feb), industrial product price (Feb), USA: GDP annualised (Q4), GDP price index (Q4), initial jobless claims (Mar 24);
  • 17:30 USA: EIA natural gas storage change (Mar 24);
  • 18:00 USA: FOMC member Kapaln’s speech;
  • 18:15 USA: FOMC memeber Williams’ speech;
  • 23:30 USA: FOMC member Dudley’s speech.

EURUSD rate on the hourly. Source: TradingView.

Intraday forecast: low: 1.0730/1.0740, high: 1.0795, close: 1.0779.

On Wednesday, the exchange rate broke through the trend line at 1.0790. After this breakthrough, the price subsequently fell to 1.0740. The rate was kept from falling further by the combined support of the MA line D3 and the 135th degree.

The 135th degree has been trying to keep sellers at bay for the last 16 hours. So far, it’s managed to do this. If the EUR/GBP cross bounces upwards, a W-model will form on our main pair.

In my forecast today, I’m envisaging a classic scenario. After breaking through the trend line yesterday, the price will return to this level and test the veracity of the breakthrough.

My forecasted target is 1.0795. Why exactly 1.0795, you ask? Because the 45th degree runs through this level. The lb balance line will be at this level by this evening. The Fibonacci 38.3% is located at 1.0803 level from the downwards movement from 1.0906 to 1.0740 (strengthening the level). The trend line from top 1.0906 also runs through this point. There’s too large a concentration of levels in one place.

So, could the euro/dollar fall below 1.0740? Yes, it could. The target for the next few days after the breaking through of the trend line is at 1.0628 level. If US 10Y bond yields restore to 2.43% and go higher, the Euro will depreciate against the dollar.

Positives for the euro (+):

Fundamental:

(+) Head of the ECB, Mario Draghi, has hinted that the central bank may not need to provide any further stimulus to revitalise Europe’s economy. From April to December 2017, the ECB will reduce their monthly assets purchases to 80 to 60 billion EUR;

(+) ECB bosses have discussed the possibility of raising interest rates before the QE program comes to an end;

(+) On the 24th of March, Donald Trump withdrew his proposed healthcare bill to replace Obamacare from the US Congress’ agenda;

Technical (short-term):

(+) According to data from 21/03/17, large speculators on the Chicago Exchange have significantly increased their long and decreased their short positions. Long positions have grown by 10,138 to 158,646 contracts, while short positions have fallen by 10,325 to 176,891 contracts. Net short positions have fallen from 38,707 to 18,245 contracts. Small speculators have increased their long positions by 3,811 to 65,280 contracts and short positions by 4,779 to 63,093 contracts. Net long positions have fallen from 3,158 to 2,178 contracts.

(+) US 10-year bond yields: 2.385% (down 1.73% from 29/03/17);

(+) EURGBP (W):  the CCI (20), AO and AC are up;

(+) EURGBP (D): the AO and Stochastic (5,3,3) indicators are up;

(+) EURUSD (M): the Stochastic (5,3,3) is up;

(+) EURUSD (W): The Stochastic (5,3,3), AO, AC, and CCI (20) are up;

Negatives for the euro (-):

Fundamental:

(-) Eric Rosengren, president of the Boston Fed, argues that the central bank should raise interest rates every other session, meaning that he expects to see another 3 hikes this year;

(-) FOMC member Williams is envisaging another 2-3 rate hikes this year and isn’t ruling out the possibility of even more;

(-) According to CME Group’s FedWatch Tool, on Wednesday  the 29th of March, the probability of a rate hike in May remains 4.3%. The probability in June has risen from 48.5% to 52.9% and in July from 56.1% to 58.8%;

(-) Political risks in Europe (French elections);

Technical factors (short-term):

(-) Short/long ratio according to myfxbook as of 07:04 EET: 48%/51%, lots: 23661/25376 (previous day: 31253/16232), positions: 54075/51699 (previous day: 67713/39342);

(-) German 10-year bond yields: 0.344% (down 13.13% from 29/03/17);

(-) In Asia, US 10Y bond yields have grown by 0.16% to 2.391%;

(-) EURGBP (W): The Stochastic (5,3,3) is down;

(-) EURGBP (D): the AO and CCI (20) indicators are down;

(-) EURUSD (M): the AO and AC indicators are down;

(-) EURUSD (D): the AC, CCI (20) and Stochastic (5,3,3) indicators are down;

Built into the price:

(-)  The Ex-Prime Minister of France, Alain Juppe, has ruled himself out of participating in the presidential election;

(-) Fed member Evans is expecting 2-3 rate hikes in 2017. The Federal Reserve will make a decision about the next hike in June;

(-) President of the Philadelphia Fed, Harker, announced that the Federal Reserve will continue to gradually increase interest rates throughout 2017;

(+) François Bayrou, leader of the “Democratic Movement” party, has ruled out running for the presidency and thrown his weight behind independent candidate Emmanuel Macron;

(+) Marine Le Pen has had her EU parliamentary immunity from prosecution lifted for political reasons;

(+) US president Donald Trump favours a weaker dollar;

(+) The threshold for acceptable US government debt of 20.1 trillion USD may be reached by March this year. This will create headaches for new US president Donald Trump;

(+) The Greek government has made some progress in its talks with international creditors on the second stage of their reform program;

(+) Ewald Nowotny, a member of the ECB’s governing council, has said that the bank could raise the deposit rate before the main refinancing rate;

(+) ECB member Lautenschläger warns that it’s time to prepare for a change in the bank’s policy.

Wave Analysis 29.03.2017 (EUR/USD, GBP/USD, USD/JPY, AUD/USD)

Article By RoboForex.com

EUR USD, “Euro vs US Dollar”

It’s highly likely that the EUR/USD pair completed the bullish impulse in the wave (c) of [y] and the entire wave 2 in the form of the double zigzag. As a result, in the nearest future the market has to form the bearish impulse in the wave i in order to confirm a new decline.

More detailed structure is shown on the M30 chart. The pair finished is about to finish the fifth wave in the wave i. Consequently, later the market may start a local ascending correction.


GBP USD, “Great Britain Pound vs US Dollar”

Probably, the GBP/USD pair completed the horizontal triangle in the wave (iv), rebounded from the pattern’s upside border, and started falling fast. After finishing the local correction, the price may start a new decline in the wave iii.

At the H1 chart, the fifth wave in the wave [C] of e turned out to be truncated and was followed by the bearish impulse in the wave i. Consequently, later the price may start forming the correctional wave ii.


USD JPY, “US Dollar vs Japanese Yen”

At the H4 chart, the USD/JPY pair completed the descending impulse (a) and started the ascending correction. In the future, the market may form another bearish impulse, this time in the wave (c) of [y].

As we can see at the H1 chart, after finishing the wave v of (a), the pair started the current correction.  Possibly, the wave (b) is taking the form of the zigzag. Consequently, on Wednesday the market may form the ascending impulse in the wave a of (b).


AUD USD, “Australian Dollar vs US Dollar”

After rebounding from the upside border of the horizontal triangle, the AUD/USD pair formed the descending impulse in the wave (i). As a result, after finishing the wave (ii), the market may resume falling.

At the H1 chart, the pair formed the descending wedge in the wave (i) and, as a result, started the ascending correction. On Wednesday, the price may be corrected in the wave (ii), but later the market is expected to form another bearish impulse in the wave (iii).


RoboForex Analytical Department

Article By RoboForex.com

Attention!
Forecasts presented in this section only reflect the author’s private opinion and should not be considered as guidance for trading. RoboForex LP bears no responsibility for trading results based on trading recommendations described in these analytical reviews.

EUR/USD: rate approaching the trend line

By Gabriel Ojimadu, Alpari

Previous:

On Tuesday, trading on the euro/dollar closed in the red. The Euro depreciated against the greenback by 0.46% over the course of the day. The intraday range came to 74 pips and was over 200 on the GBP cross. The Euro’s collapse followed that of the British pound. The EUR/GBP cross provided support until the US dollar went on the offensive.

Clearly, investors have turned a blind eye to Donald Trump’s failings and started buying US shares and selling bonds. The DIJA and S&P500 indices were bolstered by 0.73%. US 10Y bond yields grew by 2.06% to 2.472%.

The Scottish parliament’s vote in favour of holding a second independence referendum, along with British Prime Minister Theresa May signing Article 50 to officially start the UK’s withdrawal from the EU, both weighed heavily on the British pound.

Market expectations:

The British pound has recovered slightly since trading opened in Asia. Market participants, however, are nervous about the UK’s letter notifying Brussels of their intention to leave the European Union. Still, this is already built into the price, so there’s no real cause for concern.

At the time of writing, our currency pair is trading at 1.0807 level. The trend line runs through 1.0792, so this is the level at which the single currency’s slide could potentially be halted. US bond yields are in the green, and if they can rise above 2.445%, we can expect a subsequent drop and a corresponding rise for the Euro.

Day’s news (GMT+3):

  • 09:00 Switzerland: UBS consumption indicator (Feb), Germany: import price index (Feb);
  • 11:00 Switzerland: Credit Suisse economic outlook (Feb);
  • 11:30 UK: net lending to individuals (Feb), M4 money supply (Feb), mortgage approvals (Feb);
  • 16:20 USA: FOMC member Evans’ speech;
  • 17:00 USA: pending home sales (Feb);
  • 18:30 USA: FOMC member Rosengren’s speech;
  • 19:50 EU: ECB member Prat’s speech;
  • 20:15 USA: FOMC member Williams’ speech.

EURUSD rate on the hourly. Source: TradingView.

Intraday forecast: low: n/a, high: n/a, close: n/a.

As the EUR/GBP cross provided support on Tuesday, the EUR/USD rate traded within the 1.0850 – 1.0873 range until the US stock market opened. As US stock indices and bond yields rose, the Euro slid to the 90th degree at 1.0799. The trend line and the 45th degree couldn’t stop buyers from bringing the price down.

The reversal zone is located between 1.0750 – 1.0776 levels (135 – 112 degrees). The trend line from 1.0525 runs through 1.0791 level. Like yesterday, the trend line could be broken through and the price could test the 112th degree.

I’m not making a prediction today because I’m not sure how traders will react to the news about Brexit and a second Scottish independence referendum. The exact date of Article 50’s triggering has only been known for about a week. Also, Theresa May has confirmed several times that her government would block any attempt at a second referendum. Still, what triggered such an aggressive selloff of sterling remains a mystery to me.

Positives for the euro (+):

Fundamental:

(+) Head of the ECB, Mario Draghi, has hinted that the central bank may not need to provide any further stimulus to revitalise Europe’s economy. From April to December 2017, the ECB will reduce their monthly assets purchases to 80 to 60 billion EUR;

(+) ECB bosses have discussed the possibility of raising interest rates before the QE program comes to an end;

(+) On the 24th of March, Donald Trump withdrew his proposed healthcare bill to replace Obamacare from the US Congress’ agenda.

Technical (short-term):

(+) According to data from 21/03/17, large speculators on the Chicago Exchange have significantly increased their long and decreased their short positions. Long positions have grown by 10,138 to 158,646 contracts, while short positions have fallen by 10,325 to 176,891 contracts. Net short positions have fallen from 38,707 to 18,245 contracts. Small speculators have increased their long positions by 3,811 to 65,280 contracts and short positions by 4,779 to 63,093 contracts. Net long positions have fallen from 3,158 to 2,178 contracts.

(+) Short/long ratio according to myfxbook as of 07:23 EET: 65%/34%, lots: 31253/16232 (previous day: 34751/6549), positions: 67713/39342 (previous day: 69240/22454);

(+) EURGBP (W):  the CCI (20), AO and AC are up;

(+) EURGBP (D): the AO, CCI (20) and Stochastic (5,3,3) indicators are up;

(+) EURUSD (M): the Stochastic (5,3,3) is up;

(+) EURUSD (W): The Stochastic (5,3,3), AO, AC, and CCI (20) are up;

(+) EURUSD (D): the AO indicator is up;

Negatives for the euro (-):

Fundamental:

(-) According to CME Group’s FedWatch Tool on Monday  the 27th of March, the probability of a rate hike in May has fallen from 6.4% to 4.3%, in June from 54% to 48.5% and in July from 60.8% to 56.1%;

(-) Political risks in Europe (French elections);

Technical factors (short-term):

(-) German 10-year bond yields: 0.396% (down 1.49% from 28/03/17);

(-) US 10-year bond yields: 2.427% (up 1.97% from 28/03/17);

(-) In Asia, US 10Y bond yields have grown by 0.59% to 2.423%;

(-) EURGBP (W): The Stochastic (5,3,3) is down;

(-) EURGBP (D): the AO indicator is down;

(-) EURUSD (M): the AO and AC indicators are down;

(-) EURUSD (D): the AC, CCI (20) and Stochastic (5,3,3) indicators are down;

Built into the price:

(-)  The Ex-Prime Minister of France, Alain Juppe, has ruled himself out of participating in the presidential election;

(-) Fed member Evans is expecting 2-3 rate hikes in 2017. The Federal Reserve will make a decision about the next hike in June;

(-) President of the Philadelphia Fed, Harker, announced that the Federal Reserve will continue to gradually increase interest rates throughout 2017;

(+) François Bayrou, leader of the “Democratic Movement” party, has ruled out running for the presidency and thrown his weight behind independent candidate Emmanuel Macron;

(+) Marine Le Pen has had her EU parliamentary immunity from prosecution lifted for political reasons;

(+) US president Donald Trump favours a weaker dollar;

(+) The threshold for acceptable US government debt of 20.1 trillion USD may be reached by March this year. This will create headaches for new US president Donald Trump

(+) The Greek government has made some progress in its talks with international creditors on the second stage of their reform program;

(+) Ewald Nowotny, a member of the ECB’s governing council, has said that the bank could raise the deposit rate before the main refinancing rate;

(+) ECB member Lautenschläger warns that it’s time to prepare for a change in the bank’s policy.

Forex Technical Analysis & Forecast 29.03.2017 (EUR/USD, GBP/USD, USD/CHF, USD/JPY, AUD/USD, USD/RUB, GOLD, BRENT)

Article By RoboForex.com

EUR USD, “Euro vs US Dollar”

The EUR/USD pair has completed the target of the descending structure, but the ascending impulse has failed to continue. As a result, the instrument has broken 1.0833 and continued extending the descending structure by forming a deeper correction. According to the main scenario, the price is expected to continue falling inside the downtrend with the target at 1.0763. Possibly, the price may test 1.0833 from below. Later, in our opinion, the market may continue moving downwards to reach the above-mentioned target.


GBP USD, “Great Britain Pound vs US Dollar”

The GBP/USD pair has broken the low of the first descending impulse and right now continues falling inside the downtrend. Possibly, the price may reach 1.2360 and then start forming another consolidation range. If later the market breaks this consolidation range to the downside, it may fall to reach 1.2050 if to the upside – start another correction towards 1.2500 to test it from below. After that, the downtrend may continue.


USD CHF, “US Dollar vs Swiss Franc”

The USD/CHF pair has broken the top of the first ascending impulse. Possibly, the price may reach the target at 0.9950. At the moment, the pair may test 0.9882 from above. Later, in our opinion, the market may continue growing towards the above-mentioned target.


USD JPY, “US Dollar vs Japanese Yen”

The USD/JPY pair has broken the top of the first ascending impulse as well and may continue moving to reach the target at 111.54. Possibly, today the price may reach the local target at 111.43 and then start a new correction towards 110.79. After that, the instrument may continue growing to reach the above-mentioned target.


AUD USD, “Australian Dollar vs US Dollar”

The AUD/USD pair is trading to rebound from the upside border of the consolidation range. Possibly, today the price may fall while forming the fifth wave with the target at 0.7541.


USD RUB, “US Dollar vs Russian Ruble”

The USD/RUB pair broke 56.89 to the downside again. Possibly, the price may fall to reach 55.50. After that, the instrument may grow towards 56.89 to test it from below.


XAU USD, “Gold vs US Dollar”

Gold has broken the low of the first descending impulse and right now is consolidating below 1245.88. In fact, the instrument is expected to reach 1230.00. Possibly, today the price may fall with the local target at 1233.50.


BRENT

Brent has rebounded from 51.20, fixed below it, and right now is forming another structure with the local target at 52.42. After that, the instrument may be corrected to test 51.20 from above and then grow with the target at 52.80.


RoboForex Analytical Department

Article By RoboForex.com

Attention!
Forecasts presented in this section only reflect the author’s private opinion and should not be considered as guidance for trading. RoboForex LP bears no responsibility for trading results based on trading recommendations described in these analytical reviews.