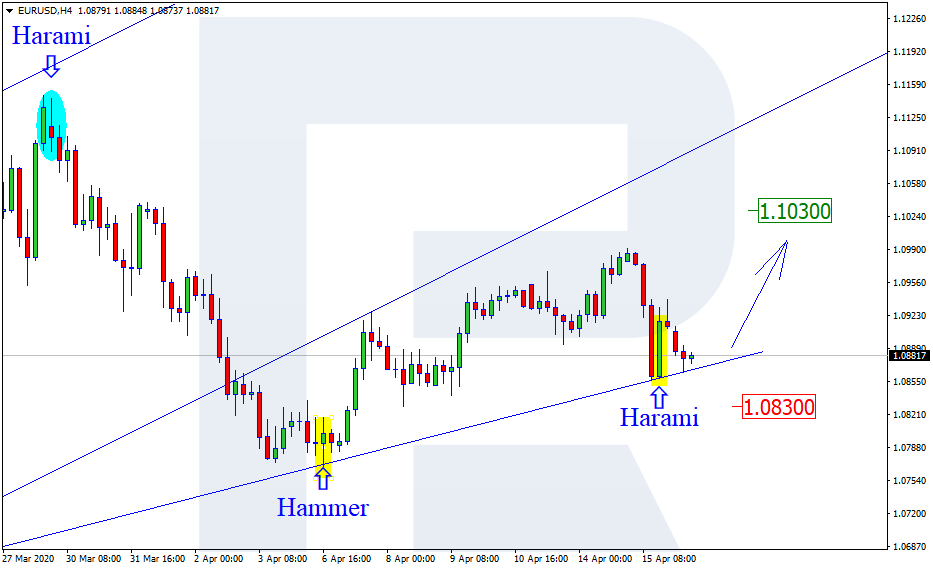
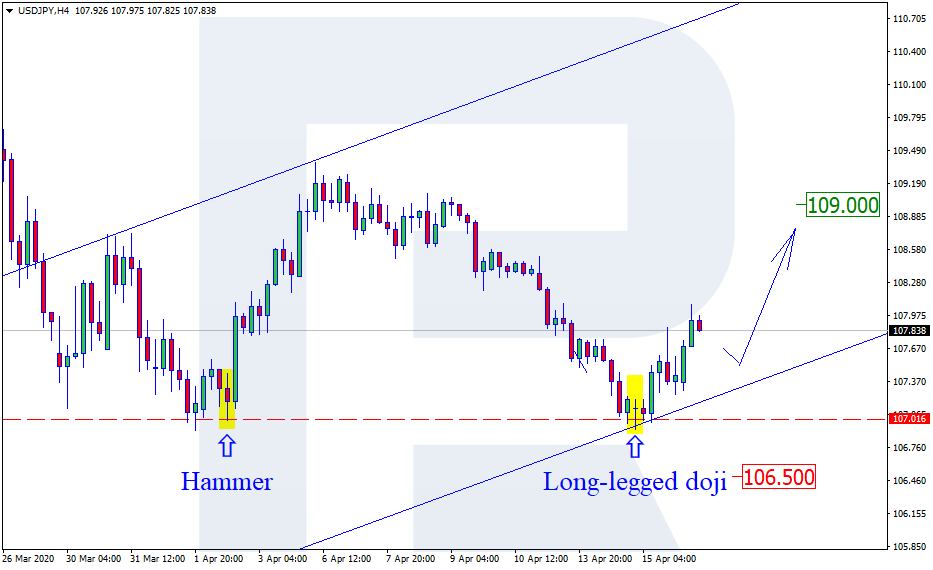
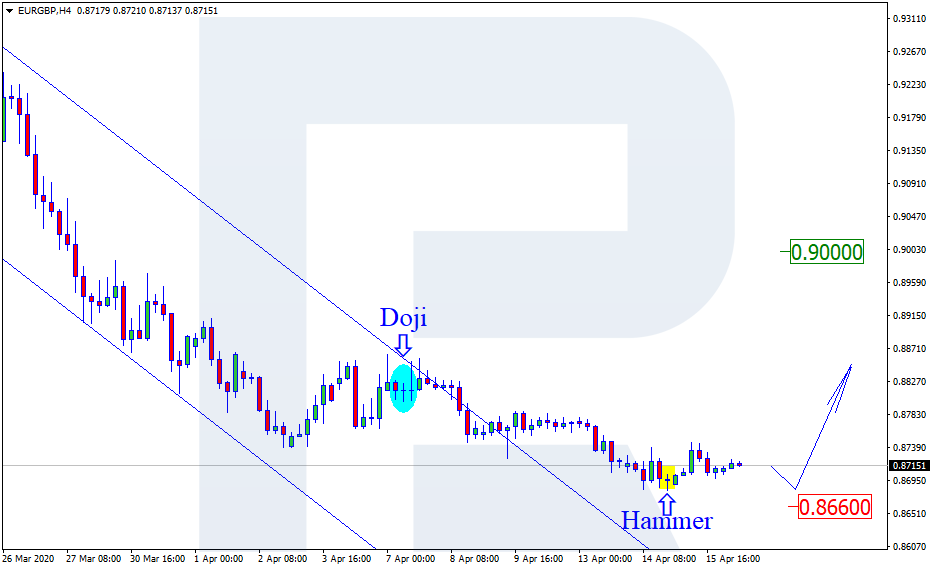
By TheTechnicalTraders
– Big news out today on CNBC about Gilead drug cured all 125 people from serious COVID-19 conditions within 5 days, This is amazing to hear, stocks are popping today up 3-5% which is to be expected for this type of news but the damage to the financial markets has already been done.
But early data recently published suggests the Banking and Finance sector may continue to get crushed under a massive weight of real losses and exposure to risk in the Derivatives Markets. As with the 2008-09 Credit Crisis, Derivatives losses extended compound risk factors by 10x to 20x or more for in some instances. We believe the banking and finance sector may be setting up for a massive implosion if global derivatives implode as leveraged accounts collapse.
Two very interesting news articles that may assist readers in understanding the current Financial market contagion event are:
Bank Earnings Armageddon by TheInstitutionalRiskAnalyst.com
Xi fears Japan-led manufacturing exodus from China by Asia.Nikkei.com
The Chinese/Asian economy is built upon the premise that global demand will continue without interruption over the next many decades. Additionally, China and Asia have leveraged capital systems and financial functions by deploying a very shadowy measure of lending and banking functions. We’ve all heard the stories of how collateral-based loans were offered many times over as stock in Copper or other raw materials were simply moved from one location to another to secure loans on the same material.
As with any great Ponzi scheme – it all starts to collapse when investors decide they don’t want to play games any longer.
Federal Reserve – Retail & Food Services Sales
These recent St. Louis Federal Reserve charts paint a fairly clear picture that retail and food services sales have collapsed to below levels of 4+ years ago – and this is just getting started.
Federal Reserve – Borrower Delinquency Rate
This next chart shows that sub-prime borrower delinquency rates have already peaked above both the 2000 and 2008-09 peak levels. The current virus event collapse is a completely different beast of destruction than what we’ve experienced before.
This is why we believe the Banking and Financial sectors are about to get hammered over the next 6+ months as a massive credit and debt deleveraging process continues to take place. Consumers recently displaced from the workforce will suddenly find themselves without the ability to pay their bills and credit card balances. This is not just happening in the US or select areas – this is happening throughout the world right now. Banking and Finance are staring into a black hole in terms of just how big and destructive the displacement of consumer jobs/earnings capacity really is.
We believe the recent recovery in the US stock market was a reactionary event prompted by the US Fed stepping in to “stick their finger in the dike” as an effort to thwart the downside price collapse. When the reality of the situation really begins to settle in about 60 days, banks and other financial institutions are going to have a difficult time explaining losses and exposure to derivatives risks that were clearly evident in March and April 2020.
Before we continue, be sure to opt-in to our free market trend signals
before closing this page, so you don’t miss our next special report!
Weekly Chart – NASDAQ Regional Banking Index
This first Weekly chart of the NASDAQ Regional Banking Index shows just how destructive the initial downside price move has been. Even though the US Fed stepped in with a massive $5+ trillion rescue plan, the recovery in this sector has been minor. We believe that is because most investors understand the true risks in this sector are likely in the hundreds of trillions range with derivatives and leveraged positions.
UCC Weekly Chart – Consumer Services Sector
This UCC Weekly chart shows a bit more of a recovery after the US Fed stepped in to save the day. Yet, we fully believe a deeper price low is likely to set up as the full extent of total newly unemployed put additional strains on expectations. Consumers without income can suddenly collapse multiple trillions in credit/debt over a very short period of time.
XLF Financial Sector Weekly Chart
The XLF Financial Sector Weekly chart paints a very clear picture of the downside risks current in play. After a massive initial collapse, a brief sideways recovery has taken place. Yet the true risk for this sector takes place over the next 24+ months as these newly displaced workers attempt to manage with little or no income and attempt to satisfy debt levels that were acquired expecting pre-2020 income expectations. New cars, new homes, new credit card debt, new everything purchased on credit has suddenly become the beast that destroys the financial/banking sector.
Concluding Thoughts:
Our researchers believe the true scope of this crisis won’t be known for at least another 30 to 60+ days. The closer we get to the end of Q2, the more likely we are to see real data reflecting real risks in the Banking and Financial sectors.
Until we get a more accurate understanding of the risks, we feel it is much safer to assume the worst-case scenario going forward. There is simply no way to paint a positive picture when people throughout the globe are losing their jobs, incomes, and all sense of normalcy. The reality is that this disruption in the global banking and financial sector is certainly going to be a big one that could last many months or years and if you read this article or watch the video you will understand the magnitude of this market top that looks to be forming.
I have to toot my own horn here a little because subscribers and I had our trading accounts close at a new high watermark for our accounts. We not only exited the equities market as it started to roll over, but we profited from the sell-off in a very controlled way, and yesterday we locked in more profits with our SPY ETF trade on this bounce.
As a technical analyst and trader since 1997, I have been through a few bull/bear market cycles in stocks and commodities. I believe I have a good pulse on the market and timing key turning points for investing and short-term swing traders. 2020 is going to be an incredible year for skilled traders. Don’t miss all the incredible moves and trade setups.
I hope you found this informative, and if you would like to get a pre-market video every day before the opening bell, along with my trade alerts. These simple to follow ETF swing trades have our trading accounts sitting at new high water marks yet again this week, not many traders can say that this year. Visit my Active ETF Trading Newsletter.
We all have trading accounts, and while our trading accounts are important, what is even more important are our long-term investment and retirement accounts. Why? Because they are, in most cases, our largest store of wealth other than our homes, and if they are not protected during a time like this, you could lose 25-50% or more of your entire net worth. The good news is we can preserve and even grow our long term capital when things get ugly like they are now and ill show you how and one of the best trades is one your financial advisor will never let you do because they do not make money from the trade/position.
If you have any type of retirement account and are looking for signals when to own equities, bonds, or cash, be sure to become a member of my Long-Term Investing Signals which we issued a new signal for subscribers.
Ride my coattails as I navigate these financial markets and build wealth while others lose nearly everything they own during the next financial crisis.
Chris Vermeulen
Chief Market Strategies
TheTechnicalTraders.com