The decline in sentiment for copper continued last week as speculators decreased their net positions in the copper futures markets for the fourth consecutive week, according to the latest Commitment of Traders (COT) data released by the Commodity Futures Trading Commission (CFTC) on Friday.
The non-commercial futures contracts of copper futures, traded by large speculators and hedge funds, totaled a net position of 12,458 contracts in the data reported through April 25th. This was a weekly drop of -3,585 contracts from the previous week which had a total of 16,043 net contracts.
Copper speculators have now reduced their bullish bets for eleven out of the last twelve weeks and to a new low level since November 1st.
Copper Commercial Positions:
The commercial traders position, categorized by the CFTC as hedgers or traders engaged in buying and selling for business purposes, totaled a net position of -11,990 contracts last week. This is a weekly change of 6,402 contracts from the total net of -18,392 contracts reported the previous week.
Copper ETN:
Over the same weekly reporting time-frame, from Tuesday to Tuesday, the JJC iPath Bloomber Copper ETN, which tracks the price of copper, closed at approximately $29.51 which was a gain of $0.75 from the previous close of $28.76, according to financial market data.
*COT Report: The COT data, released weekly to the public each Friday, is updated through the previous Tuesday (data is 3 days old) and shows a quick view of how large speculators or non-commercials (for-profit traders) as well as the commercial traders (hedgers & traders for business purposes) were positioned in the futures markets. The CFTC categorizes trader positions according to commercial hedgers (traders who use futures contracts for hedging as part of the business), non-commercials (large traders who speculate to realize trading profits) and nonreportable traders (usually small traders/speculators). Find CFTC criteria here: (http://www.cftc.gov/MarketReports/CommitmentsofTraders/ExplanatoryNotes/index.htm).
This three-video series demolishes the widely held notion that news drives the markets and provides a basis for using Elliott wave analysis in your own trading and investing decisions.
This article was syndicated by Elliott Wave International and was originally published under the headline Recall This Bond Trader Chart? Here’s What Happened. EWI is the world’s largest market forecasting firm. Its staff of full-time analysts led by Chartered Market Technician Robert Prechter provides 24-hour-a-day market analysis to institutional and private investors around the world.
Gold and Bitcoin are two of my favorite investments. Here are 5 reasons why I believe both are headed much higher over the next few years:
#1 War and Political Instability
Despite running on a non-interventionist foreign policy, President Trump appears to be escalating tensions around the globe. He fired over 50 Tomahawk missiles at a Syrian army airbase and dropped a GBU-43/B Massive Ordnance Air Blast bomb (MOAB), for the first time ever, on suspected ISIS fighters in the mountains of Afghanistan. Recent airstrikes in Syria have reportedly killed U.S. allies and dozens of civilians. Ground operations are also thought to have increased in the Middle East.
It appears that Trump has handed the keys of the military over to the generals, as the Pentagon is reportedly deciding when, where and how many troops to deploy in Iraq and Syria. Trump has increased hostility towards North Korea and recently sent a carrier strike group to the region. He also mobilized and installed the THAAD missile defense system in South Korea and sent nuclear submarines. China has responded by testing new missile systems and performing live military drills. They have repeatedly warned the U.S. against installing THAAD systems so close to their borders.
It is increasingly looking like the European Union could fall apart, with nationalist parties in multiple countries gaining political power. Edrogan is in the middle of a major power grab in Turkey, purging thousands of police and military officers, shuttering critical news organizations, all while the opposition party attempts to stop him. Conflict over the disputed South China Sea remains a flash point, Secretary of State Tillerson has stated he will not remove sanctions from Russia until they return Crimea, which will never happen. NATO is in the midst of its most aggressive military deployment to Russia’s borders, including a recent deployment of dozens of F-35 fighter jets.
Gold is a traditional safe-haven asset that does well during times of increasing war and geopolitical uncertainty. Bitcoin also stands to benefit as citizens look to shield their assets from governments that need to feed the war machine.
#2 Multiple Market Bubbles Poised to Pop
Stocks, bonds and real estate are all in historic bubble territory by a number of different measures. A major correction in these markets will likely have a contagion effect, dragging down all markets at once and setting off a derivatives crisis. With the FED raising interest rates, reducing its balance sheet and the baby boomer generation removing vast amounts of wealth from the markets, the bottom is due to fall out.
The NASDAQ has doubled in price over the past five years. The Shiller P/E, or CAPE (cyclically adjusted P/E ratio) has reached the third most expensive the market has ever been. It was only higher just prior to the Great Depression and 2000 dotcom bubble.
Real estate prices in many markets have eclipsed their 2006 bubble highs. A simple calculation of the median single family home price divided by average household income shows that homes are nearing the least affordable levels they have ever been. This ratio has risen dramatically over the past seven years back towards levels just before the last housing market crash. Put simply, wage increases and not keeping pace with increasing home prices.
#3 Unsustainable Debt Levels Continue to Grow
The national debt is fast approaching $20 TRILLION. To put that number into perspective, it requires interest payments of nearly $450 BILLION per year or nearly $15,000 per second. The debt per U.S. citizen has increased to over $60,000, while most Americans have less than $5,000 in savings. The debt is now 106% of GDP, with most economists warning about a slippery slope whereby it is increasingly difficult to reverse course after debt reaches 100% of GDP.
Of course, this is just the official debt number and does not include unfunded liabilities or off-balance-sheet debt. While it is impossible to know the exact number, estimates of the true debt of the United States range between $100 trillion and $250 trillion. If it is $200 trillion, the United States debt to GDP ratio is well over 1,000%. That would make the debt load of the United States many times worse than Japan at 250% or Greece at 180%.
While I generally favor lower taxes, Trump’s tax cuts are estimated to add $7 trillion in new debt over the next 10 years. His administration is hopeful that flourishing business growth would make up for the loss in tax revenues, but I believe this is wishful thinking. And while he has proposed cutting some forms of government spending, these savings are offset by massive increases to military spending.
#4 Global Currency Debasement, A Weaker USD and Rising Inflation
Central banks and governments around the globe are competing to keep their currency values low in order to keep their exports affordable and support their manufacturing industries. President Trump and his Treasury Secretary have come out mulitple times calling the dollar “too strong,” while accusing China of manipulating their currency to the downside.
The USD had been trading sideways for a few years, finally broke out above the 100 level, but has since dropped back below 100 in a new downtrend channel. The 2017 dollar weakness has materialized despite the FED raising interest rates in December and promising 3 more hikes this year.
Notice the USD index is now testing major support and that a drop below 98 would be very bearish for the dollar. Everyone was long the USD heading into 2017 and that crowded trade turned out to be wrong, as crowded trades so often prove to be.
While growth in the money supply has slowed over the past few years, inflation is finally starting to pick up. Enough money was printed in the years following the financial crisis to create extremely high inflation, but the velocity of money was too subdued to feel the effects. Banks were being rewarded by the FED to lock up excess reserves, rather than increasing lending.
Whether you prefer to use government numbers or the shadowstats alternate, inflation is undeniably picking up pace. In fact, inflation rates are at the highest levels since 2011, despite rising interest rates. But the real impact will be seen once the bubble economy pops and the government frantically rushes in again to stop the bleeding.
The bottom line is that fiat central bank notes will continue to lose value over time and the Trump administration seems more vocal and motivated to keep the dollar weak than previous administrations. This bodes well for precious metals and cryptocurrencies, which both have a limited supply and cannot be created out of thin air at the request of bankser and beauracrats.
#5 War on Cash and Growing Third-Party Risk
Governments around the world are intensifying their war on cash. They want oversight and control of the wealth of their citizens. They are trying desperately to keep people from moving their money outside of the traditional banking system, outside of their country and outside of their ability to tax (steal) from their citizens. Capital has been fleeing China in a major way over the past decade and Bitcoin has become an increasingly popular way for the Chinese to transfer their wealth outside of the country and outside of government control.
The ostensible reason given by our rulers for suppressing cash is to keep society safe from terrorists, tax evaders, money launderers and drug cartels. But the actual aim of limiting or even prohibiting cash transactions is to force the public at large to make payments through the financial system in order to prop up the unstable fractional-reserve banks, while expanding the ability of governments to spy on and keep track of their citizens’ private financial dealings.
If the government declares a national emergency, if war breaks out, if the economy is crashing, money that you have locked up in bank accounts or investment accounts may not be safe. It only takes a flick of a pen for the government to block your access to these funds, which we have seen occur in multiple countries in recent years.
As people seek to protect their assets from inflation or theft, secure their financial privacy, flee oppressive governments and be their own banks, look for massive amounts of money to flow into gold and bitcoin. Some argue that we have already hit peak gold and that global production will only decline into the future. Likewise, there will only ever be 21 million bitcoin in existence and 16.4 million are already in circulation. With increasing demand and limited supply, prices are likely to continue pushing much higher.
Even with Bitcoin having scalability problems and gold facing leverage paper price manipulation, I believe prices for both will explode higher as people flee fiat bankster notes, the FED finally loses control of the global economic system and our governments plunge us into never-ending wars.
Bitcoin just made a new all-time high today above $1,300 and our #1 cryptocurrency pick is up over 500% in 2017! View our full portfolio, follow our research on precious metals, mining companies, bitcoin and other cryptocurrencies by signing up here.
Jason Hamlin is the founder of Gold Stock Bull and has been investing in precious metals for over 20 years. Jason spent nearly a decade in analytics for the world’s largest market research firm, before finding success investing full time. He launched Gold Stock Bull in 2005 and turned his focus from helping fortune 500 companies to helping individual investors. Jason is a student of Austrian economics and a proponent of cryptocurrencies such at bitcoin.
GBP USD, Time Frame H4. Indicator signals: Tenkan-Sen and Kijun-Sen intersected and formed “Golden Cross” (1) again, all lines are directed upwards; D Tenkan-Sen and D Kijun-Sen are still influenced by D “Golden Cross” (3). Ichimoku Cloud is heading up (2), Chinkou Lagging Span is above the chart, and the price is above the lines. Short-term forecast: we can expect support from W Senkou Span A, and a further growth of the price.
GBP USD, Time Frame H1. Indicator signals: Tenkan-Sen and Kijun-Sen intersected above Kumo Cloud and formed “Golden Cross” again. Ichimoku Cloud is going up (2), Chinkou Lagging Span is above the chart, and the price is above the lines. Short-term forecast: we can expect support from Tenkan-Sen, and growth of the price.
XAU USD, “Gold vs US Dollar”
XAU USD, Time Frame H4. Indicator signals: Tenkan-Sen and Kijun-Sen are still influenced by “Dead Cross” (1); Tenkan-Sen is directed downwards. Ichimoku Cloud is moving downwards and expanding, Chinkou Lagging Span is below the chart, and the price is between Tenkan-Sen and Kijun-Sen. Short‑term forecast: we can expect resistance from D Kijun-Sen, and a further decline of the price.
Attention! Forecasts presented in this section only reflect the author’s private opinion and should not be considered as guidance for trading. RoboForex LP bears no responsibility for trading results based on trading recommendations described in these analytical reviews.
The EUR/USD pair is falling to reach 1.0833. Later, in our opinion, the market may be corrected towards 1.0882 and then form another descending wave with the target at 1.0777.
GBP USD, “Great Britain Pound vs US Dollar”
The GBP/USD pair has reached the upside border of its consolidation range. We think, today the price may be corrected towards the downside border. The target is at 1.2710.
USD CHF, “US Dollar vs Swiss Franc”
The USD/CHF pair has formed another consolidation range. Possibly, today the price may grow towards 1.0000. After that, the instrument may be corrected to reach 0.9950 and then continue moving upwards with the target at 1.0050.
USD JPY, “US Dollar vs Japanese Yen”
The USD/JPY pair has formed another consolidation range and right now, being under pressure, is moving downwards. Possibly, the price may break the downside border of the range. The first target is at 109.01.
AUD USD, “Australian Dollar vs US Dollar”
Being under pressure, the AUD/USD pair is moving upwards. We think, today the price may test 0.7500 from below and then fall to reach 0.7407.
USD RUB, “US Dollar vs Russian Ruble”
Being under pressure, the USD/RUB pair is also moving upwards. Possibly, the price may grow to reach 57.36. After that, the instrument may fall with the target at 55.50 and form another consolidation range.
XAU USD, “Gold vs US Dollar”
Gold is still consolidating around 1265.30. Possibly, the price may break the range upwards and start a new correction with the target at 1276.80. Later, in our opinion, the market may form the fifth wave towards 1257.00.
BRENT
Brent has expanded its consolidation range to the downside and then moved back quickly. Possibly, today the price may test 52.00 from above and then grow towards 54.00. Later, in our opinion, the market may be corrected to return to 52.00 and then start another growth with the target at 55.00.
Attention! Forecasts presented in this section only reflect the author’s private opinion and should not be considered as guidance for trading. RoboForex LP bears no responsibility for trading results based on trading recommendations described in these analytical reviews.
At the H4 chart of EUR USD, the new Window to the upside is still open and provides support. Bearish Tower pattern indicates a descending correction. Three Line Break chart shows a bullish direction; Heiken Ashi candlesticks confirm a bearish pullback towards support from the new Window.
At the H1 chart of EUR USD, bearish Shooting Star patterns indicate that the descending correction continues. The upside Window provided support. Three Line Break chart and Heiken Ashi candlesticks indicate a bearish direction.
USD JPY, “US Dollar vs. Japanese Yen”
At the H4 chart of USD JPY, bullish Harami pattern indicates an ascending movement. Three Line Break chart shows a bearish direction; Heiken Ashi candlesticks confirm the ascending movement.
Attention! Forecasts presented in this section only reflect the author’s private opinion and should not be considered as guidance for trading. RoboForex LP bears no responsibility for trading results based on trading recommendations described in these analytical reviews.
The USD/JPY pair is trading upwards on Thursday after the April meeting of the Bank of Japan.
On Thursday, the Japanese yen is retreating against the USD. The current quote for the instrument is 111.37. This month’s low is at 108.10, high – 112.20, which are the borders of the mid-term trading range for the pair.
So, the two-day meeting of the BoJ was over today. The key rate remained unchanged, at -0.1%; all other fiscal parameters also remained intact. The regulator said that the QE program volume was still 80 trillion Yens. No further comments were made, and it means that the QE program will continue operating at the same volume.
However, the Bank of Japan revised and improved its economic outlook. For example, the regulator now expects the growth of the GDP this year by 1.6% y/y instead of 1.5% y/y. In 2018, the indicator is expected to expand by 1.3% y/y instead of 1.1% y/y.
Inflation expectations in 2017 are +1.4% (a bit worse that the preliminary estimation), in 2018 – +2%, which is the target of the regulator. The core inflation is expected to grow a bit slower.
The Yen hasn’t responded to the BoJ’s decisions yet. However, the comments of the regulator’s Governor, Mr. Kuroda, forced it retreat a little bit.
Attention! Forecasts presented in this section only reflect the author’s private opinion and should not be considered as guidance for trading. RoboForex LP bears no responsibility for trading results based on trading recommendations described in these analytical reviews.
Recently, President Trump signed his “Buy American, Hire American” executive order. Ironically, while the stated goal is to put “America First,” the White House may actually subsidize old industries and undermine innovation.
Recently, President Trump traveled to Wisconsin to sign the “Buy American, Hire American” executive order, which seeks to crack down on fraud and abuse of the skilled worker (H-1B) visa program.
Then, he traveled to Kenosha, Wisconsin, to sign the second part of the order, which calls for US government agencies to give preference to domestically produced products and for a 220-day study of US trade agreements that grant foreign companies the right to be treated as domestic companies.
The ceremony took place at the headquarters of Snap-on, a tool company. With applause from its employees, Trump said that his executive order would “minimize the use of waivers and maximize made-in-America content in all federal projects. In particular, the administration would crack down on “companies that used dumped steel to take work away from workers like you.”
But the order was also about domestic politics and the White House’s internal strife. And questions lingers about its economic implications.
The politics of “Buy American, Hire American”
When Trump arrived in the White House, some 45 percent of Americans approved the way he was handling his job as president, and another 45 percent disapproved. Today, almost 55 percent disapprove his performance, according to Gallup.
Moreover, some polls in the swing states, such as Wisconsin, indicated his approval ratings were under water. Clearly, it was high time for Trump to be seen as delivering his campaign pledges to American people.
There is also an internal White House angle to the story. Kenosha is a swing county that just happens to be the hometown of Trump’s chief of staff Reince Priebus, former chair of the Republican National Committee (RNC). Through the spring, the Trump loyalists have been dismayed by Priebus’s influence and alleged that his loyalties are to the RNC, and not to the president.
Trump could have picked many locations to showcase his executive order. Yet, the fact that he signed it in Kenosha, Wisconsin, suggests that he needs the RNC and a unified Republican Party to eventually undermine the ObamaCare (Patient Protection and Affordable Care Act), to launch the impending “massive tax cuts” and several other stated reforms.
The economics of “Buy American, Hire American”
Soon as Trump signed his executive order, it was criticized by Silicon Valley behemoths whose global success is predicated on high-skill foreign employees in America.
It also divided the US Chamber of Commerce and other business lobbyists, who believe that the H-1B needs changes, but should not be scrapped. The US should not “close the door on high-skilled workers from around the world who can contribute to American businesses’ growth and expansion,” they argue.
In economic terms, the “Buy American, Hire American” executive order is very much in line with the interests of the US steel industry, which has been a great beneficiary of “Buy American” legislation for decades.
It was also much supported by Trump’s trade adviser Dan DiMicco, former CEO of US steel giant Nucor, and Director of his National Trade Council Peter Navarro, a longtime supporter of US steel interests.
Indeed, the executive order can be seen as an effort to subsidize US steel industry as Chinese imports account for 25 percent of the US market. In this view, Trump’s proposed $1 trillion infrastructure initiative will boost steel and iron – which the White House would like to benefit mainly US interests, even against international agreements.
Jobs and value matter
According to US government data, in 2014, the iron and steel industry employed some 150,000 people generating some $113 billion in value. In turn, US high-tech industries employed some 17 million workers (12% of total employment) but contributed $7.1 trillion in terms of output (23% of total).
In modern history, advanced economies specialize in value-added industries, which require greater knowledge and productivity, while less-advanced countries seek catch-up growth through low-margin, low-value industries. The US is no exception, as evidenced by data from steel and knowledge industries.
Ironically, government policies that promote less-advanced sectors in the US economy may rally US steel stocks but risk harming America’s advanced industries, while alienating major US trade partners. Despite “America First” pledges, they may leave America second across attractive industries over time.
About the Author:
The author is the founder of Difference Group and has served as research director at the India, China and America Institute (USA) and visiting fellow at the Shanghai Institutes for International Studies (China) and the EU Center (Singapore).
The original, slightly shorter commentary was released by China Daily on April 26, 2017
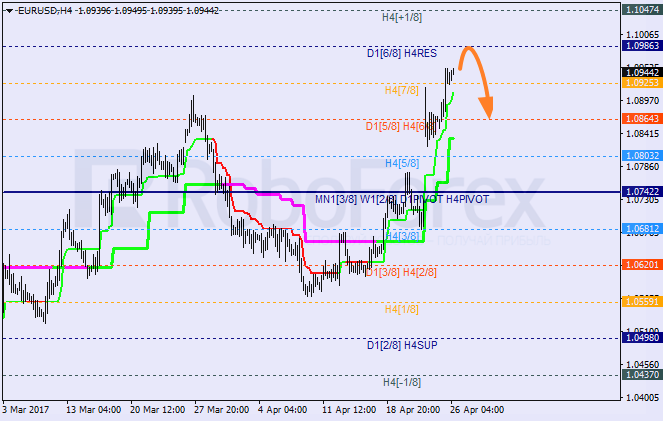
The EUR/USD pair finally managed to fix above the 7/8 level. As a result, in the nearest future the market may test the 8/8 level. If later the pair rebounds from this level, the pair may be corrected towards the 6/8 one.
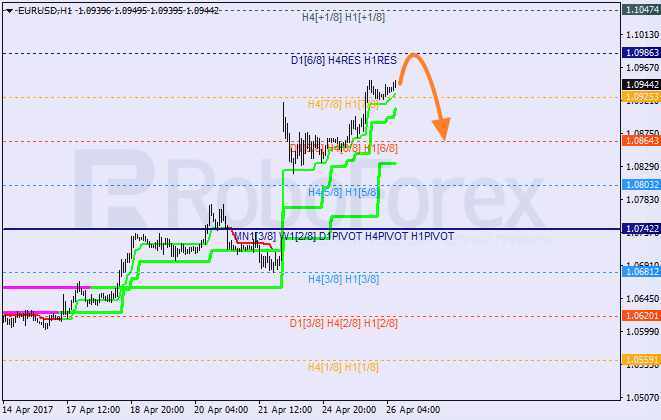
The lines at the H4 and H1 charts are completely the same. The current growth is supported by Super Trends. In the future, the market may reach the 8/8 level and start a new bearish correction.
USD CAD, “US Dollar vs Canadian Dollar”
The USD/CAD pair rebounded from the 8/8 level, which means that it may start a new correction. The closest target for bears is at the 4/8 level. After reaching it, the market may resume moving upwards.
At the H1 chart, the pair is trading between Super Trends. To confirm a new descending correction, the price has to has to fix below them. During the next several days, the market may fall towards the 4/8 level.
Attention! Forecasts presented in this section only reflect the author’s private opinion and should not be considered as guidance for trading. RoboForex LP bears no responsibility for trading results based on trading recommendations described in these analytical reviews.
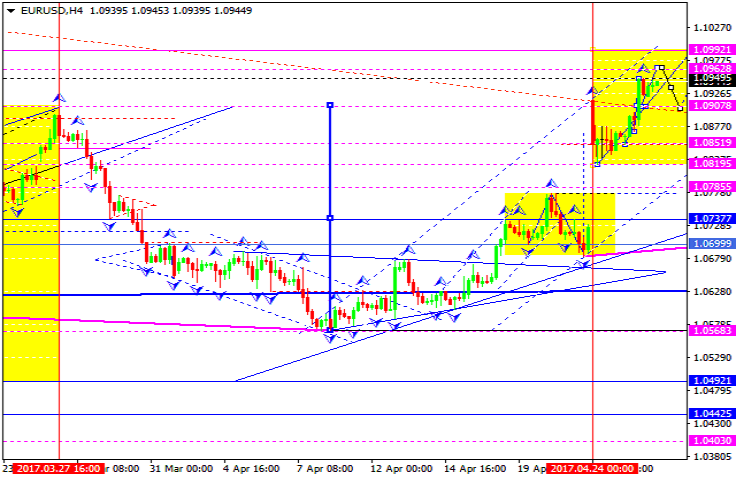
The EUR/USD pair is still forming its ascending structure. We think, today the price may reach 1.0962 and then fall towards 1.0907. All possible extensions to the upside should be considered as an alternative scenario. The market may start plummeting and resume the downtrend at any moment.
GBP USD, “Great Britain Pound vs US Dollar”
The GBP/USD pair has attempted to break 1.2845 upwards. Possibly, the price may reach 1.2900. All possible extensions to the upside should be considered as an alternative scenario. According to the main scenario, the price may continue falling towards 1.2700.
USD CHF, “US Dollar vs Swiss Franc”
The USD/CHF pair has reached the target of the fourth wave. Possibly, today the price may grow inside the first structure towards 1.0000. After that, the instrument may be corrected inside the second structure to reach 0.9955 and then continue moving upwards inside the fifth one with the target at 1.0055.
USD JPY, “US Dollar vs Japanese Yen”
The USD/JPY pair has broken its consolidation range upwards. Possibly, the price may reach 111.46 and then fall towards 110.52., thus forming another consolidation range. Later, in our opinion, the market may break it downwards and then continue falling with the first target at 109.60.
AUD USD, “Australian Dollar vs US Dollar”
The AUD/USD pair has completed another descending structure; it has almost formed another consolidation range in the form of the Triangle pattern. Possibly, today the price may choose an alternative scenario and form another ascending structure of the pattern with the target at 0.7559. However, according to the main scenario the price may break 0.7500 and then continue falling inside the downtrend with the target at 0.7408.
USD RUB, “US Dollar vs Russian Ruble”
The USD/RUB pair is consolidating. We think, today the price may fall to reach 55.50 or even extend this structure towards 54.50. After that, the instrument may form a reversal pattern to start a new correction with the target at 61.00.
XAU USD, “Gold vs US Dollar”
Gold has reached its local downside target. Possibly, today the price may grow towards 1275 and then form another descending structure with the target at 1257.
BRENT
Brent has reached the target of the descending wave; it has already completed the first ascending impulse along with the correction. The entire trading range may be considered as the Head & Shoulders reversal pattern. Possibly, the price may break the Neckline and reach the target at 54.00. Later, in our opinion, the market may consolidate and, probably, be corrected. After that, the instrument may start growing to reach the first target at 56.06.
Attention! Forecasts presented in this section only reflect the author’s private opinion and should not be considered as guidance for trading. RoboForex LP bears no responsibility for trading results based on trading recommendations described in these analytical reviews.
 By CountingPips.com – Get our weekly COT Reports by Email