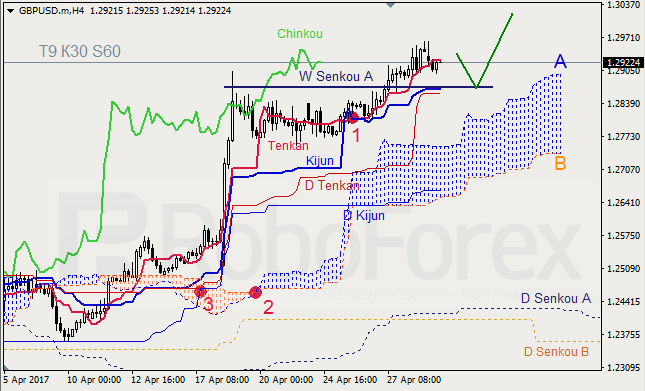
GBP USD, Time Frame H4. Indicator signals: Tenkan-Sen and Kijun-Sen are influenced by “Golden Cross” (1); D Tenkan-Sen and D Kijun-Sen are still influenced by D “Golden Cross” (3). Ichimoku Cloud is heading up (2), Chinkou Lagging Span is above the chart, and the price is on Tenkan-Sen. Short-term forecast: we can expect support from W Senkou Span A – Kijun-Sen, and a further growth of the price.
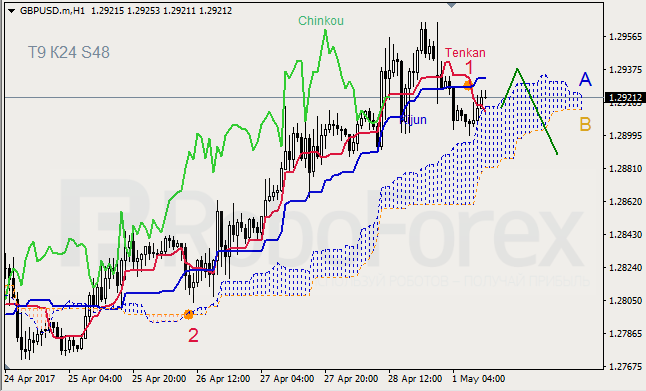
GBP USD, Time Frame H1. Indicator signals: Tenkan-Sen and Kijun-Sen intersected above Kumo Cloud and formed “Dead Cross” (1); Tenkan-Sen and Senkou Span A are directed downwards. Ichimoku Cloud is very narrow, but continues going up (2), Chinkou Lagging Span is on the chart, and the price is between Tenkan‑Sen and Kijun-Sen. Short-term forecast: we can expect resistance from Kijun-Sen, and decline of the price.
XAU USD, “Gold vs US Dollar”
XAU USD, Time Frame H4. Indicator signals: Tenkan-Sen and Kijun-Sen are still influenced by “Dead Cross” (1). Ichimoku Cloud is moving downwards, Chinkou Lagging Span is below the chart, and the price is below the lines. Short‑term forecast: we can expect resistance from D Kijun-Sen, and a further decline of the price towards W Tenkan-Sen.
Attention! Forecasts presented in this section only reflect the author’s private opinion and should not be considered as guidance for trading. RoboForex LP bears no responsibility for trading results based on trading recommendations described in these analytical reviews.
The EUR/USD pair has completed the descending impulse and right now is trading inside a narrow consolidation range. We think, today the price may fall to reach 1.0842. Later, in our opinion, the market may grow towards 1.0884 and then start another descending structure with the target at 1.0830. This wave is the first one.
GBP USD, “Great Britain Pound vs US Dollar”
Being under pressure, the GBP/USD pair is moving downwards. Possibly, the price may form another ascending structure to reach 1.2983. After that, the instrument may be corrected to the downside with the target at 1.2700.
USD CHF, “US Dollar vs Swiss Franc”
The USD/CHF pair has broken 0.9959 to the upside. Possibly, today the price may grow towards 0.9990. After that, the instrument may fall to reach 0.9960 and then continue moving upwards with the target at 1.0025. This wave is the first one.
USD JPY, “US Dollar vs Japanese Yen”
The USD/JPY pair is still consolidating at the top of the ascending wave. Possibly, today the price may reach 111.91 and then fall with the target at 109.01. Later, in our opinion, the market may be corrected towards 110.86.
AUD USD, “Australian Dollar vs US Dollar”
The AUD/USD pair is consolidating at its lows. Possibly, the price may break the range to the upside to start another correction with the target at 0.7532. Later, in our opinion, the market may fall to reach 0.7400.
USD RUB, “US Dollar vs Russian Ruble”
The USD/RUB pair is trading to rebound from 56.55. Possibly, the price may grow to reach 57.36. After that, the instrument may fall with the target at 55.50.
XAU USD, “Gold vs US Dollar”
Being under pressure, Gold is moving downwards. Possibly, the price may grow to reach 1272. Later, in our opinion, the market may move with the target at 1257.
BRENT
Brent has completed the ascending impulse and the correction. We think, today the price may grow to break 52.77. The local target is at 53.80. After that, the instrument may be corrected towards 52.80 and then start another growth with the target at 54.50. This wave is the first one.
Attention! Forecasts presented in this section only reflect the author’s private opinion and should not be considered as guidance for trading. RoboForex LP bears no responsibility for trading results based on trading recommendations described in these analytical reviews.
Over the past two weeks, the Euro has appreciated against the greenback by 2.79% to 1.0898. Two significant events took place between the 17th and 30th of April upon which the British and European currencies both strengthened against the US dollar.
On the 18th of April, the British pound became the driving force behind all currencies. By the end of the day, the GBP/USD rate had jumped by 400 pips to 1.2903. The closing of short positions on this instrument was triggered by British Prime Minister Theresa May’s announcement of a snap election on the 8th of June this year.
The Euro followed the pound upwards but due to a fall on the EUR/GBP cross, the Euro’s growth against the dollar was 4 times smaller than that of the pound. The Euro the closed the gap of the 24th of April, breaking 1.0900 in the wake of Emmanuel Macron’s victory in the first round of France’s presidential election. The morning gap was 195 pips.
On Friday, trading on the Euro closed slightly up. It traded within a range of about 100 pips. The Euro’s rally was brought about in the first half of the day by some positive inflation data from the Eurozone and disappointing GDP figures from the UK.
Inflation almost reached its target of 2.0% for the year. It will now be difficult for the ECB to justify the continuation of their quantitative easing program. The EUR/USD rose to the 1.0947 mark during the European session; a whole 90 pips higher than the Asian minimum of 1.0857.
The EUR/GBP pair has renewed its weekly minimum at the beginning of the European session, and subsequently restored to 0.8462 after the UK’s disappointing GDP data release.
After the publication of consumer confidence and GDP reports in the US, the Euro lost half of its daily gains. The reports came out worse than expected. According to news reports, traders had been focusing their attention on the GDP price index, which came out at 2.3% against a forecast of 2.0% and a previous reading of 2.1%. I believe that interest in the Euro has abated due to the May holidays.
US statistics:
The Michigan University consumer sentiment index came out at 97.0 (forecast: 98.0, previous reading: 98.0);
Preliminary GDP figures from the US show 0.7% QoQ growth for the first quarter of 2017 (forecast: 1.2% QoQ, previous reading: 2.1% QoQ);
The Chicago PMI business activity index came out at 58.3 (forecast: 56.4, previous reading: 57.7).
Market expectations:
Some unfavourable statistics came out in China on Friday. Business activity in the manufacturing and service sectors did not meet market expectations. The reaction to this as currency markets opened was muted.
On Monday, European exchanges are closed due to International Workers’ Day. This day is being observed in Switzerland, the UK, Singapore, Hong Kong and Russia among others.
After the first round of the French election, activity on currency markets fell. Traders await the results of the second round, which will take place on the 7th of May. Because of this, the Euro has been caught within a horizontal range from 1.0850 to 1.0950 over the past week.
Given that today is a public holiday, and that the market is thin, I’m expecting to see some price fluctuations within Friday’s range with the 1.0840 – 1.0850 zone acting as a support for buyers.
Day’s news (GMT+3):
Europe: International Workers’ Day;
09:30 Australia: RBS commodity index SDR (YoY) (Apr);
10:15 Switzerland: real retail sales (Mar);
12:00 Eurozone: European Commission releases economic growth forecasts;
14:45 USA: Treasury sec Mnuchin’s speech;
15:30 USA: core personal consumption expenditure – price index (Mar), personal spending (Mar), personal income (Mar);
16:30 Canada: RBC manufacturing PMI (Mar);
16:45 USA: Markit manufacturing PMI (Mar);
17:00 USA: ISM manufacturing PMI (Mar), ISM prices paid (Mar);
On Friday, 70% of the day’s trade volume occurred within a range from 1.0883 to 1.0932. This was considered fair by both buyers and sellers. The highest volume and highest amount of trading activity for the day was found at 1.0897 level. So, this was found to be the fairest price for the day.
If the price exits this range below 1.0833, it could make buyers vulnerable. There is a strong support at 1.0840/1.0850. If buyers don’t turn up at this level, both buyers and sellers will have to find a new fair price for the May holidays.
Sellers closed the gap from the 24th of April by 50%. Considering that Le Pen has made it into the second round of voting, the Euro will be jittery this week. Investors fear that Russian hackers will lead her to victory. Admittedly, this week’s payrolls will be of little interest to traders as they all focus on the election.
I’m expecting a V-model to form on the daily with a minimum of 1.0855 and a maximum of 1.0917. Activity on the market should be higher during the US session.
Positives for the Euro (+):
Fundamental:
(+) US president Donald Trump favours a weaker dollar;
(+) French elections: Emmanuel Macron won the first round of voting by a small margin;
(+) S&P has reaffirmed Germany’s credit rating at AAA/A-1+ with a stable outlook;
Technical (short-term):
(+) Small speculators have increased long positions by 4,253 to 66,753 contracts and short positions by 493 to 61,457 contracts. net-long positions have grown from 3,759 to 5,296 contracts;
(+) According to myfxbook, the Short/Long ratio as of 6:15 EET is 71%/28%, lots: 9912/3929 (previous day: n/a/n/a), positions: 29755/12793 (previous day: n/a/n/a);
(+) US 10Y bond yields: 2.289% (down 0.47% from 28/04/17);
(+) EURGBP (D): AO, AC – up;
(+) EURUSD (M): Stochastic (5,3,3), CCI (20) – up;
(-) ECB head: revision of ECB’s monetary policy not required at present;
(-) On Friday, the 28th of April, according to CME Group’s FedWatch, the probability of a rate hike in Mat has risen from 4.3% to 5.3%, has fallen in June from 70.6% to 66.6% and in July from 73.5% to 70.3%;
(-) Tension surrounding the situation with North Korea. Increased demand for safe haven assets;
(-) The US Congress has approved a temporary budget, avoiding a government shutdown for the time being. A week’s delay will give time for knocking out a draft budget for the rest of the fiscal year (end of September). It became clear on the 1st of May that Republicans and Democrats had settled on a compromise to keep the budget going until the 30th of September;
Technical (short-term):
(-) According to data from 25/04/17, Large speculators on the Chicago Exchange have reduced their long and short positions. There are currently more short positions than longs. Long positions have fallen by 32,054 to 153,394 contracts, while short positions have fallen by 25,030 to 181,340 contracts. Net-short positions have increased from 7,023 to 27,946 contracts;
(-) German 10Y bond yields: 0.321 (up 7.0% from 28/04/17);
(-) US 10Y bond yields in the US have risen by 0.55% to 2.295%;
Here is a short summary and this week’s links (below) to the latest Commitment of Traders changes.
Speculators just barely edged their bullish bets of the US dollar lower last week as the recent weekly changes remain subdued
WTI Crude speculators sharply dropped their bullish bets last week following three weeks of gains
The 10-year note speculators dramatically reversed their positions to a new net bullish position with a huge weekly jump in bullish bets (+255,942 gain in bets last week)
Gold speculators continued to boost their bullish bets higher for the 6th week and to highest level since November
Silver bets declined for a second straight week after reaching a record high bullish position on April 11th
Copper speculative bets continued to drop for the 11th out of the last 12 weeks
Large S&P500 speculative bets rebounded after three down weeks
US Dollar net speculator positions leveled at $15.29 billion last week
The latest data for the weekly Commitment of Traders (COT) report, released by the Commodity Futures Trading Commission (CFTC) on Friday, showed that large traders and currency speculators just barely reduced their bullish bets for the US dollar last week. See full article
The non-commercial contracts of WTI crude futures totaled a net position of 411,822 contracts, according to data from last week. This was a drop of -32,061 contracts from the previous weekly total. See full article
The large speculator contracts of gold futures advanced to a total net position of 200,677 contracts. This was a weekly rise of 4,909 contracts from the previous week. See full article
The large speculator contracts of 10-year treasury note futures totaled a net bullish position of 214,642 contracts. This was a weekly turnaround of 255,942 contracts from the previous week. See full article
The large speculator contracts of S&P 500 futures totaled a net position of 4,238 contracts. This was a rise of 1,775 contracts from the reported data of the previous week. See full article
The non-commercial contracts of silver futures totaled a net position of 93,613 contracts, according to data from last week. This was a weekly decline of -10,274 contracts from the previous totals. See full article
The large speculator contracts of copper futures totaled a net position of 12,458 contracts. This was a weekly shortfall of -3,585 contracts from the data of the previous week. See full article
The Commitment of Traders report data is published in raw form every Friday by the Commodity Futures Trading Commission (CFTC) and shows the futures positions of market participants as of the previous Tuesday (data is reported 3 days behind).
US Dollar net speculator positions edged lower to $15.29 billion last week
The latest data for the weekly Commitment of Traders (COT) report, released by the Commodity Futures Trading Commission (CFTC) on Friday, showed that large traders and currency speculators just barely reduced their bullish bets for the US dollar last week.
Non-commercial large futures traders, including hedge funds and large speculators, had an overall US dollar long position totaling $15.29 billion as of Tuesday April 25th, according to the latest data from the CFTC and dollar amount calculations by Reuters. This was a weekly decline of $-0.05 billion from the $15.34 billion total long position that was registered the previous week, according to the Reuters calculation (totals of the US dollar contracts against the combined contracts of the euro, British pound, Japanese yen, Australian dollar, Canadian dollar and the Swiss franc).
The aggregate US dollar speculator position continues to show a very muted weekly change for the fourth consecutive week. Weekly changes have remained under $1 billion ever since a $-3.17 billion decline on March 28th. The overall aggregate bullish level continues to hover right around $15 billion for the fifth straight week.
Weekly Speculator Contract Changes:
The major currencies that improved against the US dollar last week were the euro (754 weekly change in contracts), British pound sterling (8,308 contracts), Japanese yen (3,594 contracts) and the Mexican peso (1,794 contracts).
The currencies whose speculative bets declined last week versus the dollar were the Swiss franc (-3,515 weekly change in contracts), Canadian dollar (-9,390 contracts), Australian dollar (-560 contracts) and the New Zealand dollar (-398 contracts).
Table of Weekly Commercial Traders and Speculators Levels & Changes:
Currency
Net Commercials
Comms Weekly Chg
Net Speculators
Specs Weekly Chg
EuroFx
13789
-6559
-20895
754
GBP
92281
-12931
-91182
8308
JPY
33802
-4326
-26869
3594
CHF
25947
723
-17317
-3515
CAD
52745
10578
-42642
-9390
AUD
-41869
4564
42702
-560
NZD
16555
798
-15404
-398
MXN
-20424
-320
16038
1794
This latest COT data is through Tuesday and shows a quick view of how large speculators or non-commercials (for-profit traders) as well as the commercial traders (hedgers & traders for business purposes) were positioned in the futures markets. All currency positions are in direct relation to the US dollar where, for example, a bet for the euro is a bet that the euro will rise versus the dollar while a bet against the euro will be a bet that the dollar will gain versus the euro.
Weekly Charts: Large Trader Weekly Positions vs Price
EuroFX:
British Pound Sterling:
Japanese Yen:
Swiss Franc:
Canadian Dollar:
Australian Dollar:
New Zealand Dollar:
Mexican Peso:
*COT Report: The weekly commitment of traders report summarizes the total trader positions for open contracts in the futures trading markets. The CFTC categorizes trader positions according to commercial hedgers (traders who use futures contracts for hedging as part of the business), non-commercials (large traders who speculate to realize trading profits) and nonreportable traders (usually small traders/speculators). Find CFTC criteria here: (http://www.cftc.gov/MarketReports/CommitmentsofTraders/ExplanatoryNotes/index.htm).
The Commitment of Traders report is published every Friday by the Commodity Futures Trading Commission (CFTC) and shows futures positions data that was reported as of the previous Tuesday (3 days behind).
Each currency contract is a quote for that currency directly against the U.S. dollar, a net short amount of contracts means that more speculators are betting that currency to fall against the dollar and a net long position expect that currency to rise versus the dollar.
(The charts overlay the forex closing price of each Tuesday when COT trader positions are reported for each corresponding spot currency pair.) See more information and explanation on the weekly COT report from the CFTC website.
Large speculators and traders sharply decreased their net positions in the WTI crude oil futures markets last week following three weeks of gains, according to the latest Commitment of Traders (COT) data released by the Commodity Futures Trading Commission (CFTC) on Friday.
The non-commercial contracts of WTI crude futures, traded by large speculators and hedge funds, totaled a net position of 411,822 contracts in the data reported through April 25th. This was a weekly fall of -32,061 contracts from the previous week which had a total of 443,883 net contracts.
Speculators had built up their bullish net position over the past three weeks and remain highly bullish (over +400,000 contracts) in their net positions despite last week’s sharp decline.
WTI Crude Oil Commercial Positions:
The commercial traders position, categorized by the CFTC as hedgers or traders engaged in buying and selling for business purposes, totaled a net position of -433,625 contracts last week. This is a weekly change of 11,625 contracts from the total net of -445,250 contracts reported the previous week.
USO Crude Oil ETF:
Over the same weekly reporting time-frame, from Tuesday to Tuesday, the USO Crude Oil ETF, which tracks the price of WTI crude oil, closed at approximately $10.36 which was a decline of $-0.68 from the previous close of $11.04, according to ETF market data.
*COT Report: The COT data, released weekly to the public each Friday, is updated through the previous Tuesday (data is 3 days old) and shows a quick view of how large speculators or non-commercials (for-profit traders) as well as the commercial traders (hedgers & traders for business purposes) were positioned in the futures markets. The CFTC categorizes trader positions according to commercial hedgers (traders who use futures contracts for hedging as part of the business), non-commercials (large traders who speculate to realize trading profits) and nonreportable traders (usually small traders/speculators). Find CFTC criteria here: (http://www.cftc.gov/MarketReports/CommitmentsofTraders/ExplanatoryNotes/index.htm).
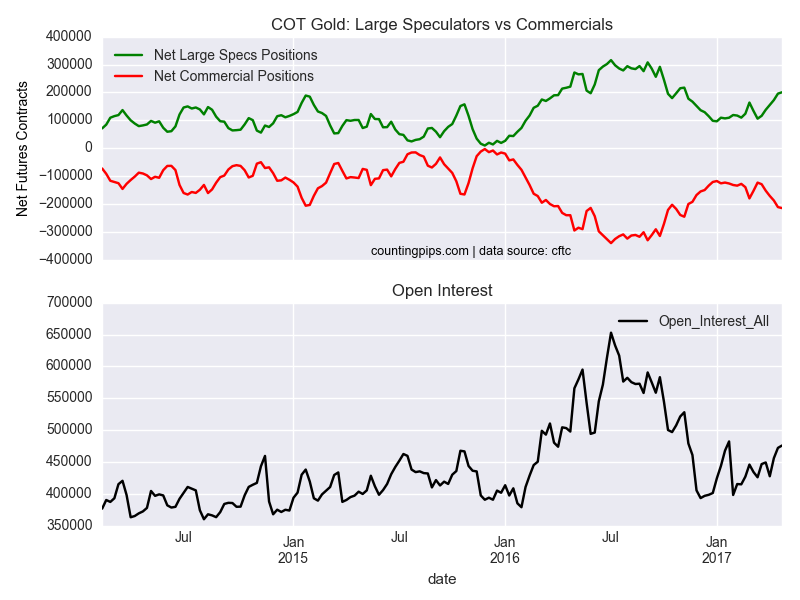
Large speculators and traders increased their net bulish positions in the gold futures markets last week for a sixth consecutive week and to the highest level since November, according to the latest Commitment of Traders (COT) data released by the Commodity Futures Trading Commission (CFTC) on Friday.
The non-commercial futures contracts of Comex gold futures, traded by large speculators and hedge funds, totaled a net position of 200,677 contracts in the data reported through April 25th. This was a weekly gain of 4,909 contracts from the previous week which had a total of 195,768 net contracts.
Gold speculative bullish bets are now above the +200,000 level and at the highest level since November 8th when net bullish positions totaled +217,238 contracts.
Gold Commercial Positions:
The commercial traders position, categorized by the CFTC as hedgers or traders engaged in buying and selling for business purposes, totaled a net position of -214,580 contracts last week. This is a weekly change of -3,516 contracts from the total net of -211,064 contracts reported the previous week.
Gold ETF:
Over the same weekly reporting time-frame, from Tuesday to Tuesday, the GLD ETF, which tracks the price of gold, closed at approximately $120.25 which was a drop of $-2.57 from the previous close of $122.82, according to ETF financial market data.
*COT Report: The COT data, released weekly to the public each Friday, is updated through the previous Tuesday (data is 3 days old) and shows a quick view of how large speculators or non-commercials (for-profit traders) as well as the commercial traders (hedgers & traders for business purposes) were positioned in the futures markets. The CFTC categorizes trader positions according to commercial hedgers (traders who use futures contracts for hedging as part of the business), non-commercials (large traders who speculate to realize trading profits) and nonreportable traders (usually small traders/speculators). Find CFTC criteria here: (http://www.cftc.gov/MarketReports/CommitmentsofTraders/ExplanatoryNotes/index.htm).
Large speculators and traders sharply increased their bets in favor of the 10-year treasury notes after being on the short side of this market for approximately the past five months, according to the latest Commitment of Traders (COT) data released by the Commodity Futures Trading Commission (CFTC) on Friday.
The non-commercial futures contracts of 10-year treasury note futures, traded by large speculators and hedge funds, totaled a net position of 214,642 contracts in the data reported through April 25th. This was a weekly jump of 255,942 contracts from the previous week which had seen a total of -41,300 net contracts.
The abrupt shift in the speculators positions follows a steady deterioration of their bearish bets after reaching an all-time record high in bearish positions of -409,659 net contracts on February 28th. Speculators now have a net long position for the first time since November 22nd.
10 Year Treasury Note Commercial Positions:
The commercial traders position, categorized by the CFTC as hedgers or traders engaged in buying and selling for business purposes, totaled a net position of -56,005 contracts last week. This is a weekly change of -253,008 contracts from the total net of 197,003 contracts reported the previous week.
IEF 7-10 Year Bond ETF:
Over the same weekly reporting time-frame, from Tuesday to Tuesday, the 7-10 Year Treasury Bond ETF (IEF) closed at approximately $106.14 which was a decline of $-1.24 from the previous close of $107.38, according to ETF market data.
*COT Report: The COT data, released weekly to the public each Friday, is updated through the previous Tuesday (data is 3 days old) and shows a quick view of how large speculators or non-commercials (for-profit traders) as well as the commercial traders (hedgers & traders for business purposes) were positioned in the futures markets. The CFTC categorizes trader positions according to commercial hedgers (traders who use futures contracts for hedging as part of the business), non-commercials (large traders who speculate to realize trading profits) and nonreportable traders (usually small traders/speculators). Find CFTC criteria here: (http://www.cftc.gov/MarketReports/CommitmentsofTraders/ExplanatoryNotes/index.htm).
Large speculators and traders raised their bullish net positions in the S&P500 stock futures markets last week following three weeks of decline, according to the latest Commitment of Traders (COT) data released by the Commodity Futures Trading Commission (CFTC) on Friday.
The non-commercial futures contracts of S&P500 futures, traded by large speculators and hedge funds, totaled a net position of 4,238 contracts in the data reported through April 25th. This was a weekly rise of 1,775 contracts from the previous week which had a total of 2,463 net contracts.
Large speculative bets on the SP500 had fallen by approximately -10,000 contracts over the previous three weeks before last week’s rebound.
S&P500 Commercial Positions:
The commercial traders position, categorized by the CFTC as hedgers or traders engaged in buying and selling for business purposes, totaled a net position of -11,356 contracts last week. This is a weekly change of -5,407 contracts from the total net of -5,949 contracts reported the previous week.
S&P500 Stock Market Index:
Over the same weekly reporting time-frame, from Tuesday to Tuesday, the S&P500 index closed at approximately 2388.61 which was a gain of 46.42 from the previous close of 2342.18, according to market data.
*COT Report: The COT data, released weekly to the public each Friday, is updated through the previous Tuesday (data is 3 days old) and shows a quick view of how large speculators or non-commercials (for-profit traders) as well as the commercial traders (hedgers & traders for business purposes) were positioned in the futures markets. The CFTC categorizes trader positions according to commercial hedgers (traders who use futures contracts for hedging as part of the business), non-commercials (large traders who speculate to realize trading profits) and nonreportable traders (usually small traders/speculators). Find CFTC criteria here: (http://www.cftc.gov/MarketReports/CommitmentsofTraders/ExplanatoryNotes/index.htm).
Large speculators and traders cut back on their bullish net positions in the silver futures markets last week for a second straight week, according to the latest Commitment of Traders (COT) data released by the Commodity Futures Trading Commission (CFTC) on Friday.
The non-commercial futures contracts of Comex silver futures, traded by large speculators and hedge funds, totaled a net position of 93,613 contracts in the data reported through April 25th. This was a weekly decline of -10,274 contracts from the previous week which had a total of 103,887 net contracts.
Speculative positions have now fallen under the +100,000 contract level for the first time in four weeks and two weeks after recording an all time record high net bullish position at +105,515 contracts on April 11th.
Silver Commercial Positions:
The commercial traders position, categorized by the CFTC as hedgers or traders engaged in buying and selling for business purposes, totaled a net position of -108,089 contracts last week. This is a weekly change of 8,743 contracts from the total net of -116,832 contracts reported the previous week.
Silver ETF:
Over the same weekly reporting time-frame, from Tuesday to Tuesday, the SLV ishares ETF, which tracks the price of silver, closed at approximately $16.68 which was a fall of $-0.66 from the previous close of $17.34, according to ETF financial market data.
*COT Report: The weekly commitment of traders report summarizes the total trader positions for open contracts in the futures trading markets. The CFTC categorizes trader positions according to commercial hedgers (traders who use futures contracts for hedging as part of the business), non-commercials (large traders who speculate to realize trading profits) and nonreportable traders (usually small traders/speculators). Find CFTC criteria here: (http://www.cftc.gov/MarketReports/CommitmentsofTraders/ExplanatoryNotes/index.htm).