GBP USD, Time Frame H4. Indicator signals: Tenkan-Sen and Kijun-Sen intersected above Kumo Cloud and formed “Dead Cross” (1). Ichimoku Cloud is closed (2), Chinkou Lagging Span crossed the chart to the downside, and the price is near Kumo’s downside border. Short-term forecast: we can expect resistance from Senkou Span B, and decline of the price towards support from W Senkou Span A.
GBP USD, Time Frame H1. Indicator signals: Tenkan-Sen and Kijun-Sen are influenced by “Dead Cross” (1); Kijun-Sen is directed downwards. Ichimoku Cloud is going down (2), Chinkou Lagging Span is on the chart, and the price is below the lines. Short-term forecast: we can expect resistance from the cloud’s downside border, and decline of the price.
XAU USD, “Gold vs US Dollar”
XAU USD, Time Frame H4. Indicator signals: Tenkan-Sen and Kijun-Sen are very close to each other below Kumo Cloud, they may intersect and form “Golden Cross” (1). Ichimoku Cloud is moving downwards (2), Chinkou Lagging Span is on the chart, and the price is below the cloud. Short‑term forecast: we can expect support from Kijun-Sen, and the price to be corrected towards resistance from Senkou Span A.
Attention! Forecasts presented in this section only reflect the author’s private opinion and should not be considered as guidance for trading. RoboForex LP bears no responsibility for trading results based on trading recommendations described in these analytical reviews.
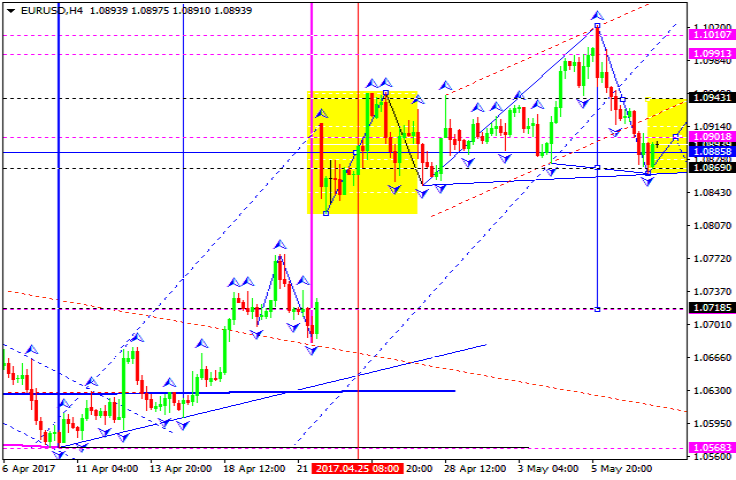
The EUR/USD pair has broken the low of its consolidation range and returned to 1.0868. We think, today the price may fall to break the lows. After breaking them, the market may continue falling inside the downtrend to reach 1.0720. An alternative scenario suggests that the instrument may be corrected towards 1.0949.
GBP USD, “Great Britain Pound vs US Dollar”
The GBP/USD pair has broken its consolidation range to the downside; it has reached the local target and returned to the broken border of the range. Later, in our opinion, the market may continue falling with the target at 1.2812 and then start another growth to reach 1.2899.
USD CHF, “US Dollar vs Swiss Franc”
The USD/CHF pair continues consolidating around 1.0071. If later the price breaks this consolidation range to the upside, the instrument may grow towards 1.0164; if to the downside – start another correction with the target at 1.0012 (an alternative scenario).
USD JPY, “US Dollar vs Japanese Yen”
The USD/JPY pair is consolidating; it has expanded the range. Possibly, the price may form another ascending structure to expand the range to the upside. In fact, the instrument is expected to form the Diamond reversal pattern at the top of the ascending wave. The main scenario implies that the market may break the downside border of the range and continue falling inside the downtrend. The first target is at 112.00.
AUD USD, “Australian Dollar vs US Dollar”
The AUD/USD pair is trading below 0.7397. Possibly, the price may test this level from below once again. After that, the downtrend may continue. The target is at 0.7220.
USD RUB, “US Dollar vs Russian Ruble”
The USD/RUB pair may grow to reach 57.56 today. After that, the instrument may fall towards 56.40 and then continue moving upwards with the target at 57.56.
XAU USD, “Gold vs US Dollar”
Gold is still forming the ascending impulse. Possibly, today the price may form the second structure towards 1233. Later, in our opinion, the market may continue moving downwards with the target at 1225 and then grow to reach 1235.
BRENT
Brent has reached the target of the ascending wave and right now is consolidating at the top of the wave. Possibly, the price may be corrected towards 48.82. If the market breaks this level to the upside, it may continue growing inside the uptrend with the target at 53.00.
Attention! Forecasts presented in this section only reflect the author’s private opinion and should not be considered as guidance for trading. RoboForex LP bears no responsibility for trading results based on trading recommendations described in these analytical reviews.
The Euro/dollar pair closed slightly down after trading on Thursday. The market closed the daily candlestick at the middle of its intraday range at 1.0866 level.
The British pound fell during the European session, bringing the other major currencies down with it after the Bank of England’s meeting. The Euro, however, was saved from falling by growth on the EUR/GBP cross. The Euro subsequently fell against the dollar to 1.0839 in response to positive unemployment and consumer price inflation figures coming out of the US.
Sellers were unable to gain a foothold on the lows as the technical picture on the hourly timeframe was indicating an upwards price rebound on three different grounds. It so happened that a drop in US 10Y bond yields to 2.382% helped buyers to realise their own plan.
According to the latest data from CME Group’s FedWatch, the probability of interest rates being raised by the Fed in June is still at 83.1%. The probability in July has slipped from 84.7% to 84.4% and in September from 91.8% to 90.4%.
Market expectations:
Trading has stabilised at around 1.0867 level. The daily candlestick from the 11th of May has a range of 54 pips. This means that the price could return to yesterday’s low. As there are three bases for this on the hourly timeframe, today I’m predicting a rise for the Euro in the form of a correction to 1.0891.
On Friday, traders will be focusing their attention on data coming out from Germany, the Eurozone and the USA. Most interesting for them will be the US statistics on consumer price inflation and retail sales. Accelerated inflation would increase the probability of interest rates being raised in June. Right now, that probability is 83.1%.
Day’s news (GMT+3):
09:00 Germany: preliminary GDP growth (Q1), CPI (Apr);
Because of the upwards rebound from the low of 1.0839 on the hourly timeframe, a V-model has formed. Buyers weren’t strong enough to close the day at around 1.0855, so it’s a weak model for a reversal. There’s a risk of the rate returning to 1.0839.
On three bases (1.0863, 1.0853 and 1.0839), I’m expecting quotes to rise to 1.0891 (45 degrees from 1.0839). Given that the Stochastic oscillator is in the sell zone, the rate should start to rise from 1.0855. A market drop will also reveal the intentions of the Euro-bulls.
If the price starts rising as European markets open, then it’s worth considering a breakout of the channel with a target of 1.0900 by 15:00 (MT4).
Positives for the Euro (+):
Fundamental:
(+) US president Donald Trump favours a weaker dollar;
Technical (short-term):
(+) According to data from 02/05/17, large speculators on the Chicago exchange have reduced short positions and slightly increased long positions. Long positions have gone up by 1,987 to 155,381 contracts and short positions have been reduced by 19,029 to 162,311 contracts. Net-short positions have fallen from 21,016 to 6,930 contracts;
(+) According to myfxbook, the Short/Long ratio as of 7:07 EET is 54%/45%, lots: 12416/10419 (previous day: 13961/12380), positions: 37879/29015 (previous day: 40730/35879);
(+) German 10Y bond yields: 0.431% (up 0% from 11/05/17);
(+) EURGBP (W): Stochastic (5,3,3), AC, CCI (20) – up;
(-) ECB head: revision of ECB’s monetary policy not required at present. On the 10th of May, he added that the bank is in no hurry to raise interest rates or to halt its asset purchasing program;
(-) On Thursday, the 11th of May, according to CME Group’s FedWatch, the probability of a rate hike in June remains 83.1%. The probability in July has fallen from 84.7% to 84.4% and in September from 91.8% to 90.4%;
Technical (short-term):
(-) Small speculators have reduced their short positions by 3,768 to 62,985 contracts. Short positions have fallen by 2,147 to 63,604 contracts. Last week, the number of open short positions surpassed that of long positions. Net-short positions currently stand at 619 contracts;
(-) US 10Y bond yields: 2.401% (up 0.5% from 10/05/17);
(-) Tension surrounding the situation with North Korea. Increased demand for safe haven assets;
(-) The US Congress has approved a temporary budget, avoiding a government shutdown for the time being. A week’s delay will give time for knocking out a draft budget for the rest of the fiscal year (end of September). It became clear on the 1st of May that Republicans and Democrats had settled on a compromise to keep the budget going until the 30th of September;
(+) Emmanuel Macron is France’s president-elect;
(+) S&P has reaffirmed Germany’s credit rating at AAA/A-1+ with a stable outlook.
The EUR/USD pair rebounded from the group of upside fibo-levels and started a new descending correction. The closest target for bears is the area at 1.0825. If later the price breaks this area, the current correction may continue up to the retracement of 50% (1.0755).
At the H1 chart, the pair is being corrected to the upside with the closest target at 1.0915 (the retracement of 38.2%). If later the pair rebounds from this area, the market may resume falling and break the previous low.
EUR GBP, “Euro vs Great Britain Pound”
The EUR/GBP pair is trying to rebound from the group of downside fibo-levels, which already provided support earlier. As a result, in the nearest future the market may resume moving upwards to reach the area at 0.8685 – 0.8715.
As we сan see at the H1 chart, the pair failed to fix below the correctional retracement of 61.8% at 0.8395. Consequently, on Thursday the market may continue its ascending movement towards the closest group of retracements at 0.8490.
Attention! Forecasts presented in this section only reflect the author’s private opinion and should not be considered as guidance for trading. RoboForex LP bears no responsibility for trading results based on trading recommendations described in these analytical reviews.
Possibly, the EUR/USD pair completed the double zigzag in the wave [a] of [w], which means that the price may resume moving downwards. As a result, during the next several days the market may form the descending impulse in the wave (a).
As we сan see at the H1 chart, the pair completed the diagonal triangle in the wave c of (y) and then the bearish impulse in the wave i. On Thursday, after completing the local correction, the market may resume falling in the wave iii of (a).
GBP USD, “Great Britain Pound vs US Dollar”
The GBP/USD pair is about to complete the extension in the wave [iii]. In the nearest future, the market may yet reach a new local high, but then the price is expected to start a new descending correction in the wave [iv] of C.
More detailed structure is shown on the H1 chart. It’s highly likely that the wave (v) of [iii] is taking the form of the diagonal triangle. Right now, the pair is completing the fourth wave of the pattern. Consequently, on Thursday the market may continue growing in the wave v or (v) and test the triangle’s upside border.
USD JPY, “US Dollar vs Japanese Yen”
At the H4 chart, the USD/JPY pair is about to complete the bullish impulse in the wave (i). On Thursday, the market may break the local high, but later the price is expected to start a new descending correction in the wave (ii).
As we сan see at the H1 chart, the pair lacks only one ascending impulse to complete the wave iii. Consequently, after finishing the local correction, the market may form another bullish impulse in the wave v of (i).
AUD USD, “Australian Dollar vs US Dollar”
The AUD/USD pair finished the wave [ii] in the form of the flat. Right now, the price is forming the descending extension in the wave [iii], which may later be followed by another local correction and a further decline in the wave (iii).
More detailed structure is shown on the H1 chart. During the next several hours, the market may continue forming the wave ii in the form of the zigzag. As a result, after breaking the local high, the price may resume its decline in the wave iii of (iii).
Attention! Forecasts presented in this section only reflect the author’s private opinion and should not be considered as guidance for trading. RoboForex LP bears no responsibility for trading results based on trading recommendations described in these analytical reviews.
Trading on the Euro closed down on Wednesday. Our currency pair traded at 1.0869 for 7 hours before falling to 1.0853 on the back of a sharp rise in US 10Y bond yields. As bond yields started to fall in Asia, the price returned to 1.0871 level.
Head of the ECB, Mario Draghi, wasn’t able to unhook the Euro from its price level of 1.0869. Draghi said in his statement that the bank is in no hurry to raise interest rates or to reverse its assets purchase program. The struggle with inflation goes on.
Market expectations:
On Wednesday, sellers allowed buyers to return to the trend line (1.0898), which was broken through on the 9th of May. The Euro subsequently renewed its weekly minimum as the dollar rose across the board.
At the time of writing, the Euro is trading at 1.0872 USD. The single currency appreciated in Asia after its slide to 1.0853. This morning’s trading is following the same dynamics as yesterday’s. That’s not to say that today’s price movements will coincide completely with those on the 10th of May.
It’s clear to see that the Euro is reluctantly retreating. I believe that sellers will update the minimum, from which they will cash in on short positions. I’ve chosen a modest target of 1.0844, although in the moment, the price could slip as far as 1.0822 (50% of the gap that appeared after the first round of the French presidential election on the 24th of April).
In addition, the Bank of England will hold a meeting today. This is expected to produce some high volatility on the EUR/GBP cross. Depending on the direction of the cross and on US bond yields, traders will open their positions accordingly.
Day’s news (GMT+3):
08:00 Japan: Eco Watchers Survey (Apr);
09:00 Germany: wholesale price index (Apr);
10:15 Switzerland: CPI (Apr);
11:00 Eurozone: ECB economic bulletin;
11:30 UK: manufacturing production (Mar), trade balance (Mar), industrial production (Mar);
Trading on the Euro closed down on Wednesday by an insignificant amount. US 10Y bond yields, which surged to 2.417%, put pressure on buyers. Now bond yields are declining (2.397%) and so the Euro has restored to 1.0872.
Some bullish divergences have formed on the CCI and AO hourly indicators. These are signals of an imminent correction. Given that no major buyers entered the market yesterday, I’m expecting the Euro/dollar pair to update its minimum to 1.0844. Clearly, buyers are waiting for more attractive prices in order to profit from the correction. The 157th degree runs through 1.0838 level.
Positives for the Euro (+):
Fundamental:
(+) US president Donald Trump favours a weaker dollar;
Technical (short-term):
(+) According to data from 02/05/17, large speculators on the Chicago exchange have reduced short positions and slightly increased long positions. Long positions have gone up by 1,987 to 155,381 contracts and short positions have been reduced by 19,029 to 162,311 contracts. Net-short positions have fallen from 21,016 to 6,930 contracts;
(+) According to myfxbook, the Short/Long ratio as of 7:01 EET is 53%/47%, lots: 13961/12380 (previous day: 10452/9000), positions: 40730/35879 (previous day: 35485/25987);
(+) German 10Y bond yields: 0.431% (up 1.17% from 10/05/17);
(+) EURGBP (W): Stochastic (5,3,3), AC, CCI (20) – down;
(-) ECB head: revision of ECB’s monetary policy not required at present;
(-) On Tuesday, the 9th of May, according to CME Group’s FedWatch, the probability of a rate hike in June remains 83.1%. The probability in July has risen from 84.4% to 84.7% and in September from 91.2% to 91.8%;
Technical (short-term):
(-) Small speculators have reduced their short positions by 3,768 to 62,985 contracts. Short positions have fallen by 2,147 to 63,604 contracts. Last week, the number of open short positions surpassed that of long positions. Net-short positions currently stand at 619 contracts;
(-) US 10Y bond yields: 2.401% (up 0.5% from 10/05/17);
(-) Tension surrounding the situation with North Korea. Increased demand for safe haven assets;
(-) The US Congress has approved a temporary budget, avoiding a government shutdown for the time being. A week’s delay will give time for knocking out a draft budget for the rest of the fiscal year (end of September). It became clear on the 1st of May that Republicans and Democrats had settled on a compromise to keep the budget going until the 30th of September;
(+) Emmanuel Macron is France’s president-elect;
(+) S&P has reaffirmed Germany’s credit rating at AAA/A-1+ with a stable outlook.
Macroeconomic overview: Today the Bank of England will simultaneously publish its May Inflation Report, the MPC policy decision and the MPC minutes (11:00 GMT). This will be followed by a press conference (11:30 GMT). We expect a comfortable majority of MPC members to vote in favor of maintaining the stance of monetary policy, but at least one member is likely to instead favor an immediate increase in the bank rate.
The main development in the last month or so is that real GDP growth slowed to just 0.3% qoq in the first quarter 2017 according to the preliminary estimate. That’s less than half the 0.7% qoq growth in the fourth quarter 2017 and materially lower than the BoE’s forecast of 0.6% qoq. The main reason behind the weakness is the slowdown in consumer services, particularly retail and accommodation, as higher inflation combined with weaker wage growth squeezes real household income growth. The first view of the expenditure breakdown won’t be released until later this month, but the other components of demand (such as net exports) are not fully offsetting a consumer spending slowdown.
The most recent business surveys, for April, suggest that some of the weakness in the first quarter may prove temporary. The PMIs even accelerated, and the CBI survey of retail sales surprisingly rose to its highest level in 19 months, perhaps inflated by mild weather and Easter. However, on balance, the BoE is likely to revise down its near-term growth forecasts a touch and, at least, the mixed data argue for caution in setting policy.
On inflation, BoE staff projections are likely to be little changed, with a small upward revision to the near term and a small downward revision at the policy-relevant 2-3 year horizon. Inflation held at 2.3% yoy in March, higher than the BoE’s February Report forecast of 2.1% amid growing underlying inflationary pressure from past sterling depreciation. Partly offsetting this for the near-term outlook is that oil prices have dropped since the February report. The recent appreciation of the effective sterling index, of around 1.5% since late January, will likely mean a slightly smaller overshoot of the inflation target at the 2-3 year horizon.
The mixed data on growth and higher near-term inflation than expected are likely to mean further dissent at May meeting. Kristin Forbes (who leaves the MPC in June) will almost certainly continue to favor an immediate 25 bp increase in the bank rate, while Michael Saunders appears close to joining her. In a recent speech, Saunders said he expected growth and inflation to be higher than consensus expectations and warned, “I do not believe the MPC is necessarily obliged to delay any policy moves until we have certainty over the exact shape of Brexit and its long-run effects on the economy”. It comes after the March MPC minutes said that, among the majority who voted to maintain the stance of monetary policy, “some members noted that it would take relatively little further upside news on the prospects for activity or inflation for them to consider that a more immediate reduction in policy support might be warranted”.
The GBP/USD fell today after data showed UK industrial output data was sharply weaker than expected in March while the trade deficit widened sharply.
Industrial output fell by a monthly 0.5%. The manufacturing sector, which is part of overall industrial output, saw output fall by 0.6%, compared with market expectations of no change. Britain’s goods trade deficit with the rest of the world widened to GBP 13.441 billion, bigger than the median forecast of GBP 11.8 billion. That took the total trade deficit – including Britain’s surplus in services – for the first quarter to GBP 10.540 billion, more than double the shortfall in the fourth quarter.
Technical analysis: The rejection of the GBP/USD recovery yesterday and today’s slide suggests there is a chance for a deeper correction. The 23.6% fibo of April-May rise is support at 1.2842 and the 21-dma is close at 1.2833.
Short-term signal: Short in play, target 1.2750
Long-term outlook: Bullish
NZD/USD: RBNZ retains neutral bias
Macroeconomic overview: The Reserve Bank of New Zealand held its benchmark interest rate steady at 1.75% and retained its neutral bias, defying the expectations that it would lean toward a tightening of monetary policy in early 2019.
RBNZ Governor Graeme Wheeler said that a recent depreciation in the New Zealand dollar was “encouraging, and if sustained, would help rebalance the growth outlook.” He reiterated his statement from the last two rate decisions in March and February that monetary policy “will remain accommodative for a considerable period of time.”
Inflation accelerated to 2.2% in the first quarter, well above the RBNZ’s projection of 1.5%. It was the first time since 2011 the bank had reached the midpoint of its target range. Wheeler said the increase in headline inflation in the March quarter was mainly due to temporary effects, particularly volatile petrol and food prices, and headline inflation would reach the midpoint of the 1%-3% target band over the medium term.
RBNZ Assistant Governor John McDermott said underlying inflation expectations in the country had not changed substantially from three months ago and the central bank has a neutral bias on interest rates.
The New Zealand dollar fell sharply immediately following the release of the Reserve Bank of New Zealand statement, dropping to 0.6819 from 0.6943 before the statement.
Technical analysis: The NZD/USD hit a fresh 11-month low after the release of the RBNZ statement. Despite some recovery attempts in the previous days, the bearish trend is continued. The pair is back below 14-day exponential moving average, which highlights the bearish structure. The NZD/USD broke the important long-term support level at .6861 (50% fibo of 2015-2016 rise). A close below this level may open the way to a stronger drop.
Short-term signal: Our long position was closed with a loss after the release of the RBNZ statement
Long-term outlook: Improving fundamentals of the New Zealand’s economy should result in NZD/USD appreciation in the long term.
TRADING STRATEGIES SUMMARY:
FOREX – MAJOR PAIRS:
FOREX – MAJOR CROSSES:
PRECIOUS METALS:
How to read these tables?
1.Support/Resistance – three closest important support/resistance levels 2. Position/Trading Idea: BUY/SELL – It means we are looking to open LONG/SHORT position at the Entry Price. If the order is filled we will set the suggested Target and Stop-loss level. LONG/SHORT – It means we have already taken this position at the Entry Price and expect the rate to go up/down to the Target level. 3. Stop-Loss/Profit Locked In – Sometimes we move the stop-loss level above (in case of LONG) or below (in case of SHORT) the Entry price. This means that we have locked in profit on this position. 4. Risk Factor – green “*” means high level of confidence (low level of uncertainty), grey “**” means medium level of confidence, red “***” means low level of confidence (high level of uncertainty) 5. Position Size (forex)– position size suggested for a USD 10,000 trading account in mini lots. You can calculate your position size as follows: (your account size in USD / USD 10,000) * (our position size). You should always round the result down. For example, if the result was 2.671, your position size should be 2 mini lots. This would be a great tool for your risk management! Position size (precious metals) – position size suggested for a USD 10,000 trading account in units. You can calculate your position size as follows: (your account size in USD / USD 10,000) * (our position size). 6. Profit/Loss on recently closed position(forex) – is the amount of pips we have earned/lost on recently closed position. The amount in USD is calculated on the assumption of suggested position size for USD 10,000 trading account. Profit/Loss on recently closed position (precious metals) – is profit/loss we have earned/lost per unit on recently closed position. The amount in USD is calculated on the assumption of suggested position size for USD 10,000 trading account. About the Author:
Get this free, special report about the unexpected but imminent and grave risk to your portfolio. You’ll also get 29 specific forecasts for Stocks, Real Estate, Gold, New Cultural Trends to help you prepare and protect your wealth.
This article was syndicated by Elliott Wave International and was originally published under the headline Fast Charts and World Markets: $18 TRILLION, A Bold Forecast, Inflation(?). EWI is the world’s largest market forecasting firm. Its staff of full-time analysts led by Chartered Market Technician Robert Prechter provides 24-hour-a-day market analysis to institutional and private investors around the world.
Macroeconomic overview: Dallas Federal Reserve Bank President Robert Kaplan said he continues to believe U.S. rate hikes should be “gradual and patient,” in part because wages and prices are rising more slowly than might have been expected with an economy so close to full employment. His “baseline” view continues to be for three U.S. interest-rate hikes this year, including the increase in March.
Kaplan made clear that part of the reason for raising rates and, later on, trimming the Fed’s balance sheet is to better position the Fed to fight a future recession or shock when it comes, but that he was in no mood to rush.
Boston Fed President Eric Rosengren said the current jobless rate at 4.4% has already fallen below his 4.7% estimate of “natural employment.” This theoretically is the lowest level possible before wage pressures push inflation too high. “Such an overheated economy would likely be accompanied by higher inflation, which in turn would likely elicit higher interest rates,” he said at a commercial real estate conference. Rosengren has pushed for rate hikes over the last year but does not vote again on policy until 2019.
Kansas City Federal Reserve President Esther George said she supported starting to wind down the Fed’s massive trove of bonds this year. George does not have a vote on monetary policy this year but participates in discussions. She will next be a voting member of the FOMC in 2019.
The key even today was Mario Draghi’s speech in Dutch Parliament. Investors watched for a possible move towards a more hawkish tone amid strength in the Eurozone economy and receding political risks. But Mario Draghi said: “Incoming data confirm that the cyclical recovery of the euro area economy is becoming increasingly solid and that downside risks have further diminished.” But in his opinion it is too early for the European Central Bank to declare victory in its quest to raise inflation in the Eurozone to its target of almost 2%. He added the benefits of the ECB’s ultra-easy policy “clearly outweigh” its potential side effects.
Technical analysis: The EUR/USD corrective move is continued. The pair broke below 14-day exponential moving average and the next support level is 38.2% fibo of April-May rise at 1.0848. A close below this level will reinforce the bearish bias.
Short-term signal: Stay short for 1.0800
Long-term outlook: Current corrective move does not change bullish long-term outlook
NZD/USD: RBNZ to keep rates on hold
Macroeconomic overview: The Reserve Bank of New Zealand is all-but-certain to keep rates on hold at a record low of 1.75% at its review on Thursday, but investors will be on the lookout for any signs it may move earlier to raise rates as inflation picks up.
In its last statement in March, the central bank reiterated that it would stay on hold for a “considerable” period of time, warning that the recovery in inflation could be temporary and there were growing international risks.
Governor Graeme Wheeler highlighted that growing global protectionism, led by U.S. President Donald Trump, was a major risk for New Zealand’s small and open trade-dependent economy.
The central bank had indicated in March that rates could remain unchanged for as long as two years, with external rather than domestic factors determining the outlook. Some economists thought it might do-away with the mention of a timeframe in its next policy statement.
The central bank slashed rates seven times in the last two years, which worked to lift tepid inflation. New Zealand’s consumer price index accelerated to a surprisingly brisk 2.2% in the first quarter, the highest in five years.
But some of that gain was due to temporary factors such as higher oil prices and a tax hike on alcohol and tobacco products. Stripping out petrol, alcohol and cigarettes put annual inflation at a more modest 1.5%, though that was still comfortably within the RBNZ’s target band of one to three percent.
Technical analysis: The NZD/USD continues its recovery. The pair broke above 14-day exponential moving average and is testing 50% fibo of April drop at 0.6946. A close above this level will open the way to full retracement. Yesterday’s low at 0.6881 is the nearest support.
Short-term signal: We do not much more hawkish tone from the RBNZ today, but New Zealand’s fundamentals are getting stronger, which should result in the NZD recovery. We stay long for 0.7150.
Long-term outlook: Bullish
TRADING STRATEGIES SUMMARY:
FOREX – MAJOR PAIRS:
FOREX – MAJOR CROSSES:
PRECIOUS METALS:
How to read these tables?
1.Support/Resistance – three closest important support/resistance levels 2. Position/Trading Idea: BUY/SELL – It means we are looking to open LONG/SHORT position at the Entry Price. If the order is filled we will set the suggested Target and Stop-loss level. LONG/SHORT – It means we have already taken this position at the Entry Price and expect the rate to go up/down to the Target level. 3. Stop-Loss/Profit Locked In – Sometimes we move the stop-loss level above (in case of LONG) or below (in case of SHORT) the Entry price. This means that we have locked in profit on this position. 4. Risk Factor – green “*” means high level of confidence (low level of uncertainty), grey “**” means medium level of confidence, red “***” means low level of confidence (high level of uncertainty) 5. Position Size (forex)– position size suggested for a USD 10,000 trading account in mini lots. You can calculate your position size as follows: (your account size in USD / USD 10,000) * (our position size). You should always round the result down. For example, if the result was 2.671, your position size should be 2 mini lots. This would be a great tool for your risk management! Position size (precious metals) – position size suggested for a USD 10,000 trading account in units. You can calculate your position size as follows: (your account size in USD / USD 10,000) * (our position size). 6. Profit/Loss on recently closed position(forex) – is the amount of pips we have earned/lost on recently closed position. The amount in USD is calculated on the assumption of suggested position size for USD 10,000 trading account. Profit/Loss on recently closed position (precious metals) – is profit/loss we have earned/lost per unit on recently closed position. The amount in USD is calculated on the assumption of suggested position size for USD 10,000 trading account. About the Author:
The EUR/USD pair has reached the first downside target. We think, today the price may be corrected towards 1.0943 and then fall with the predicted target at 1.0800. After the market breaks 1.0860 and forms another continuation pattern, the target will be specified.
GBP USD, “Great Britain Pound vs US Dollar”
The GBP/USD pair has completed the descending structure, which may be considered as a correction; it has already returned to 1.2950 and formed another consolidation range. If later the price breaks this consolidation range to the upside, the instrument may grow towards 1.3012; if to the downside – continue falling with the target at 1.2750.
USD CHF, “US Dollar vs Swiss Franc”
The USD/CHF pair has reached the predicted upside target. Possibly, today the price may be corrected towards 1.0000. Later, in our opinion, the market may grow to reach 1.0096. This is only the first half of the ascending wave.
USD JPY, “US Dollar vs Japanese Yen”
The USD/JPY pair is being corrected to the downside towards 113.28. After that, the instrument may grow towards 114.48 and then fall with the target at 113.28.
AUD USD, “Australian Dollar vs US Dollar”
The AUD/USD pair is trying to continue forming its consolidation range. Possibly, the price may grow towards 0.7400 to test it from below. Such scenario should be considered only as an alternative one. The main scenario remains the same and implies that the downtrend may continue. The target is at 0.7200.
USD RUB, “US Dollar vs Russian Ruble”
After the market opening, the USD/RUB pair is expected to reach 57.56. After that, the instrument may grow with the target at 59.43.
XAU USD, “Gold vs US Dollar”
Gold has reached the local downside target. We think, today the price may be corrected towards 1235 (at least) or even 1255. Later, in our opinion, the market may continue moving downwards with the target at 1212.
BRENT
Brent is being corrected. Possibly, the price may form the Flag pattern with the target at 48.48. After that, the instrument may form another ascending structure towards 51.00 and then fall to reach 43.43.
Attention! Forecasts presented in this section only reflect the author’s private opinion and should not be considered as guidance for trading. RoboForex LP bears no responsibility for trading results based on trading recommendations described in these analytical reviews.