Trading opportunities for the currency pair: At this very moment, the price is located within the 2-2 channel. A beautiful triangular structure has formed from the high at 0.8531. According to my prediction, the price will exit this range and subsequently grow as far as the upper boundary of the 1-1 channel at 0.8590. The case for growth will disappear if the daily candlestick closes below 0.8325.
Background:
The previous idea on this pair came out on the 27th of February, 2017. At the time of publication, the Euro was trading at 0.8467. Cycles indicated at the time that the price should have restored to 0.8600, followed by a slide to 0.8340 by 20/03/17. The Euro surpassed 0.8600 by 187 pips. This growth phase continued until the 14th of March, although by the 14th of April, the price had fallen below its target of 0.8340 to 0.8297.
Current situation:
Growing political risks in Europe have provided support for the British pound. Tension has subsided since the end of the French presidential election. Emmanuel Macron has now been sworn in as the president of France and the exchange rate has restored to 0.8531.
EURGBP daily chart. Source: TradingView.
The EUR/GBP pair closed up on Friday. The single currency appreciated against the greenback and sterling after the release of US statistics. The price is currently located inside the 2-2 channel. I’m forecasting a breakout from this range, followed by growth to the upper boundary of the 1-1 channel at 0.8590.
Former British Prime Minister Tony Blair has signaled his return to politics, launching an active campaign against Brexit. He warned that Northern Ireland may begin to reconsider its membership of the United kingdom due to the country’s exit from the EU. A snap parliamentary election is being held in the UK on the 8th of June. The pound will likely be feverish, and so could deviate from my proposed scenario, but that’s the market for you. We should be prepared for any potential outcome.
You don’t have to be an economics major to be able to calculate your profit and loss. In fact, not much more than 2nd grade math is required. Why is it then, that so many traders overlook the important step of maintaining a P&L of their trades?
Not only is your success (or failure) as a trader measured in terms of your profits and your losses, but having a clear view of how much money you have at stake, at any point in which you have a trade open, is crucial to the effective management of your risk. As such, here is a short and simple guide to calculating your P&L:
To put it in plain English, in order to calculate the profit and loss of a trade, all you need to do is multiply the size of the position, by how many pips the price has moved. Let’s say you have opened a GBP/USD position for 100,000 and the position is currently trading at 3.4240. If the price moves to 3.4255, then that means the price has moved up 15 pips. For a 100,000 trade, the 15 pips equal US$150 (100,000 x 15). Now, how would you know if those US$150 are a loss or a profit? In a long position, if the prices moved up, then you’ve profited, whereas if they went down you’ve lost. In a short position, the opposite is true: if the prices moved up, you’ve lost, if they’ve moved down, you’ve profited.
At any time in which you have a position opened, the prices of currencies are fluctuating, therefore your P&L is constantly changing, generating what is called an unrealized profit or loss. Once you close out a position, the profit or loss becomes realized.
The margin balance in your account is the addition of your initial margin deposit, your realized P&L and your unrealized P&L. Because of this, whenever you have positions opened, your margin balance is fluctuating. Margin balances are typically calculated in USD, but P&L is denominated in the quote currency, so in order to calculate your margin balance, you must convert your P&L to USD.
While every brokerage on the internet offers a P&L calculator to automatically calculate the profits and losses of your trades, it is important that you know how to do it manually, so you can properly structure your trades before you open them.
About the Author:
Adinah Brown is a professional writer who has worked in a wide range of industry settings, including corporate industry, government and non-government organizations. Within many of these positions, Adinah has provided skilled marketing and advertising services and is currently the Content Manager at Leverate.
Here is a short summary and this week’s links (below) to the latest Commitment of Traders changes.
– Speculators continued to cut their bullish bets of the US dollar for a third straight week while speculators went long the euro for the first time in three years
–WTI Crude speculators again sharply reduced bullish bets last week for a third straight week
– The 10-year note speculators boosted bullish positions for the third week out of the last four
– Gold speculators sharply reduced their bullish bets last week for a second week in a row
– Silver bets continued to fall for a fourth straight week following a record high bullish position on April 11th
– Copper speculative bets declined and are lower for 12 out of the previous 14 weeks
– Large S&P500 speculative bets fell for 5th out of the last 6 weeks and to the lowest level since 2014
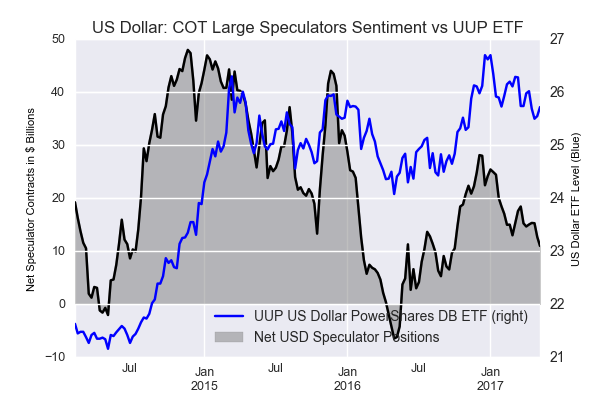
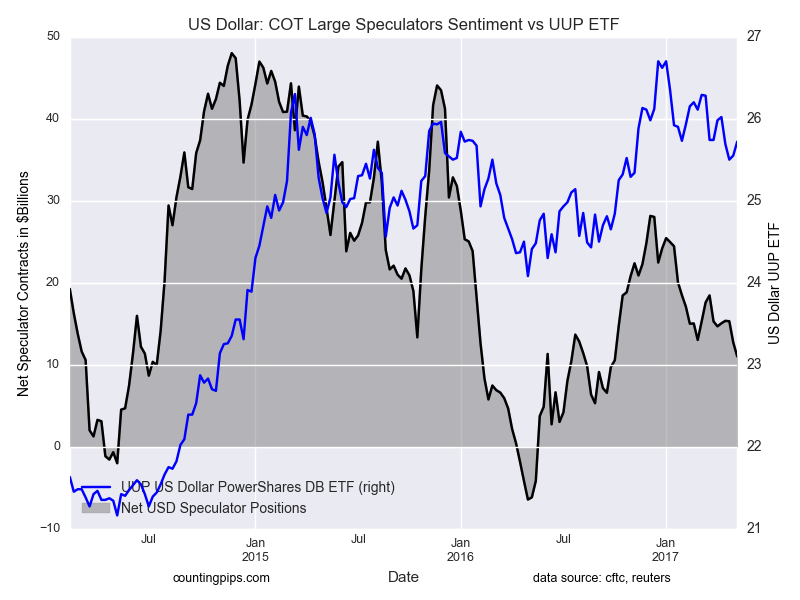
US Dollar net speculator positions leveled at $11.00 billion last week
The latest data for the weekly Commitment of Traders (COT) report, released by the Commodity Futures Trading Commission (CFTC) on Friday, showed that large traders and currency speculators continued to decrease their bullish bets for the US dollar for a third straight week last week while speculators turned long the euro for the first time in three years. See full article
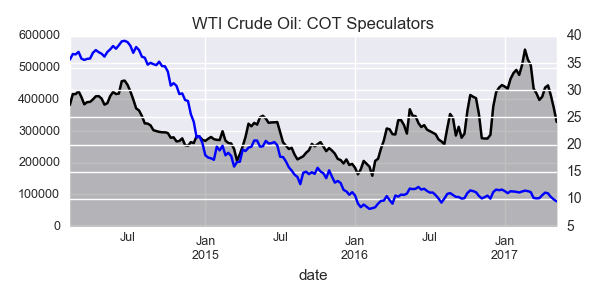
The non-commercial contracts of WTI crude futures totaled a net position of 328,751 contracts, according to data from last week. This was a decline of -44,393 contracts from the previous weekly total. See full article
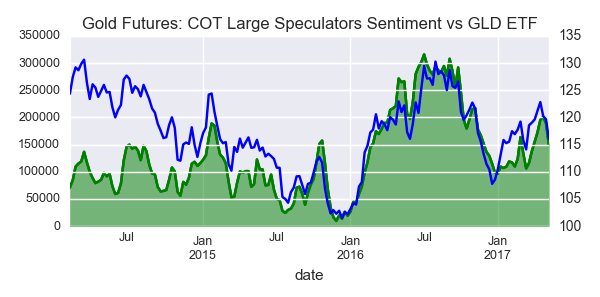
The large speculator contracts of gold futures declined to a total net position of 150,006 contracts. This was a weekly shortfall of -39,628 contracts from the previous week. See full article
The large speculator contracts of 10-year treasury note futures totaled a net position of 229,119 contracts. This was a weekly gain of 49,249 contracts from the previous week. See full article
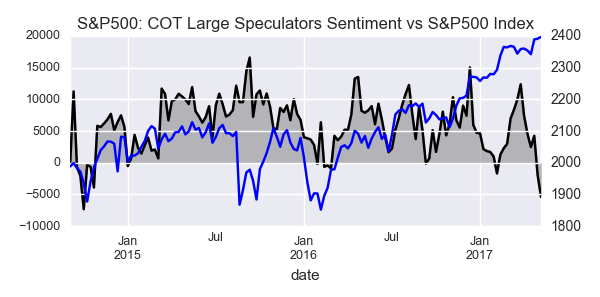
The large speculator contracts of S&P 500 futures totaled a net position of -5,400 contracts. This was a drop of -3,479 contracts from the reported data of the previous week. See full article
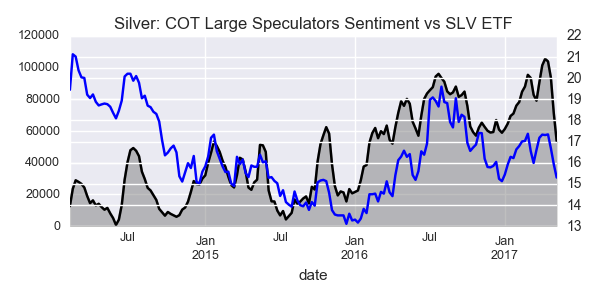
The non-commercial contracts of silver futures totaled a net position of 53,655 contracts, according to data from last week. This was a weekly decrease of -17,712 contracts from the previous totals. See full article
The large speculator contracts of copper futures totaled a net position of 8,081 contracts. This was a weekly fall of -10,457 contracts from the data of the previous week. See full article
The Commitment of Traders report data is published in raw form every Friday by the Commodity Futures Trading Commission (CFTC) and shows the futures positions of market participants as of the previous Tuesday (data is reported 3 days behind).
US Dollar net speculator positions leveled at $11.00 billion last week
The latest data for the weekly Commitment of Traders (COT) report, released by the Commodity Futures Trading Commission (CFTC) on Friday, showed that large traders and currency speculators continued to decrease their bullish bets for the US dollar for a third straight week last week while speculators turned long the euro for the first time in three years.
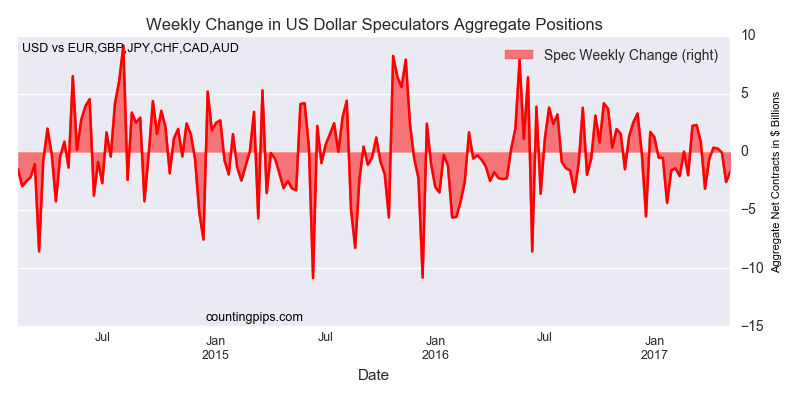
Non-commercial large futures traders, including hedge funds and large speculators, had an overall US dollar long position totaling $11.00 billion as of Tuesday May 9th, according to the latest data from the CFTC and dollar amount calculations by Reuters. This was a weekly change of $-1.70 billion from the $12.70 billion total long position that was registered the previous week, according to the Reuters calculation (totals of the US dollar contracts against the combined contracts of the euro, British pound, Japanese yen, Australian dollar, Canadian dollar and the Swiss franc).
Speculative aggregate positions are now at the lowest bullish level for the dollar since October 4th of 2016 when the aggregate totaled $10.52 billion.
Individual Currencies Weekly Speculator Contract Changes: Euro bets go long
The individual major currencies saw very sharp changes last week with five major currencies seeing weekly changes above the 10,000 contract mark.
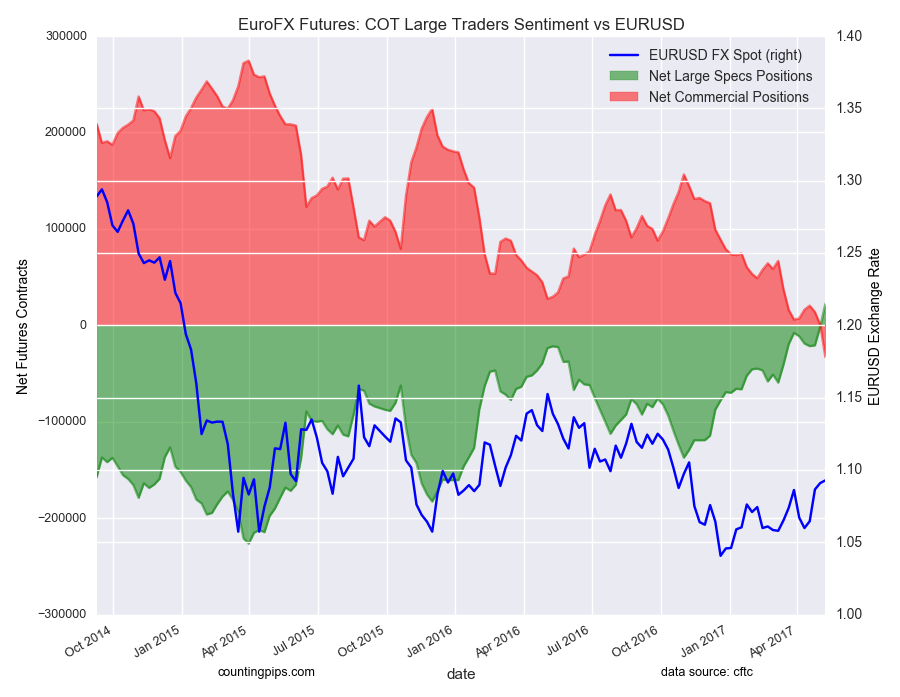
The highlight of the data this week is the euro turning from a bearish overall position to new overall bullish level for the first time since May 6th 2014 when net positions equaled 32,551 contracts.
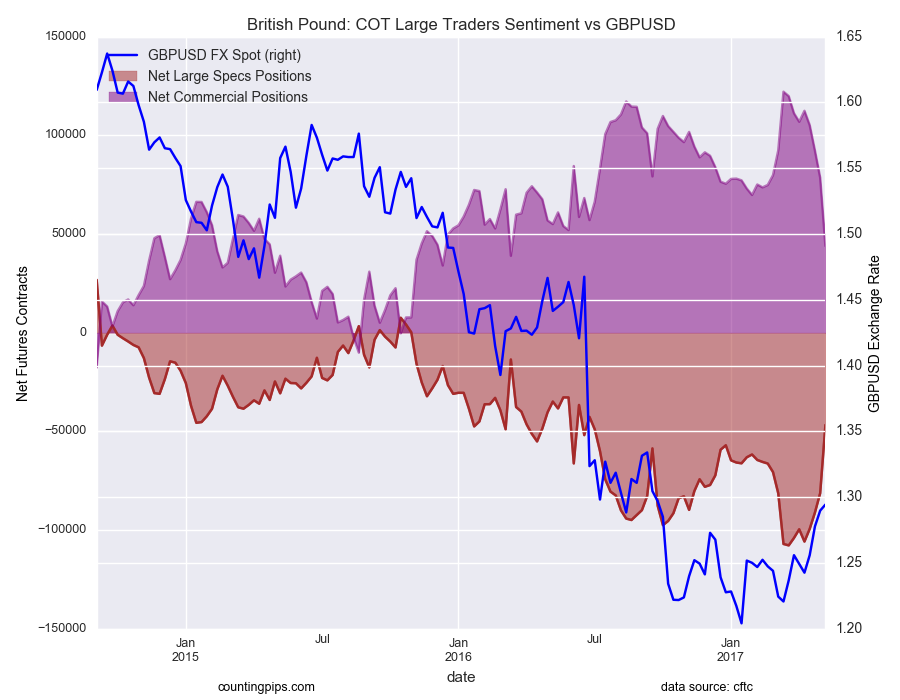
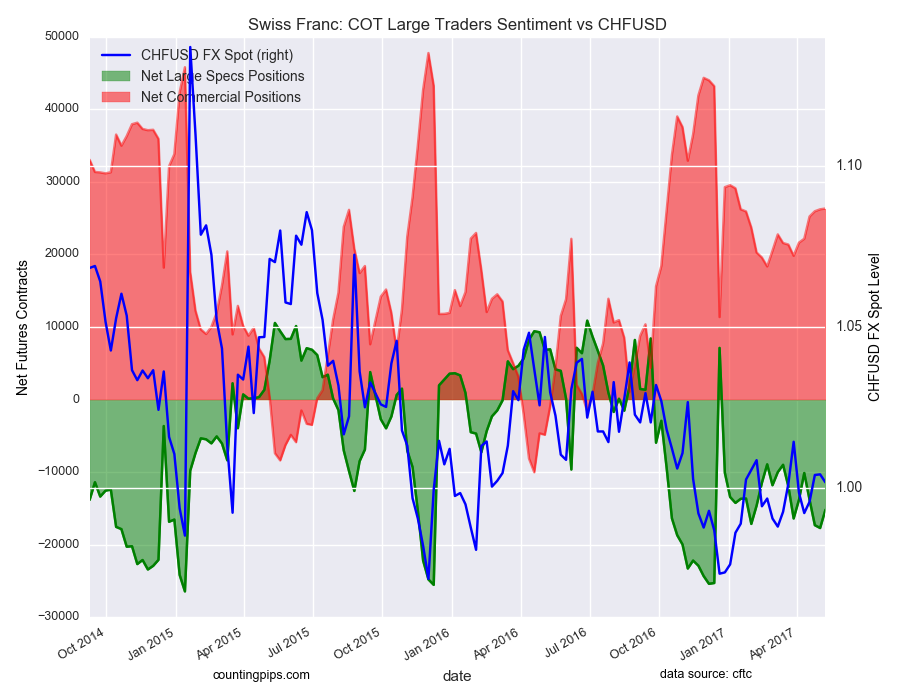
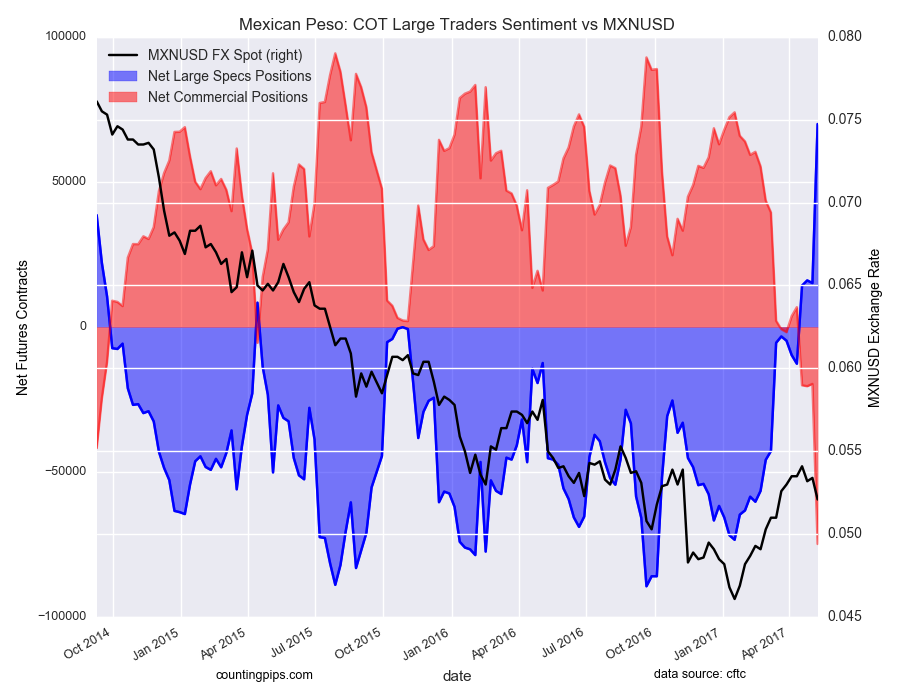
Leading the way for the major currencies that improved against the US dollar last week were the Mexican peso (54,788 weekly change in contracts), British pound sterling (34,566 contracts), euro (24,052 contracts), Swiss franc (2,512 contracts) and the New Zealand dollar (1,184 contracts).
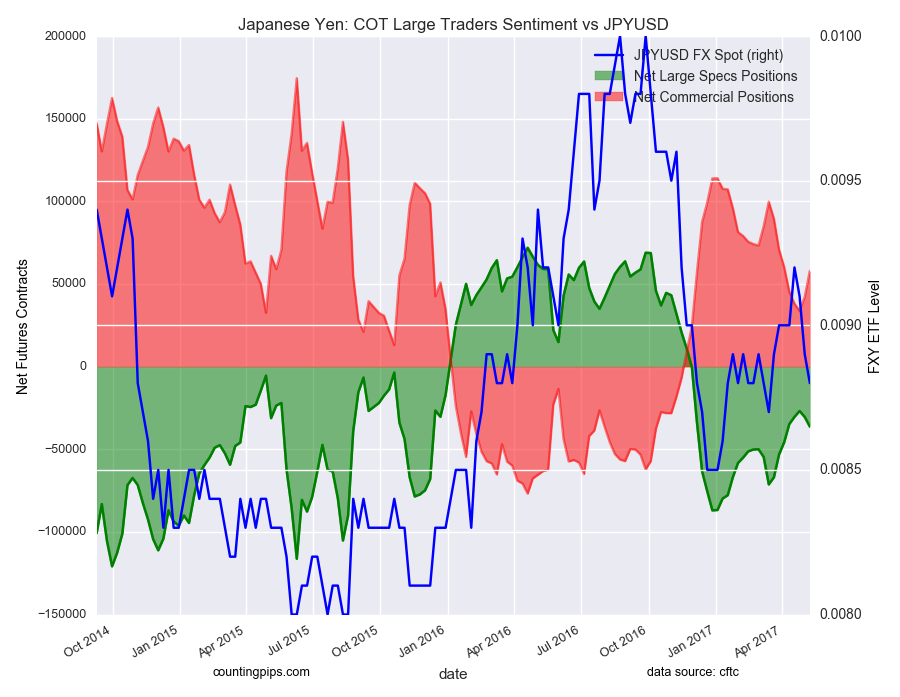
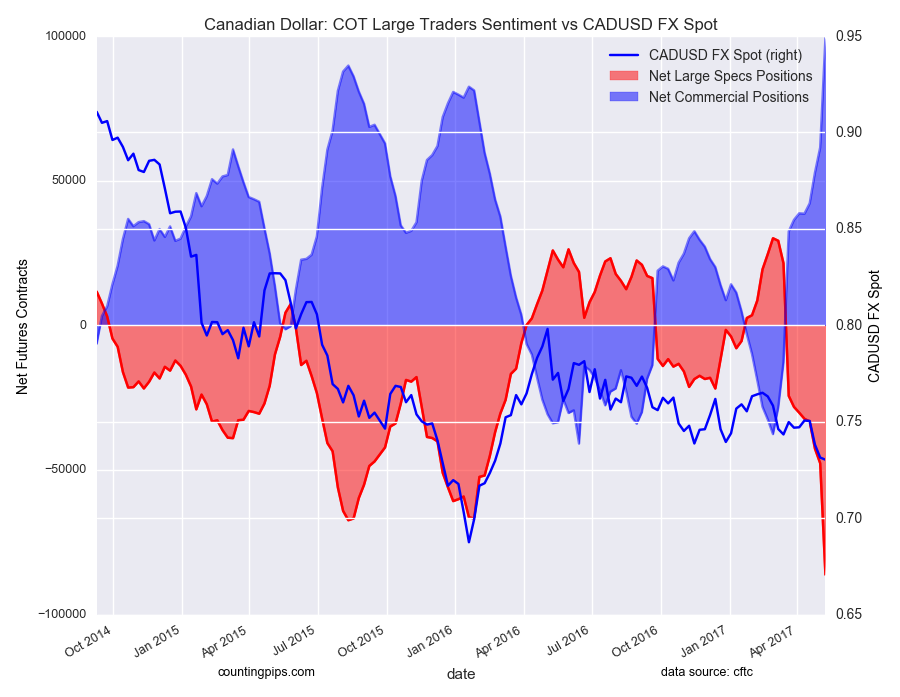
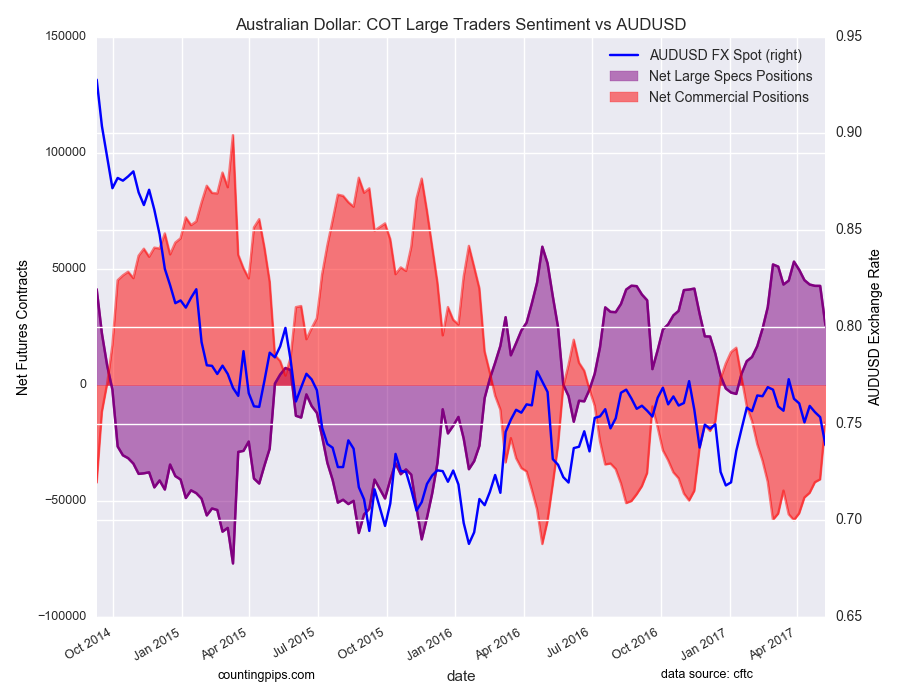
The currencies whose speculative bets declined last week versus the dollar were the Canadian dollar (-38,511 weekly change in contracts), Australian dollar (-16,891 contracts) and the Japanese yen (-5,824 contracts).
See the individual currency charts below.
Table of Weekly Commercial Traders and Speculators Levels & Changes:
Currency
Net Commercials
Comms Weekly Chg
Net Speculators
Specs Weekly Chg
EuroFx
-33199
-34027
22399
24052
GBP
43890
-34642
-46798
34566
JPY
57893
15774
-36307
-5824
CHF
26319
106
-15196
2512
CAD
99276
37806
-86215
-38511
AUD
-16057
24581
25784
-16891
NZD
13108
-1119
-10786
1184
MXN
-74769
-55133
69903
54788
This latest COT data is through Tuesday and shows a quick view of how large speculators or non-commercials (for-profit traders) as well as the commercial traders (hedgers & traders for business purposes) were positioned in the futures markets. All currency positions are in direct relation to the US dollar where, for example, a bet for the euro is a bet that the euro will rise versus the dollar while a bet against the euro will be a bet that the dollar will gain versus the euro.
Weekly Charts: Large Trader Weekly Positions vs Price
EuroFX:
British Pound Sterling:
Japanese Yen:
Swiss Franc:
Canadian Dollar:
Australian Dollar:
New Zealand Dollar:
Mexican Peso:
*COT Report: The weekly commitment of traders report summarizes the total trader positions for open contracts in the futures trading markets. The CFTC categorizes trader positions according to commercial hedgers (traders who use futures contracts for hedging as part of the business), non-commercials (large traders who speculate to realize trading profits) and nonreportable traders (usually small traders/speculators). Find CFTC criteria here: (http://www.cftc.gov/MarketReports/CommitmentsofTraders/ExplanatoryNotes/index.htm).
The Commitment of Traders report is published every Friday by the Commodity Futures Trading Commission (CFTC) and shows futures positions data that was reported as of the previous Tuesday (3 days behind).
Each currency contract is a quote for that currency directly against the U.S. dollar, a net short amount of contracts means that more speculators are betting that currency to fall against the dollar and a net long position expect that currency to rise versus the dollar.
(The charts overlay the forex closing price of each Tuesday when COT trader positions are reported for each corresponding spot currency pair.) See more information and explanation on the weekly COT report from the CFTC website.
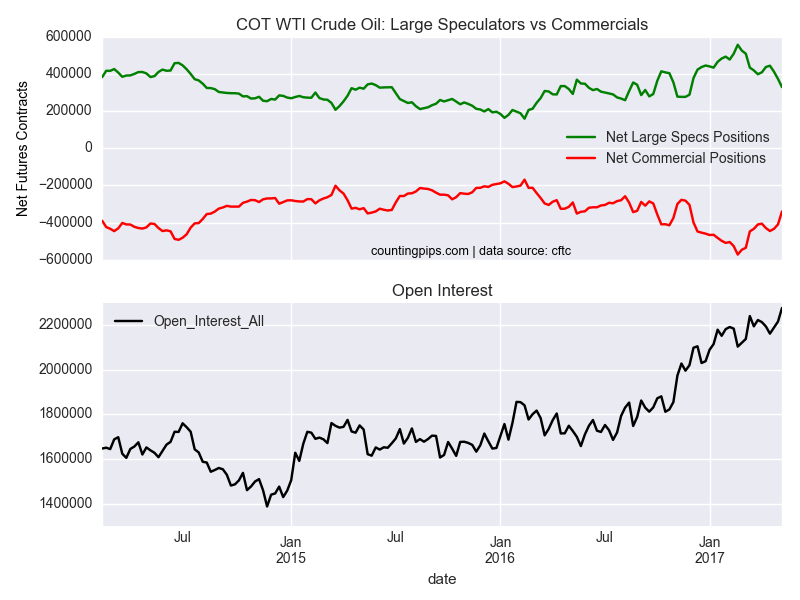
Speculators continued to pare back their bullish net positions in the WTI crude oil futures markets last week for the third consecutive week, according to the latest Commitment of Traders (COT) data released by the Commodity Futures Trading Commission (CFTC) on Friday.
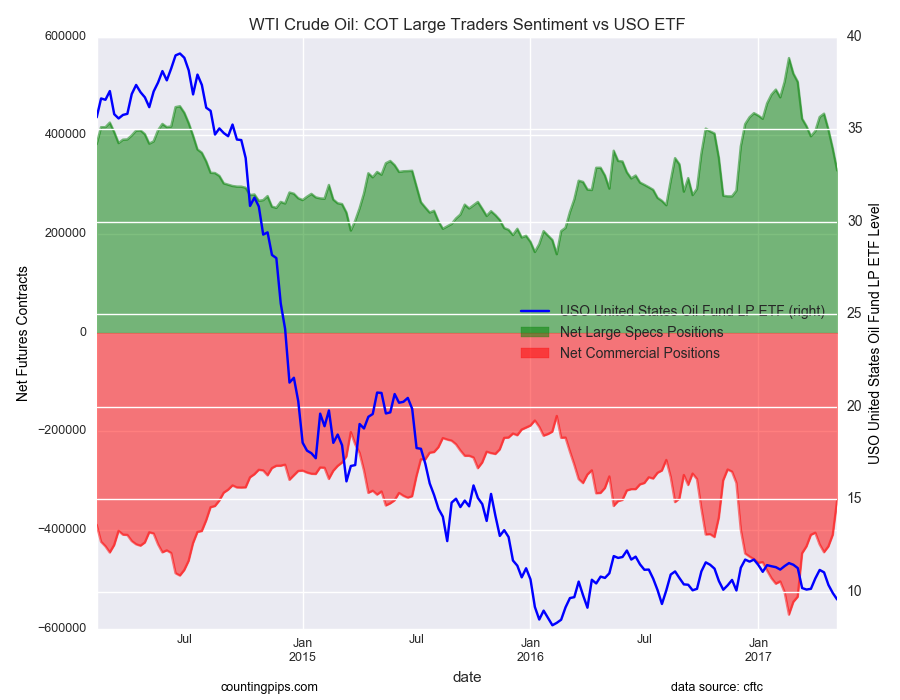
The non-commercial contracts of WTI crude futures, traded by large speculators and hedge funds, totaled a net position of 328,751 contracts in the data reported through May 9th. This was a weekly change of -44,393 contracts from the previous week which had a total of 373,144 net contracts.
The speculative net bullish position is down by just over -115,000 net contracts in the last three weeks alone and now have fallen to the lowest standing since November 29th when net positions totaled 287,881 net contracts.
WTI Crude Oil Commercial Positions:
The commercial traders position, categorized by the CFTC as hedgers or traders engaged in buying and selling for business purposes, totaled a net position of -339,794 contracts last week. This is a weekly gain of 70,066 contracts from the total net of -409,860 contracts reported the previous week.
USO Crude Oil ETF:
Over the same weekly reporting time-frame, from Tuesday to Tuesday, the USO Crude Oil ETF, which tracks the price of WTI crude oil, closed at approximately $9.57 which was a decline of $-0.35 from the previous close of $9.92, according to ETF market data.
*COT Report: The COT data, released weekly to the public each Friday, is updated through the previous Tuesday (data is 3 days old) and shows a quick view of how large speculators or non-commercials (for-profit traders) as well as the commercial traders (hedgers & traders for business purposes) were positioned in the futures markets. The CFTC categorizes trader positions according to commercial hedgers (traders who use futures contracts for hedging as part of the business), non-commercials (large traders who speculate to realize trading profits) and nonreportable traders (usually small traders/speculators). Find CFTC criteria here: (http://www.cftc.gov/MarketReports/CommitmentsofTraders/ExplanatoryNotes/index.htm).
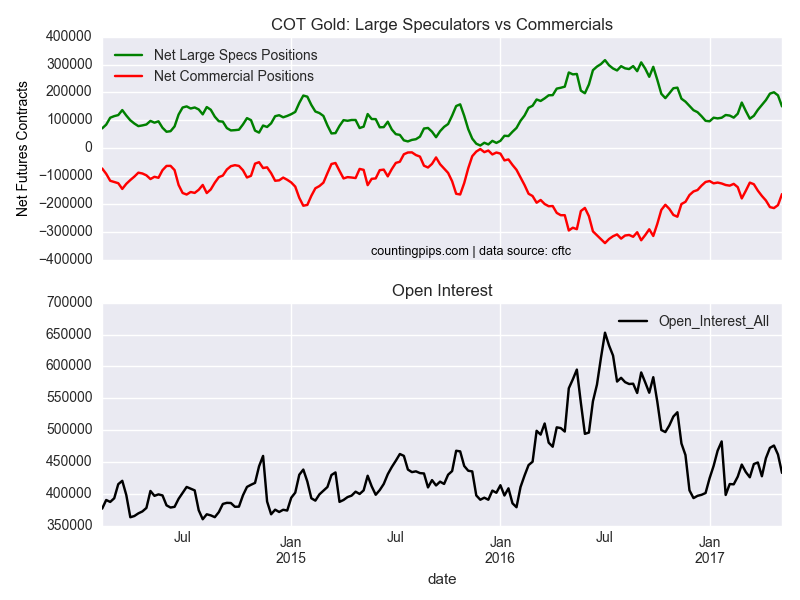
Large speculators sharply reduced their net positions in the gold futures markets last week, according to the latest Commitment of Traders (COT) data released by the Commodity Futures Trading Commission (CFTC) on Friday.
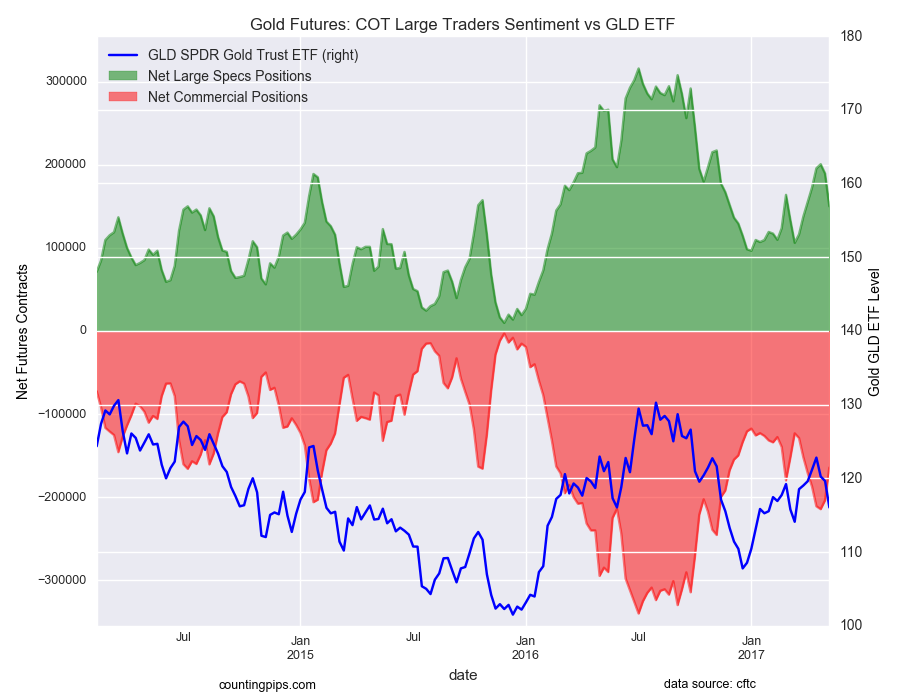
The non-commercial futures contracts of Comex gold futures, traded by large speculators and hedge funds, totaled a net position of 150,006 contracts in the data reported through May 9th. This was a weekly decline of -39,628 contracts from the previous week which had a total of 189,634 net contracts.
Speculative gold positions have declined two weeks in a row following a streak of six weekly gains that brought the net bullish position level to its highest level since November at over +200,000 contracts. The current level of net positions (150,006 contracts) is the lowest standing since the end of March.
Gold Commercial Positions:
The commercial traders position, categorized by the CFTC as hedgers or traders engaged in buying and selling for business purposes, totaled a net position of -164,422 contracts last week. This is a weekly rise of 39,564 contracts from the total net of -203,986 contracts reported the previous week.
Gold ETF:
Over the same weekly reporting time-frame, from Tuesday to Tuesday, the GLD ETF, which tracks the price of gold, closed at approximately $116.05 which was a drop of $-3.60 from the previous close of $119.65, according to ETF financial market data.
*COT Report: The COT data, released weekly to the public each Friday, is updated through the previous Tuesday (data is 3 days old) and shows a quick view of how large speculators or non-commercials (for-profit traders) as well as the commercial traders (hedgers & traders for business purposes) were positioned in the futures markets. The CFTC categorizes trader positions according to commercial hedgers (traders who use futures contracts for hedging as part of the business), non-commercials (large traders who speculate to realize trading profits) and nonreportable traders (usually small traders/speculators). Find CFTC criteria here: (http://www.cftc.gov/MarketReports/CommitmentsofTraders/ExplanatoryNotes/index.htm).
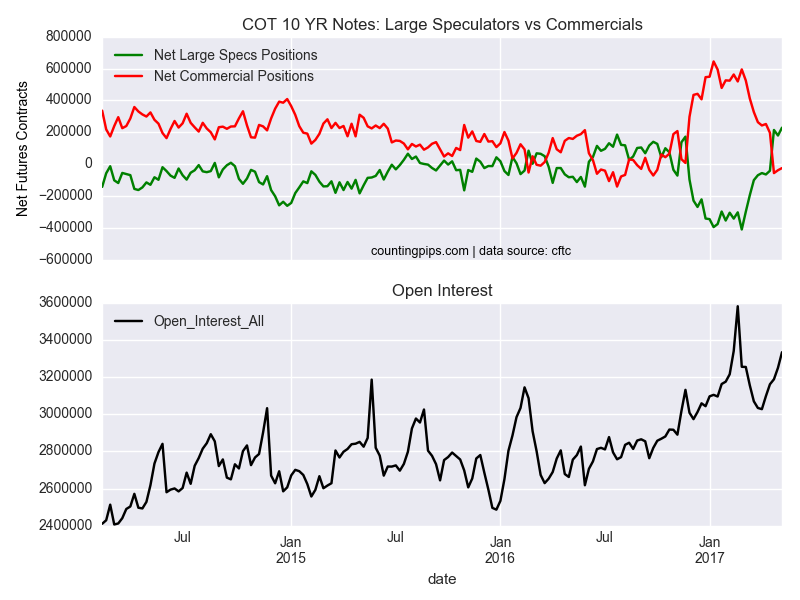
Large speculators and traders further increased their bullish net positions in the 10-year treasury note futures markets last week, according to the latest Commitment of Traders (COT) data released by the Commodity Futures Trading Commission (CFTC) on Friday.
The non-commercial futures contracts of 10-year treasury note futures, traded by large speculators and hedge funds, totaled a net position of 229,119 contracts in the data reported through May 9th. This was a weekly rise of 49,249 contracts from the previous week which had a total of 179,870 net contracts.
Speculative positions have now risen for three out of the last four weeks and are at their highest level since turning from an overall short position to an overall long position on April 25th.
10 Year Treasury Note Commercial Positions:
Meanwhile, the commercial traders position, categorized by the CFTC as hedgers or traders engaged in buying and selling for business purposes, totaled a net position of -24,508 contracts last week. This is a weekly gain of 13,437 contracts from the total net of -37,945 contracts reported the previous week.
IEF 7-10 Year Bond ETF:
Over the same weekly reporting time-frame, from Tuesday to Tuesday, the 7-10 Year Treasury Bond ETF (IEF) closed at approximately $105.61 which was a decline of $-0.82 from the previous close of $106.43, according to ETF market data.
*COT Report: The COT data, released weekly to the public each Friday, is updated through the previous Tuesday (data is 3 days old) and shows a quick view of how large speculators or non-commercials (for-profit traders) as well as the commercial traders (hedgers & traders for business purposes) were positioned in the futures markets. The CFTC categorizes trader positions according to commercial hedgers (traders who use futures contracts for hedging as part of the business), non-commercials (large traders who speculate to realize trading profits) and nonreportable traders (usually small traders/speculators). Find CFTC criteria here: (http://www.cftc.gov/MarketReports/CommitmentsofTraders/ExplanatoryNotes/index.htm).
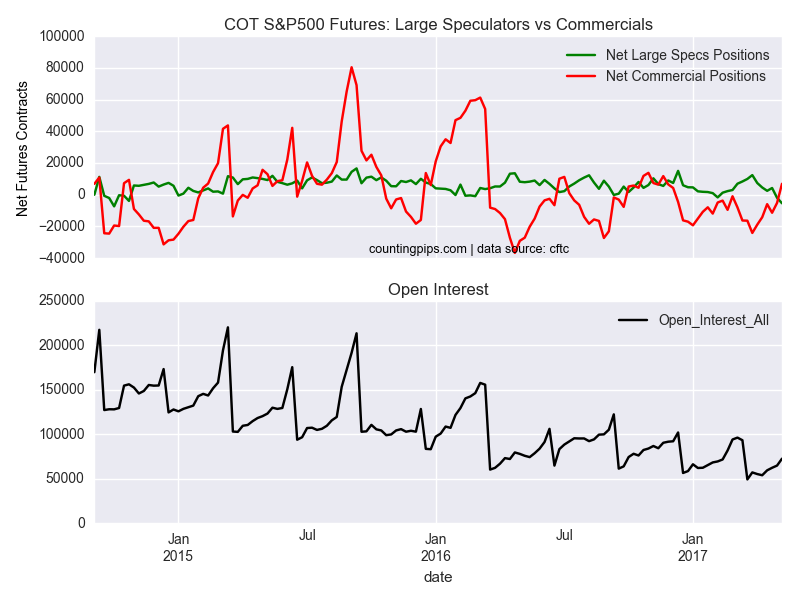
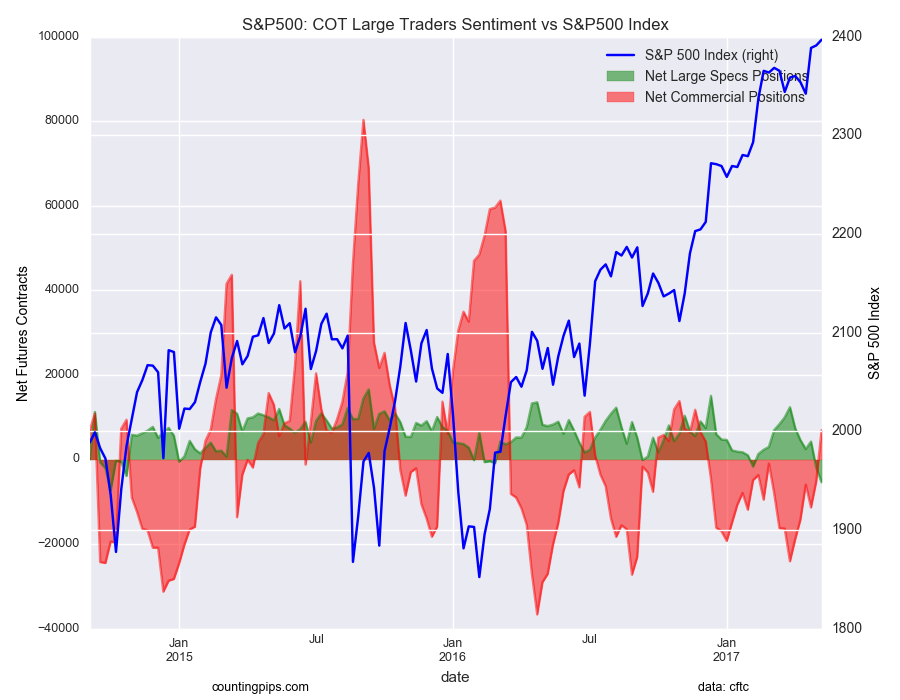
Large speculators further decreased their net positions in the S&P500 stock futures markets last week for a second consecutive week, according to the latest Commitment of Traders (COT) data released by the Commodity Futures Trading Commission (CFTC) on Friday.
The non-commercial futures contracts of S&P500 futures, traded by large speculators and hedge funds, totaled a net position of -5,400 contracts in the data reported through May 9th. This was a weekly decline of -3,479 contracts from the previous week which had a total of -1,921 net contracts.
The large speculator positions are now in negative territory for a second straight week and have fallen to the lowest level since October 7th of 2014 when net positions totaled -7,327 contracts.
S&P500 Commercial Positions:
The commercial traders position, categorized by the CFTC as hedgers or traders engaged in buying and selling for business purposes, totaled a net position of 6,905 contracts last week. This is a weekly rise of 12,068 contracts from the total net of -5,163 contracts reported the previous week.
S&P500 Stock Market Index:
Over the same weekly reporting time-frame, from Tuesday to Tuesday, the S&P500 index closed at approximately 2396.91 which was a gain of 5.75 from the previous close of 2391.16, according to market data.
*COT Report: The COT data, released weekly to the public each Friday, is updated through the previous Tuesday (data is 3 days old) and shows a quick view of how large speculators or non-commercials (for-profit traders) as well as the commercial traders (hedgers & traders for business purposes) were positioned in the futures markets. The CFTC categorizes trader positions according to commercial hedgers (traders who use futures contracts for hedging as part of the business), non-commercials (large traders who speculate to realize trading profits) and nonreportable traders (usually small traders/speculators). Find CFTC criteria here: (http://www.cftc.gov/MarketReports/CommitmentsofTraders/ExplanatoryNotes/index.htm).
Large speculators sharply decreased their net bullish positions in the silver futures markets last week as positions have now fallen for four straight weeks, according to the latest Commitment of Traders (COT) data released by the Commodity Futures Trading Commission (CFTC) on Friday.
The non-commercial futures contracts of Comex silver futures, traded by large speculators and hedge funds, totaled a net position of 53,655 contracts in the data reported through May 9th. This was a weekly drop of -17,712 contracts from the previous week which had a total of 71,367 net contracts.
Speculative bullish positions are now lower by over -50,000 net contracts over the past four weeks. Speculators had pushed their bullish bets to an all-time record high on April 11th.
Silver Commercial Positions:
The commercial traders position, categorized by the CFTC as hedgers or traders engaged in buying and selling for business purposes, totaled a net position of -69,269 contracts last week. This was a weekly gain of 17,305 contracts from the total net of -86,574 contracts reported the previous week.
Silver ETF:
Over the same weekly reporting time-frame, from Tuesday to Tuesday, the SLV ishares ETF, which tracks the price of silver, closed at approximately $15.30 which was a decline of $-0.63 from the previous close of $15.93, according to ETF financial market data.
*COT Report: The weekly commitment of traders report summarizes the total trader positions for open contracts in the futures trading markets. The CFTC categorizes trader positions according to commercial hedgers (traders who use futures contracts for hedging as part of the business), non-commercials (large traders who speculate to realize trading profits) and nonreportable traders (usually small traders/speculators). Find CFTC criteria here: (http://www.cftc.gov/MarketReports/CommitmentsofTraders/ExplanatoryNotes/index.htm).
Large speculators sharply decreased their net positions in the copper futures markets last week as net positions fell to the lowest level since October, according to the latest Commitment of Traders (COT) data released by the Commodity Futures Trading Commission (CFTC) on Friday.
The non-commercial futures contracts of copper futures, traded by large speculators and hedge funds, totaled a net position of 8,081 contracts in the data reported through May 9th. This was a weekly reduction of -10,457 contracts from the previous week which had a total of 18,538 net contracts.
Copper speculators have been lightening up on their bullish bets for some time now with bullish positions falling for five out of the last six weeks and for twelve out of the last fourteen weeks. Net positions are now down to the lowest level since October 25th when positions totaled -13,754 contracts.
Copper Commercial Positions:
The commercial traders position, categorized by the CFTC as hedgers or traders engaged in buying and selling for business purposes, totaled a net position of -8,300 contracts last week. This is a weekly gain of 11,182 contracts from the total net of -19,482 contracts reported the previous week.
Copper ETN:
Over the same weekly reporting time-frame, from Tuesday to Tuesday, the JJC iPath Bloomber Copper ETN, which tracks the price of copper, closed at approximately $28.22 which was a drop of $-1.80 from the previous close of $30.02, according to financial market data.
*COT Report: The COT data, released weekly to the public each Friday, is updated through the previous Tuesday (data is 3 days old) and shows a quick view of how large speculators or non-commercials (for-profit traders) as well as the commercial traders (hedgers & traders for business purposes) were positioned in the futures markets. The CFTC categorizes trader positions according to commercial hedgers (traders who use futures contracts for hedging as part of the business), non-commercials (large traders who speculate to realize trading profits) and nonreportable traders (usually small traders/speculators). Find CFTC criteria here: (http://www.cftc.gov/MarketReports/CommitmentsofTraders/ExplanatoryNotes/index.htm).