Large speculators sharply decreased their net positions in the silver futures markets and decreased their bullish bets for a fifth straight week last week, according to the latest Commitment of Traders (COT) data released by the Commodity Futures Trading Commission (CFTC) on Friday.
The non-commercial futures contracts of Comex silver futures, traded by large speculators and hedge funds, totaled a net position of 43,004 contracts in the data reported through May 16th. This was a weekly decline of -10,651 contracts from the previous week which had a total of 53,655 net contracts.
Speculators have now cut their bullish positions by -62,511 contracts over the past five weeks after pushing their bets to a record high position on April 11th.
Silver Commercial Positions:
The commercial traders position, categorized by the CFTC as hedgers or traders engaged in buying and selling for business purposes, totaled a net position of -57,337 contracts last week. This was a weekly rise of 11,932 contracts from the total net of -69,269 contracts reported the previous week.
Silver ETF:
Over the same weekly reporting time-frame, from Tuesday to Tuesday, the SLV ishares ETF, which tracks the price of silver, closed at approximately $15.93 which was an increase of $0.63 from the previous close of $15.30, according to ETF financial market data.
*COT Report: The weekly commitment of traders report summarizes the total trader positions for open contracts in the futures trading markets. The CFTC categorizes trader positions according to commercial hedgers (traders who use futures contracts for hedging as part of the business), non-commercials (large traders who speculate to realize trading profits) and nonreportable traders (usually small traders/speculators). Find CFTC criteria here: (http://www.cftc.gov/MarketReports/CommitmentsofTraders/ExplanatoryNotes/index.htm).
Large speculators slightly increased their bullish net positions in the copper futures markets last week following a sharp decline the week before, according to the latest Commitment of Traders (COT) data released by the Commodity Futures Trading Commission (CFTC) on Friday.
The non-commercial futures contracts of copper futures, traded by large speculators and hedge funds, totaled a net position of 8,646 contracts in the data reported through May 16th. This was a weekly increase of 565 contracts from the previous week which had a total of 8,081 net contracts.
Copper speculators have decreased their net bullish positions five out of the past seven weeks with the selling accelerating on May 9th with a decline by over 10,000 contracts. Overall net positions are now under the +10,000 contract level for a second straight week .
Copper Commercial Positions:
The commercial traders position, categorized by the CFTC as hedgers or traders engaged in buying and selling for business purposes, totaled a net position of -7,288 contracts last week. This is a weekly gain of 1,012 contracts from the total net of -8,300 contracts reported the previous week.
Copper ETN:
Over the same weekly reporting time-frame, from Tuesday to Tuesday, the JJC iPath Bloomber Copper ETN, which tracks the price of copper, closed at approximately $28.92 which was a raise of $0.70 from the previous close of $28.22, according to financial market data.
*COT Report: The COT data, released weekly to the public each Friday, is updated through the previous Tuesday (data is 3 days old) and shows a quick view of how large speculators or non-commercials (for-profit traders) as well as the commercial traders (hedgers & traders for business purposes) were positioned in the futures markets. The CFTC categorizes trader positions according to commercial hedgers (traders who use futures contracts for hedging as part of the business), non-commercials (large traders who speculate to realize trading profits) and nonreportable traders (usually small traders/speculators). Find CFTC criteria here: (http://www.cftc.gov/MarketReports/CommitmentsofTraders/ExplanatoryNotes/index.htm).
Trading on the Euro closed down on Thursday, with a breakout of the trend line ending the 4-day rally. The pair fell to 1.1076 but sellers weren’t able to close the day below 1.1082 (the opening price of the candlestick on the 17th of May).
Donald Trump is once again under siege, as he has been since entering the White House. Every week, its walls are shaken by a new scandal. Since the dismissal of FBI director James Comey, Trump has been threatened with impeachment and even prison. Political tensions slightly subsided when the former FBI head appeared to deny that Trump had tried to halt the investigation into his former advisor’s ties with Russian officials.
Market expectations:
In Asia, the Euro is trading at 1.112. Friday’s economic calendar is relatively empty but there are some planned speeches from members of the ECB and the US Federal Reserve. Euro-bears have consolidated under the balance line, so I’m going to take a risk and say that the correctional movement will continue to 1.1060.
On Thursday, the Euro/dollar pair closed down. Sellers didn’t manage to close the day below 1.1082 and so missed out on forming a bearish engulfing pattern. The dust has finally settled after a 4-day rally. The trend line and balance line have both been broken through. The price fell as a result of a high volume of orders, indicating a mass closing of long positions that had been opened by traders from the 12th of May. In the second half of the day, gold and yen both depreciated, while US bond yields grew.
At the time of writing this review, the Euro is trading at 1.1111. The price has slipped below the 67thdegree. Given that this is below the trend line, I expect the correction to continue to the 90th degree (1.1060). On the hourly timeframe, the price is at the balance point (lb), but in the next few days, it should find a balance point on the more senior timeframes.
The 38% Fibo level from the growth from 1.0839 to 1.1172 is at 1.1044 and 50% at 1.1006. The 112thdegree runs through 1.1040. So, it’s reasonable to suppose that the price may return to the 1.1040/45 range. This is my base scenario for Friday.
Positives for the Euro (+):
Fundamental:
(+) US president Donald Trump favours a weaker dollar;
Technical (short-term):
(+) According to data from 09/05/17, large speculators on the Chicago exchange have reduced short and long positions. Short positions have been reduced more than long ones by a factor of 12. Long positions have fallen by 2,899 to 152,481 contracts, while short positions have fallen by 34,758 to 127,553 contracts. The closing of short positions has resulted in an increased number of long positions. Net-long positions are now at 24,928 contracts;
(+) Small speculators have increased their long positions by 7,335 to 70,321 contracts. Short positions have fallen by 3,924 to 59,663 contracts. Long positions have again increased. Net-long positions currently stand at 10,658 contracts;
(+) According to myfxbook, the Short/Long ratio as of 7:27 EET is 82%/18%, lots: 28678/6296 (previous day: 37974/5310), positions: 64703/19491 (previous day: 77913/15579);
(+) EURGBP (W): AC, CCI (20), Stochastic (5,3,3) – up;
(-) ECB head: revision of ECB’s monetary policy not required at present. On the 10th of May, he added that the bank is in no hurry to raise interest rates or to halt its asset purchasing program;
(-) On Thursday, the 17th of May, according to CME Group’s FedWatch, the probability of a rate hike in June has risen from 69.2% to 73.8%, in July from 61.2% to 75.8% and in September from 80.9% to 82.4%;
Technical (short-term):
(-) German 10Y bond yields: 0.350% (down 7.40% from 18/05/17);
(-) US 10Y bond yields: 2.333% (up 4.94% from 18/05/17);
(-) EURGBP (D): CCI (20), Stochastic (5,3,3) – down;
(-) EURUSD (W): CCI (20) – down;
Built into the price:
(-) Tension surrounding the situation with North Korea. Increased demand for safe haven assets;
(-) The US Congress has approved a temporary budget, avoiding a government shutdown for the time being. A week’s delay will give time for knocking out a draft budget for the rest of the fiscal year (end of September). It became clear on the 1st of May that Republicans and Democrats had settled on a compromise to keep the budget going until the 30th of September;
(+) Emmanuel Macron has been sworn in as the new president of France;
(+) S&P has reaffirmed Germany’s credit rating at AAA/A-1+ with a stable outlook.
The Euro/dollar rate has closed up for the 4th day in a row. Speculation over the possibility of Donald Trump getting impeached helped the single currency strengthen to 1.1172. Escalating political tensions in the US have induced a slide in bond yields as well as a mass retreat towards safe haven assets. Investors are currently buying gold, Japanese yen and US bonds.
Gold has appreciated by 25 USD to 1,261 USD per Troy ounce. The USD/JPY exchange rate has fallen by 229 pips to 110.78. US 10Y bond yields have fallen by 2.69% to 2.236%. The probability of interest rates going up in June has fallen to 64.6%.
First, it was revealed that Trump had shared some top-secret information with Russian foreign minister Sergey Lavrov about the Islamic State terrorist organisation. Then, he allegedly asked the former FBI chief James Comey to halt the investigation into former national security advisor Michael Flynn’s relations. On Wednesday, Al Green, a congressman from Texas, called for Trump’s immediate impeachment. He believes that Trump has obstructed the investigation into the presidential campaign and Russian influence on the 2016 election.
Because of these troubles, investors fear that the Trump administration will have some difficulties trying to implement its tax and healthcare reforms.
No president has ever been successfully impeached in the history of the USA. In any case, the Republican party won’t allow it to happen this time around given that they control both houses of Congress. The Euro’s rally won’t last much longer given that there is no fundamental driving force behind it.
Market expectations:
The economic calendar is sparse today. There are no important statistics for currency markets to be released. News outlets will continue to control the market with their horror stories. In the Asian session, the Euro has slid from a high of 1.1172 to 1.1143. It looks like profit taking, but it’s too early to draw conclusions. Yesterday had a similar situation when the Euro dropped from 1.1093 by 38 pips. If we take that value from 1.1172, we get 1.1134. In order to get buyers to close their long positions, sellers need to push the price below 1.1125.
I think that traders will start buying Euros again as the price falls to 1.1093. Should the rate fall further than 1.1085, the downwards correction will gain momentum. As I’ve written above, the Euro rally doesn’t have any significant news behind it, meaning that the rate could fall just as quickly as it rose. Amidst the political turmoil in the US, making a forecast is rather senseless. The sentiment on the currency market could change at any moment.
Day’s news (GMT+3):
11:30 UK: retail sales (Apr);
15:30 Canada: foreign portfolio investment in Canadian securities (Feb); USA: initial jobless claims (12 May), Philadelphia Fed manufacturing survey (May);
20:00 Eurozone: ECB president Mario Draghi’s speech.
The bullish trend on our currency pair started with the release of Friday’s statistics. A technical breakout of 1.10 level allowed buyers to up the price to the 1.1117 mark, including today’s trading.
The scandals surrounding Trump have taken centre stage, making the Fed’s meeting in June a secondary priority. Those close to Trump have been talking about him to the newspapers. Investors fear that the White House will now have some difficulties carrying out its proposed tax and healthcare reforms.
Until the situation with Trump deescalates, I don’t see any point in making predictions. Technical indicators don’t work in cases like these. The Euro has formed a trend on the hourly timeframe. Given that the Euro rally isn’t supported by any fundamental factors, there’s a high risk of a deep correction. I think that people will start buying Euros as the price falls to 1.1093. The downwards correction will get stronger if the price falls further than 1.1085. If it starts to grow again, I’m setting a target of 1.12. After this, the road to 1.1330/50 will be open.
Positives for the Euro (+):
Fundamental:
(+) US president Donald Trump favours a weaker dollar;
(+) Escalating political tensions in the US. Texas congressman Al Green has called on his colleagues to impeach President Trump;
Technical (short-term):
(+) According to data from 09/05/17, large speculators on the Chicago exchange have reduced short and long positions. Short positions have been reduced more than long ones by a factor of 12. Long positions have fallen by 2,899 to 152,481 contracts, while short positions have fallen by 34,758 to 127,553 contracts. The closing of short positions has resulted in an increased number of long positions. Net-long positions are now at 24,928 contracts;
(+) Small speculators have increased their long positions by 7,335 to 70,321 contracts. Short positions have fallen by 3,924 to 59,663 contracts. Long positions have again increased. Net-long positions currently stand at 10,658 contracts;
(+) According to myfxbook, the Short/Long ratio as of 7:27 EET is 91%/8%, lots: 37974/5310 (previous day: 39088/3646), positions: 77913/15579 (previous day: 73096/12846);
(+) US 10Y bond yields: 2.236% (down 2.69% from 17/05/17);
(+) EURGBP (W): AC, CCI (20), Stochastic (5,3,3) – up;
(-) ECB head: revision of ECB’s monetary policy not required at present. On the 10th of May, he added that the bank is in no hurry to raise interest rates or to halt its asset purchasing program;
(-) On Wednesday, the 17th of May, according to CME Group’s FedWatch, the probability of a rate hike in June has fallen from 69.2% to 64.6%, in July from 76.4% to 61.2% and in September from 82.9% to 80.9%;
Technical (short-term):
(-) German 10Y bond yields: 0.367% (down 14.45% from 17/05/17);
(-) Tension surrounding the situation with North Korea. Increased demand for safe haven assets;
(-) The US Congress has approved a temporary budget, avoiding a government shutdown for the time being. A week’s delay will give time for knocking out a draft budget for the rest of the fiscal year (end of September). It became clear on the 1st of May that Republicans and Democrats had settled on a compromise to keep the budget going until the 30th of September;
(+) Emmanuel Macron has been sworn in as the new president of France;
(+) S&P has reaffirmed Germany’s credit rating at AAA/A-1+ with a stable outlook.
Oil prices rebounded on Monday in volatile trading due to the announcements from major oil-producing countries that OPEC and non-OPEC supply cuts shall be extended into 2018. Saudi Arabia’s oil minister Khalid A. Al-Falih said during an interview that he expected OPEC and its partners to extend their deal for supply cuts into 2018 to eliminate a global glut. Benchmark Brent Crude rose by 0.5% or 27 cents at $49.37 a barrel, and U.S. light crude also increased to $46.43 a barrel by gaining 21 cents. The prices for West Texas Intermediate crude also had a modest rebound to $47 a barrel.
Growing Oil production from non-OPEC countries like US shale oil boom has caused an enormous pressure on oil prices and investors were concerned that global supply glut is not declining as fast as expected. The US crude oil production has increased by more than 10% since mid-2016 and reached the levels close to that top oil producers Saudi Arabia and Russia. The US is currently producing around 9.3 million barrels per day and this is their highest production output since August 2015. U.S. energy companies have continued to extend their oil drilling to minimise the dependency on OPEC oil as per statements from Baker Hughes Inc, the energy services firm on Friday. The market weakness resulted in a selling spree from the investors and they have cut bullish bets on Brent to the lowest level since November.
This has also undermined the efforts of OPEC and non-OPEC nations like Russia to control global oil supply with an output cut of 1.8 million BPD (barrels per day) during the 1st half of 2017. The comments from major oil producing nations that cuts might last till next year resulted in a modest rally of the oil prices and oil futures rose on Monday. Brent crude surged by 27 cents at $49.37 a barrel and the contract traded in a band between $45.73 and $46.98. Such sharp swings in the oil prices are an excellent opportunity for traders to make money using binary options strategies. They can accurately speculate the price movement of the oil based on the market news and gain significant profits.
Khalid Al-Falih, Saudi Arabia’s oil minister announced at the Asia Oil and Gas Conference in Kuala Lumpur on Monday that he hopes to extend the production cuts into the 2nd half of 2017 and possibility into next year as well. OPEC members are meeting in Vienna on May 25 to make a decision on extending agreement on production cut till next year. He also assured that OPEC members will do whatever it takes to rebalance the oil market and ensure that oil prices don’t fall down drastically. His announcement about the extension of production cuts caused some hope among investors and resulted in a modest rebound in global oil prices. He stated that the recent downfall in oil prices was due to various factors like refinery maintenance and seasonal low-demand apart from the non-OPEC production growth, particularly that of United States.
Even Kuwait’s oil minister Essam-al-Marzouq expressed his accord about extending this agreement. Russia also showed its consensus in prolonging the cuts with other OPEC members beyond 2017. Jeff Currie, head of commodities at Goldman Sachs stated at an S&P Global Platts Conference in London this week that investors should go long on Oil since the market is already in a supply deficit.
But market analysts are feeling that OPEC members are just giving false promises and not actually taking any action to reduce the stockpiles. For instance, the head of Commodity research at Commerzbank – Eugen Weinberg stated that “The market is getting tired of hearing from OPEC how good they are, how compliant (with supply curbs) they are”. He also stated that “Those claims do not withstand the reality check with the inventories staying stubbornly high and non-OPEC production rising strongly.”
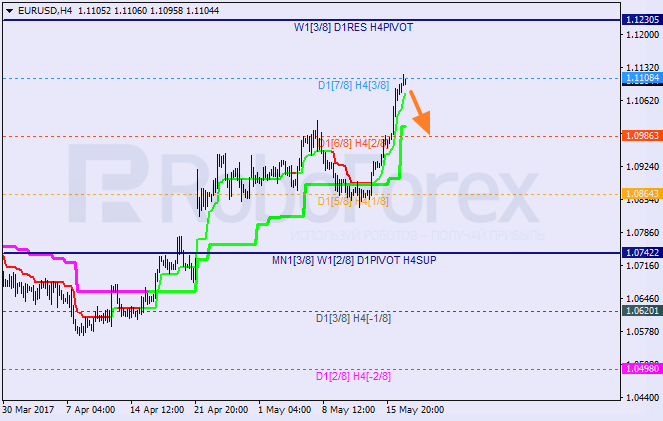
The EUR/USD pair has reached the 3/8 level and rebounded from it. Furthermore, on the D1 chart this level still serves as a 7/8 level. Consequenlty, in the near term we can see a descending correction develop towards 2/8 level. This correction is confirmed when the price breaks through H4 Super Trend line and holds under it.
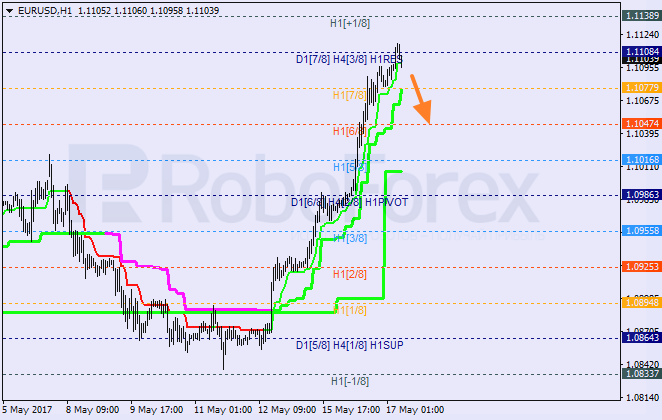
On the H1 chart the level 8/8 has acted as a resistance. If the chart breaks through the Super Trend line afterwards, a descending correction towards 6/8 will be possible.
GBP JPY “Great Britain Pound vs Japanes Yen”
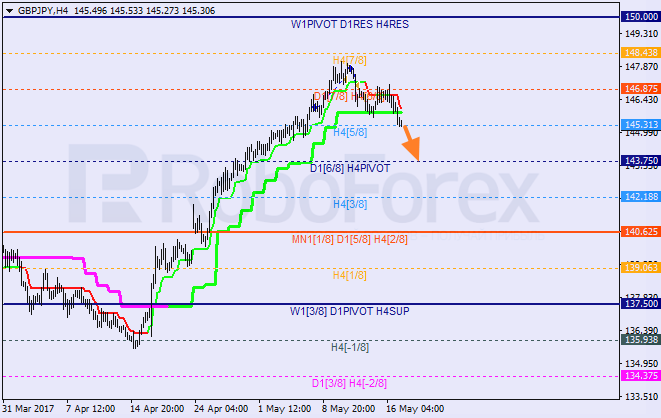
The cross-pair has broken through the nearest low and held under the Super Trend lines which in a few coming hours can form a “bearish cross”. Correspondingly, in the course of the day the pair can move even lower towards 4/8 level.
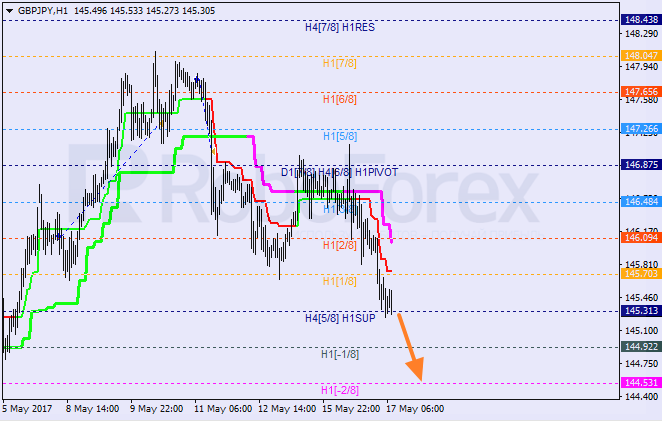
The H1 chart shows that after the yesterday’s rebound from the 4/8 level the market reached 0/8. If this one is broken, the bears can have enough power to lower the price further. If a breakout of -2/8 happens afterwards, the Murray analysis will be redrawn.
Attention! Forecasts presented in this section only reflect the author’s private opinion and should not be considered as guidance for trading. RoboForex LP bears no responsibility for trading results based on trading recommendations described in these analytical reviews.
The conventional military narratives highlight aggregate expenditures and downplay per capita spending. Realities are more nuanced, both globally and in Southeast Asia.
The conventional narrative is that China has become assertive, while the West is ignoring its defense needs. According to SIPRI research, in the past decade military spending in China and Russia increased 118% and 87%, respectively, while US spending plunged almost 5%.
Yet, the list of top-10 military spenders includes the US ($611 billion), China ($215 billion), Russia ($69 billion), followed by Saudi Arabia, India, major EU economies, Japan and South Korea. Together, they account for three-fourths of the total. Washington spends more dollars a year on its military than the next seven biggest spenders combined – which penalizes US living standards and stability abroad.
Moreover, the US is escalating. The Trump administration is planning a huge Reagan-style rearmament and requesting $54 billion; an almost 10% increase in a single year – even as its public debt amounts to $20 trillion (105% of US GDP).
Indeed, military spending should also be assessed in per capita terms. In this view, Saudi Arabia and the US lead, with $2,000 and $1,900 per person, respectively. The two are followed by Europeans, South Korea, Russia and Japan. In contrast, China and India come last (with just 8% and 2% of the US level, respectively).
In the past decade, increases in military budget in per capita terms have soared in Saudi Arabia (40%), but been slower in China and India (less than 15% each); and even less in Russia (6%). Moreover, in the past decade, per capita incomes in China and India increased strongly (10.8% and 8%, respectively). In both, military spending has increased faster but after a very low starting point.
There is a deep gap between current realities and perceptions of military spending. ASEAN nations are not an exception to the rule.
ASEAN’s military spenders
In Southeast Asia, the largest military spenders are the tiny Singapore ($10 billion) and Indonesia ($8.2 billion), followed by Thailand and Vietnam (about $5-6 billion), and Malaysia and Philippines (around $4 billion) (Figure 1).
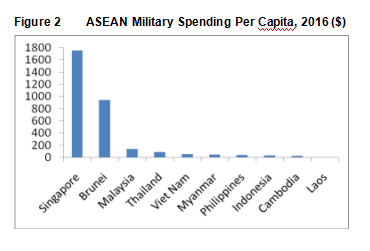
The per capita picture is very different. In this view, Singapore ($1,750) and Brunei ($940) are ASEAN’s big spenders, far ahead of Malaysia ($136). What this means is that, in per capita terms, Singaporeans spend on average 46 times more than the Filipinos in their military. In the past, Myanmar puts almost as much money into the military as Vietnam ($53) and more than the Philippines ($38), whereas Indonesia is a more moderate player ($31) (Figure 2).
So if Singapore is ASEAN’s Uncle Sam in per capita big spending, then Brunei is comparable to France, Malaysia to China and Philippines to India.
In effect, until 2010, the Philippines’ military expenditures decreased two decades from 1.6% to 0.8% as share of GDP. During the Aquino era, Washington initiated its pivot to Asia and Manila executed its pivot toward the US. In the process, the
Philippine military expenditures soared to almost 1.4% of GDP. In this view geopolitics rather than economic development motivated the Aquino priorities.
Economic development or military needs
If per capita incomes rise fast, then relative increases in military budgets are to be expected, and vice versa. In the past decade, per capita incomes rose by 4.2% in Singapore; but military expenditures even faster. In Brunei, the gap was worse as per capita incomes shrank by more than 0.4%, but military spending grew by 2.8%.
In per capita terms, such gaps between incomes and military spending are not sustainable over time. And as newly-industrialized economies are now stagnating and high prices do not favor oil exporters, policymakers must consider reassessments in the future or prepare for popular resentment.
Indeed, where gains in per capita incomes exceed those in military expenditures, economic development tends to prevail over defense. In Southeast Asia, these countries include Malaysia, Myanmar and Laos.
Conversely, where gains in per capita military spending exceed those in per capita incomes, defense needs tend to prevail over economic development. In addition to Singapore and Brunei, these countries include Cambodia, Indonesia, and Philippines in the past decade.
With scarce resources, there are always priorities. If nations truly seek economic development, they must often make difficult choices. The more countries focus on economic growth and the less they exhaust monies in military spending, the more they may enjoy rapid economic growth – and vice versa.
If ASEAN countries that still have relatively low per capita incomes seek rapid economic development, excessive military spending is the best way not to achieve the targeted economic objectives and an even better way to undermine social goals.
Living standards seldom rise fast in countries that favor geopolitics.
About the Author:
Dr Steinbock is the founder of the Difference Group and has served as the research director at the India, China, and America Institute (USA) and a visiting fellow at the Shanghai Institutes for International Studies (China) and the EU Center (Singapore). For more information, see http://www.differencegroup.net/
The original version was released by The Manila Times on May 15, 2017
The EUR/USD pair failed to complete the correction at 1.0970. Having completed a consolidation range, the market broke it bottom-upwards and elongated the ascending structure 2 times. Practically, the market has reached and exceeded its growth targets. For today, we’d consider a new consolidation range to develop on the current highs with a reversal pattern to descend along a downtrend. In our opinion, the 1st target is the mark 1.0970. In the short run the pair can hit a new high (and breake 1.1119). And then a down movement will occur.
The GBP/USD currency pair keeps moving inside the consolidation range. If it breaks through 1.2948 level it can rise towards 1.3000. If the price breaks through 1.2875 downwards, it can reach 1.2800.
The USD/CHF pair failed to hold above 0.9967 level. The market broke through the consolication range and elongated the descending wave 2 times. Practically, the market has worked out the whole its power. For today, we’d consider a new consolidation range to be developed on the current lows and create a reversal pattern. The 1st target for the current upward movement is 0.9967.
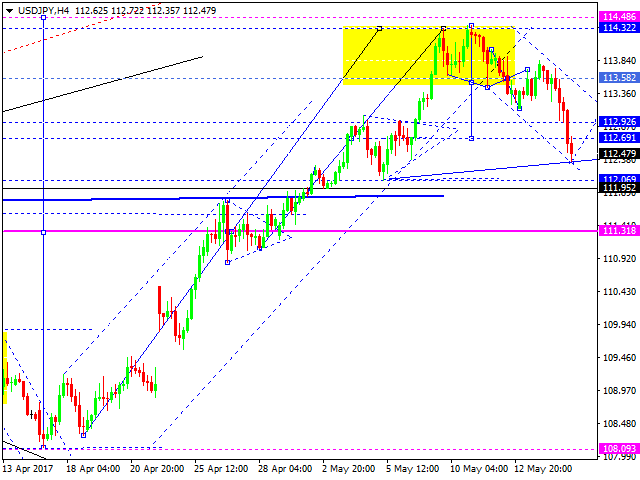
The USD/JPY pair has completed the 1st descending wave. At the moment the market is being traded along the channel of 1st descending wave. A test of 112.00 level from top downward is possible. Then a correction move towards 113.58 can occur.
The AUD/USD pair keeps developing the consolidation range on the top of rising structure. The pair can possibly break through 0.7444 and hit a new high. Then the most probable scenario will be continuation of the descending wave towards 0.7200.
As to the USD/RUB pair, for today we’d consider a possible growth towards 57.19 level. Then we’ll be expecting the 5th descending structure towards 55.50. After that a growth towards 57.20 is possible.
Gold has reached the ascending wave’s target. For the time being, the market has worked out the 3-wave structure. For today, we’d consider a correction towards 1230.00. Then an upward movement towards 1247.50 is possible.
Oil has broken through the 51.75 level for a short time. Practically, the market tells us to consider the 3rd wave to be completed. The next step is a correction towards 50.65 and a test of this level from top downward. Then the 5th wave can occur to reach 54.55.
Attention! Forecasts presented in this section only reflect the author’s private opinion and should not be considered as guidance for trading. RoboForex LP bears no responsibility for trading results based on trading recommendations described in these analytical reviews.
Macroeconomic overview: U.S. manufacturing production recorded its biggest increase in more than three years in April, bolstering the view that economic growth picked up early in the second quarter despite a surprise decline in homebuilding.
The broad strength in factory output reported by the Federal Reserve on Tuesday added to labor market data in suggesting the growth slowdown in the first quarter was temporary. That may allow the U.S. central bank to raise interest rates next month.
Manufacturing production jumped 1.0% last month, the biggest increase since February 2014, after falling 0.4% in March, the Fed said. The surge, which outstripped economists’ expectations for a 0.3% gain, reflected a 5.0% rebound in the production of motor vehicles and parts. There were also healthy increases in the output of machinery, fabricated metal products, appliances and furniture, business equipment and chemical products.
Manufacturing accounts for about 12% of the U.S. economy. Its recovery following a prolonged slump is being driven by a revival of the energy sector, which is spurring demand for machinery and other equipment.
In a separate report on Tuesday, the Commerce Department said housing starts dropped 2.6% to a seasonally adjusted annual rate of 1.17 million units, the lowest level in five months, hurt by persistent weakness in the construction of multi-family housing units.
While the weakness in residential construction implies a slowdown in homebuilding investment, the Atlanta Fed is forecasting gross domestic product increasing at a 4.1% annualized rate in the second quarter. The economy grew at a pedestrian 0.7% pace in the first three months of 2017.
Interest rate futures showed the market was still pricing in a nearly three in four chance that the Fed will implement a June hike, but that was down from over 80% a week ago. Investors were pricing in slightly below an even chance for two or more rate increases in 2017, despite central bankers’ stated view that they will hike two more times this year.
Data on Tuesday showed the Eurozone economy expanded 0.5% on quarter in the first three months of 2017, the same as in the previous period and in line with the preliminary estimate. Year-on-year, the Eurozone economy expanded 1.7%, easing from a 1.8% growth in the previous period and in line with earlier estimates.
Today’s data showed that Eurozone inflation was 1.9% yoy in April 2017, up from 1.5% in March. Core inflation amounted to 1.2% yoy. The data were in line with preliminary readings.
European Central Bank Executive Board member Benoit Coeure said the bank is not concerned by a recent rise in euro zone bond yields as they reflect improved growth prospects, receding fears of deflation and increased risks from outside the bloc.
The June meeting is going to be significant as investors are looking for changes in forward guidance. Possible changes in the forward guidance likely in June include dropping the “or lower” reference to rates and adjusting the “well past” language to just “past” reference to when rate hikes will happen after net asset purchases end. It will not be until September that the ECB reveals its tapering plans for 2018 but the June meeting will provide insight into possible future communication changes.
Technical analysis: The 61.8% fibo of May 2016 to January 2017 drop is close (1.1127) and this is a key resistance now. The pair is above the weekly cloud and the top of the cloud at 1.1067 has flipped to support.
Short-term signal: Stay long for 1.1130. Profit locked in at 1.1055.
Long-term outlook: Bullish
USD/JPY: Stay short for 111.60
Macroeconomic overview: The dollar deepened its losses against the yen on Wednesday. Pressure on the dollar increased after news that Trump asked his now-dismissed FBI Director James Comey to end the agency’s investigation into ties between former White House national security adviser Michael Flynn and Russia, according to a source who has seen a memo written by Comey.
The memo raises questions about whether Trump tried to interfere with a federal investigation at a time when investors were beginning to doubt that his administration would be able to get a divided U.S. Congress to support its promised policy steps.
Bank of Japan Governor Haruhiko Kuroda said he told premier Shinzo Abe that the central bank will continue its ultra-easy monetary policy in a meeting held on Wednesday. The BOJ has kept monetary policy steady since revamping its policy framework in September last year to one better suited for a long-term battle against deflation. With the economy recovering steadily, investors expect the BOJ’s next move to be a reduction of monetary stimulus rather than an expansion.
Technical analysis: The USD/JPY has suffered a setback, falling below 112.90 – 23.6% fibo of the April-May rise. Bulls will be hoping that the 38.2% retrace of the same move will stem the bleeding. In our opinion further downward move is more likely scenario.
Short-term signal: Stay short for 111.60. Stop-loss lowered to 113.20
Long-term outlook: Flat
GBP/USD: UK wage growth falls behind inflation
Macroeconomic overview: British pay growth lagged inflation for the first time in two-and-a-half years in early 2017, underscoring the growing Brexit squeeze facing many households.
Average wages excluding bonuses rose by 2.1% year-on-year in the first quarter of 2017, the weakest increase since July and below market expectations for a 2.2% rise. That meant regular pay, when adjusted for inflation, fell by 0.2% in the first three months of the year, the first fall since the third quarter of 2014.
The unemployment rate in the January-March period unexpectedly fell to its lowest level in nearly 42 years at 4.6%. The market had expected the rate to remain at 4.7%.
Overall, the data is likely to bolster the Bank of England’s view that it should keep interest rates at a record just above zero, despite the sharp rise in inflation so far this year which is likely to hit 3% before long. The BoE says that despite the fall in unemployment, there is little pressure on employers to raise pay sharply which could feed a more permanent inflation problem. The BoE said there was little sign that companies planned to raise annual pay awards above the 2.0-2.5% level of recent quarters.
Another survey published on Wednesday showed inflation gnawed further into the budgets of British households this month, resulting in the sharpest fall in cash available to spend in two-and-a-half years.
Last week, Bank of England Governor Mark Carney warned 2017 will be challenging for consumers, with inflation now almost certain to overtake wage growth.
Technical analysis: The GBP/USD remains above the 14-day exponential moving average, which keeps the bullish structure intact. On the other hand, the pair is still capped by the May 8 high at 1.2990 and a corrective move cannot be excluded. Key support levels are 1.2845 (May 12 low) and 1.2842 (38.2% fibo of April-May rise).
Short-term signal: Flat
Long-term outlook: Bullish
TRADING STRATEGIES SUMMARY:
FOREX – MAJOR PAIRS:
FOREX – MAJOR CROSSES:
PRECIOUS METALS:
How to read these tables?
1.Support/Resistance – three closest important support/resistance levels 2. Position/Trading Idea: BUY/SELL – It means we are looking to open LONG/SHORT position at the Entry Price. If the order is filled we will set the suggested Target and Stop-loss level. LONG/SHORT – It means we have already taken this position at the Entry Price and expect the rate to go up/down to the Target level. 3. Stop-Loss/Profit Locked In – Sometimes we move the stop-loss level above (in case of LONG) or below (in case of SHORT) the Entry price. This means that we have locked in profit on this position. 4. Risk Factor – green “*” means high level of confidence (low level of uncertainty), grey “**” means medium level of confidence, red “***” means low level of confidence (high level of uncertainty) 5. Position Size (forex)– position size suggested for a USD 10,000 trading account in mini lots. You can calculate your position size as follows: (your account size in USD / USD 10,000) * (our position size). You should always round the result down. For example, if the result was 2.671, your position size should be 2 mini lots. This would be a great tool for your risk management! Position size (precious metals) – position size suggested for a USD 10,000 trading account in units. You can calculate your position size as follows: (your account size in USD / USD 10,000) * (our position size). 6. Profit/Loss on recently closed position(forex) – is the amount of pips we have earned/lost on recently closed position. The amount in USD is calculated on the assumption of suggested position size for USD 10,000 trading account. Profit/Loss on recently closed position (precious metals) – is profit/loss we have earned/lost per unit on recently closed position. The amount in USD is calculated on the assumption of suggested position size for USD 10,000 trading account. About the Author:
Trading on the Euro again closed up on Tuesday. The pair extended its rally to grow by around 100 pips to 1.1097. Increased demand for the single currency was brought about by a slide in US bond yields, a general weakening of the dollar and the collapse of the resistance range from 1.1000 to 1.1022.
Due to the slide in bond yields, the probability of an interest rate hike in June has fallen. CME Group’s FedWatch has downgraded the probability of a rate hike in June from 73.8% to 69.2%, in July from 76.4% to 61.2% and in September from 82.9% to 80.9%.
The economic data coming out of the US is mixed. While industrial production for April exceeded expectations, the number of housing starts was lower than the forecast.
US statistics:
The number of housing starts in the US in April fell by 2.6% to 1.17 million houses (forecast: 3.7% to 1.26 million, previous reading: -6.6% to 1.203 million).
Industrial production rose by 1% in April (forecast: 0.4%, previous reading revised from 0.5% to 0.4%).
Market expectations:
In today’s Asian session, Euro-bulls continue their rally, which started on the 12th of May. The Euro/dollar gathered pace, broke the resistance at 1.0935 and the Euro index grew to 101.16. Now, the Euro is trading at 1.1104 and the Euro index is at 102.06. The closest resistance for the index is at 102.93 level, and the closest resistance for the Euro is at 1.1130 (61.8% of the downwards movement from 1.1616 to 1.0340). If the EUR/GBP cross strengthens past the 0.8600 mark, then the EUR/USD won’t stay at its current level.
The Euro is in a turbulent place at the moment, so I’m not making any predictions today. The time for drawing conclusions will be after the first wave of profit taking. There are no precursors for a reversal on the hourly timeframe apart from the fact that the price has reached the upper boundary of the U3 Moving Averages channel.
The bullish trend on the EUR/USD pair started with Friday’s statistics. A technical collapse of 1.10 level allowed buyers to push the price up to the 1.1117 mark.
During the American session, the price met with the U3 line after the release of disappointing statistics from the US housing market. There was no sharp rebound from the MA line following this. The pair then went into a consolidation phase on the U3 line.
The Euro has grown by 250 pips in the last 4 days without any rebounds. The TR trend line runs through 1.1053 on the current hour. A correction was due when the price reached the U3 line in the US session, but buyer optimism won’t allow this to happen just yet. According to myfxbook, the Short/Long ratio is currently 91%/8% or 39088/3646 lots. As the price increases, more and more people will want to sell. Some buyers are already cashing in on this growth and are afraid of opening any new long positions. I recommend using 1.1085 as a reference point. Yesterday, this marked the upper boundary of the up channel from 1.0871. A drop in the rate below 1.1085 would put pressure on bulls, forcing them to cash in on the positions they opened at a high price.
Positives for the Euro (+):
Fundamental:
(+) US president Donald Trump favours a weaker dollar;
Technical (short-term):
(+) According to data from 09/05/17, large speculators on the Chicago exchange have reduced short and long positions. Short positions have been reduced more than long ones by a factor of 12. Long positions have fallen by 2,899 to 152,481 contracts, while short positions have fallen by 34,758 to 127,553 contracts. The closing of short positions has resulted in an increased number of long positions. Net-long positions are now at 24,928 contracts;
(+) Small speculators have increased their long positions by 7,335 to 70,321 contracts. Short positions have fallen by 3,924 to 59,663 contracts. Long positions have again increased. Net-long positions currently stand at 10,658 contracts;
(+) According to myfxbook, the Short/Long ratio as of 7:59 EET is 91%/8%, lots: 39088/3646 (previous day: 26219/4279), positions: 73096/12846 (previous day: 61415/15707);
(+) US 10Y bond yields: 2.298% (down 1.71% from 16/05/17);
(+) German 10Y bond yields: 0.429% (up 2.14% from 16/05/17);
(+) EURGBP (W): AC, CCI (20), Stochastic (5,3,3) – up;
(-) ECB head: revision of ECB’s monetary policy not required at present. On the 10th of May, he added that the bank is in no hurry to raise interest rates or to halt its asset purchasing program;
(-) On Tuesday, the 16th of May, according to CME Group’s FedWatch, the probability of a rate hike in June has fallen from 73.8% to 69.2, in July from 76.4% to 61.2% and in September from 82.9% to 80.9%;
(-) Tension surrounding the situation with North Korea. Increased demand for safe haven assets;
(-) The US Congress has approved a temporary budget, avoiding a government shutdown for the time being. A week’s delay will give time for knocking out a draft budget for the rest of the fiscal year (end of September). It became clear on the 1st of May that Republicans and Democrats had settled on a compromise to keep the budget going until the 30th of September;
(+) Emmanuel Macron has been sworn in as the new president of France;
(+) S&P has reaffirmed Germany’s credit rating at AAA/A-1+ with a stable outlook.