Author Archive for InvestMacro – Page 553

Today’s Stunted Oil Prices Could Cause Oil Price Shock In 2020

By OilPrice.com

As oil prices remain unsteady and OPEC continues to make headlines every hour, the world is focused on oil’s immediate future. As Saudi Arabia announces plans to slash production and move their economy away from oil dependency, many industry insiders are predicting that the now over-saturated market will reach an equilibrium with higher commodity prices by 2018 and U.S. shale production will continue to grow along with global demand.

Robert Johnston, the CEO of one of the world’s biggest political risk consultancies, is unconvinced. In a speech made at the Association of International Petroleum Negotiators’ 2017 International Petroleum Summit, Johnston laid out his concerns for the future of oil.

What I don’t hear people asking is, ‘then what?’ Are the Saudis going to maintain these production cuts forever, or at some point do they have to start reversing that? I think in 2018 they will be reversing those production cuts,” he said. These important questions aren’t getting enough attention according to Johnston, whose firm Eurasia Group foresees a fast-approaching supply gap that Saudi Arabia and U.S. oil may not be able to fill.

Eurasia Group forecasts about 7 million barrels per day (MMbbl/d) of new crude supply by 2022. This includes about 5 MMbbl/d of U.S. shale growth and about 2 MMbbl/d from oil sands and deepwater extraction. But by the year 2022, another 15 MMbbl/d of new supply may be needed, as demand trends predict an annual growth rate of about 1 MMbbl/d. With this kind of impending discrepancy between supply and demand, the industry needs to start looking for new sources of oil, and quickly.

Despite the recent dip in oil prices, industry experts have been predicting a supply-gap and rising oil prices for years. This is due in large part to an oil investment drought marked by two year of consecutive decline, a statistic that has no precedent in the oil industry. This year a report by the International Energy Agency concluded that if oil investment remains stagnant over the next few years, by 2020 we will see a significant increase in the price of oil as global demand continues to climb.

The IEA’s Executive Director Fatih Birol addressed these findings in a keynote address at the Atlantic Council Global Energy Forum in Abu Dhabi in January, announcing that no major oil projects were started in the last year and there were zero large oil discoveries “because there is no money for exploration. You find something if you look for it,” Birol said

The potential supply gap has far-reaching implications that we are not ready to combat. Gas and oil are still fundamental to much of the world’s infrastructure, despite a steady increase of research and utilization of renewable energy resources. While electric cars continue to show a promising future, especially in the light of ambitious new green car policy initiatives in India and China, they still account for less than 2 percent of the world’s cars. And, as the global middle class continues to grow and exercise their buying power, the demand for oil will continue to grow alongside them.

The oil industry desperately needs new sources of oil, and they need new investors and technologies to find those sources quickly. There are currently a wide variety of techniques employed to find new deposits (seismic prospecting, well logging, gravity surveying, magnetic prospecting, and geochemical prospecting, etc.) but these are all methods with significant limitations in their ability to accurately estimate the size of new oil and gas deposits.

Many companies, including oil giant BP, have begun efforts to develop of artificial intelligence programs with algorithms that will allow them to find and drill with unprecedented accuracy in the future, but the technology is not yet ready. We can only hope that it will be ready by 2020 or that the IEA is wrong in their predictions.

Link to original article: http://oilprice.com/Energy/Energy-General/US-Shale-Is-Immune-To-An-Oil-Price-Crash-In-2017.html

By Haley Zaremba for Oilprice.com


EUR/USD: quotes expected to recede towards the trend line

By Gabriel Ojimadu, Alpari

Previous:

After trading on Friday, the Euro closed with some nice growth against the greenback. The price consolidated within a narrow range around 1.1108 during the Asian session. As trading opened in Europe, the rally continued. By the time of the US session, Euro-bulls had returned the rate to 1.1172. New York trading brought it up to 1.212.

While political tensions in the US have eased slightly, the general sentiment around the dollar remains the same. Its slide could be triggered by commodity currencies, who have strengthened on the back of rising oil prices.

Brent oil futures for July 2017 on the London ICE have risen by 2.09% to 53.61 USD per barrel, and on the WTI by 2.03% to 49.66 USD per barrel. In the space of a week, they’ve grown by 5.5% to 53.66 USD per barrel. Oil quotes rose without any large bounces on the expectation that OPEC will extend their agreement by 9 months to reduce oil production on the 25th of May.

FOMC member James Bullard added fuel to the fire when he cast doubt on the feasibility of an interest rate hike taking place in June, noting the economic slowdown that took place in the first half of this year as well as the fact that the labour market has been in decline since the Federal Reserve’s most recent meeting.

Market expectations:

In Asia, the Euro is trading down. Despite the sharp rise in oil prices, commodity currencies haven’t followed suit. Gold and yen are falling. On Friday, the 19th of May, according to CME Group’s FedWatch, the probability of a rate hike in June had risen from 73.8% to 78.5%, in July from 75.8% to 80.0% and in September from 82.4% to 86.1%.

Looking around, I can’t see any indications of further growth for the Euro. Looking at technical factors and the Euro index, the road to 1.13 is open for Euro-bulls. Given that the Euro closed up on Friday, I’m expecting today’s movements to go against that, as is my general rule. Quotes should fall to the trend line. So as to avoid risky sales, I think it’s better to avoid trading today, as there are no clearly defined sell signals and the profit/risk ratio is low.

Day’s news (GMT+3):

  • 13:00 Germany: German Buba monthly report;
  • 17:00 USA: FOMC member Harker’s speech;
  • 17:30 Australia: CB leading indicators (Mar). USA: FOMC member Kashkari’s speech;
  • 20:30 Australia: RBA deputy governor Debelle’s speech.

EURUSD rate on the hourly. Source: TradingView

Intraday forecast: low: 1.1161, high: 1.1210 (current in Asia), close: 1.1180.

On Friday the 19th of May, the Euro closed up. Euro-bulls held at the 112th degree. In Asia, the Euro is currently down, but the bulls are unlikely to give up so easily. The Euro’s rebound isn’t very deep, so there is a risk of an updated maximum. In this regard, there are more willing sellers than buyers for the Euro.

For Monday, I’m expecting the Euro to go against Friday’s movements towards the trend line at 1.1160 or the 45th degree at 1.1159. If there isn’t a flat on Friday, then I always go for opposing movement the following Monday. Statistics from the beginning of this year show that Monday’s candlesticks have closed in the opposite direction to Friday’s 79% of the time (15 weeks out of 19). If trading on the Euro closes up on Friday, it’ll close down on Monday and vice versa. This effect was weaker in 2016, with it only working 61.5% of the time. Movements in general were weaker and corrections not very deep. Personally, I won’t be trading today. If you’re looking to sell Euros, I suggest waiting until the Stochastic indicators on the EUR/USD and EUR/GBP pairs are in the sell zone.

Positives for the Euro (+):

Fundamental:

(+) US president Donald Trump favours a weaker dollar;

Technical (short-term):

(+) According to data from 16/05/17,  large speculators on the Chicago exchange have increased their long positions while reducing short ones. Long positions have increased by 10,500 to 162,981 contracts. Short positions have fallen by 3,863 to 123,690 contracts. Net-long positions have risen by 14,363 to 39,291 contracts;

(+) According to myfxbook, the Short/Long ratio as of 7:17 EET is 84%/15%, lots: 28082/5105 (previous day: 28678/6296), positions: 66326/15611 (previous day: 64703/19491);

(+) German 10Y bond yields: 0.363% (up 3.71% from 19/05/17);

(+) EURGBP (W): AO, AC, CCI (20), Stochastic (5,3,3) – up;

(+) EURGBP (D): AO – up;

(+) EURUSD (M): AO, AC, CCI (20), Stochastic (5,3,3) – up;

(+) EURUSD (W): AO, AC, CCI (20), Stochastic (5,3,3) – up;

(+) EURUSD (D): AO, AC, CCI (20), Stochastic (5,3,3) – up;

Negatives for the Euro (-):

Fundamental:

(-) ECB head: revision of ECB’s monetary policy not required at present. On the 10th of May, he added that the bank is in no hurry to raise interest rates or to halt its asset purchasing program;

(+) Small speculators have increased their long positions by 2,245 to 72,566 contracts. Short positions have fallen by 3,353 to 63,016 contracts. Net-long positions have fallen by 1,108 to 9,550 contracts;

(-) On Friday, the 19th of May, according to CME Group’s FedWatch, the probability of a rate hike in June has risen from 73.8% to 78.5%, in July from 75.8% to 80.0% and in September from 82.4% to 86.1%;

Technical (short-term):

(-) US 10Y bond yields: 2.235% (up 0.31% from 19/05/17);

(-) EURGBP (M): AC, AO, CCI (20), Stochastic (5,3,3) – down;

(-) EURGBP (D): AC, CCI (20), Stochastic (5,3,3) – down;

Built into the price:

(-) Tension surrounding the situation with North Korea. Increased demand for safe haven assets;

(-) The US Congress has approved a temporary budget, avoiding a government shutdown for the time being. A week’s delay will give time for knocking out a draft budget for the rest of the fiscal year (end of September). It became clear on the 1st of May that Republicans and Democrats had settled on a compromise to keep the budget going until the 30th of September;

(+) Emmanuel Macron has been sworn in as the new president of France;

(+) S&P has reaffirmed Germany’s credit rating at AAA/A-1+ with a stable outlook.

The importance of trust when choosing a broker

By Adinah Brown

The forex industry as we know it today has its roots as a reaction to the traditional high street bank. For years, trading in currencies was limited to professional currency traders, often employed by the banking fraternity. The everyday man was on the outside, desperately pressing his nose to the window like a child at a toy store.

The subsequent access of trading to everyone brought down the walls on an elite enterprise, democratizing and providing an opportunity to the masses to trade. An eager public rewarded the new brokers and trading with these new brokerages became instantly popular. It changed the face of an institution. And by doing so, changed the market.

The new trader is not one employed by a bank. This person could be a baker, lawyer, bricklayer, even your lazy cousin. The passing of time has softened the views of the traders against the high street banks, and most have a brokerage offering, easily available online. Many have done so for several years, leading the way in share trading and market analysis.

Today, the main difference between a “high street bank” broker and those which are not, is probably just the understanding amongst traders that the high street bank broker also functions as a bank. This certainly provides more comfort for the traders in terms of protection of funds, despite the demise of several large investment banks during the global financial crisis.

The reason that traders feel more comfortable with a bank, despite this recent display of fallibility from the banks, is based on the contrast – the high street bank is a known bricks and mortar entity, whilst the other brokerage options are somewhat unquantifiable. A trader does not need to ask of the banks “Who is the CEO?”, “Where do they operate?”, “How do they fund their activities?”, “Who is providing protection for our funds?” or the like. Because the primary business model is banking activities, much of the concerns about protection of funds are not relevant in the face of both government backed deposit guarantees and the strong underlying regulatory standards.

To a trader, trust is very important. Whilst the high street banks represent stability in terms of funds protection, the non-bank brokers work very hard to show that they are trustworthy. Obviously, regulations are in place to provide assurances for funds protection, but often brokers refer to the account holding structure and provide proof of the setup to traders to assuage their concerns about fund protection.

But many brokers, for various reasons, do not provide transparency. And because of the inability to associate them with a strong bricks and mortar type of industry, it breeds mistrust. Conversely, this allows the non-bank brokers to provide a strong business model, since they are not necessarily held down by the other activities and a larger infrastructure. Non-bank brokers can have a tight, dynamic, low cost structure, which will allow them to pass on a lower cost model.

At the end of the day, trust is a personal issue. Some traders trust the high street banks as safer, and others maintain a negative view of the banking sector and recognize its instability as well. Some feel that they are sufficiently protected by existing regulations and the individual assurances of the brokerages and the other traders who recommend them.

So whatever end of the spectrum a trader inhabits, the variety of offerings means that there is an option for everyone…. Trust me, I know.

About the Author:

Adinah Brown is a professional writer who has worked in a wide range of industry settings, including corporate industry, government and non-government organizations. Within many of these positions, Adinah has provided skilled marketing and advertising services and is currently the Content Manager at Leverate.


Stock Market Forecast and Fear Trading

By TheGoldAndOilGuy.com

The broad US stock market last week took a tumble sending a massive wave of fear through investors’ minds. On Wednesday May 17th the S&P 500 index plummeted 1.7% causing the fear index to jump a whopping 48% in a single session.

What does this mean and what should we expect going forward? I don’t see the recent drop as being anything to worry about at this point. It’s important to remember that some of that larges drops in stocks happen during a bull market (rising trend). In fact, these stand out sharp drops on the charts are nothing more than the market trying to buck investors out of the bull market (scare them out) before it continues higher.


The Market Trend Forecast Prediction

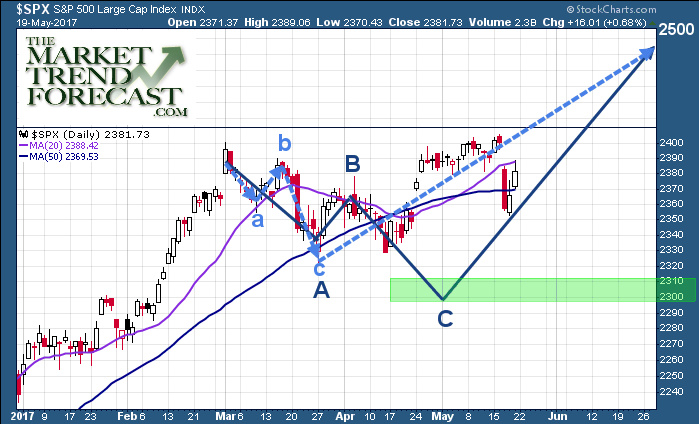
Look at the chart below courtesy of TMTF website. This chart was originally posted back in April with two potential price paths for the SP500 to reach the next price target of 2500. The overall forecast points to higher prices this summer with the potential of a major top forming late July or August.

I should caution that I believe there is potential for another washout low with the SPX dropping to the 2300 level still to reach that Elliott Wave level. Even if this level is hit, the overall market trend will remain bullish and would be fully rejuvenated for the next big leg higher.

TMTF--3


Fade the Fear – Swing Trading Fear

Let’s face it, we all know the feeling of when so one jumps out and scares us. The surge of blood pressure, adrenaline, and how our body jolts into action is a natural human response.

Fear among investors is almost identical when there is a sharp drop in price. Other than the fact that investors don’t typically scream, put up their fists and/or run away, instead they hit the SELL button to close out losing position in order to remove the fear/pain of further losses.

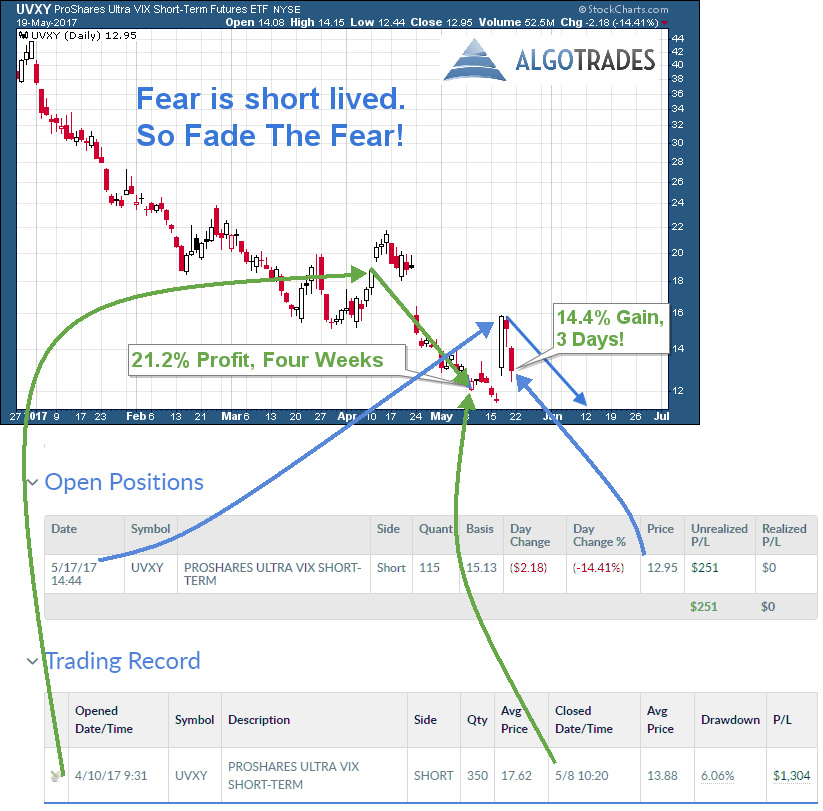
Typically, most traders panic out of positions at the same time (within a few trading days) and this sentiment shift can be seen as a price spike on the VIX chart.

Below you will see a chart and recent trades executed based on a strategy I have been testing for some time and recently started trading live. It is based around the fact that fear/panic is very short lived and fades away quickly. It is also based on the fact that leveraged VIX ETFs also fall in value over time because of how they have been designed. This allows us to short the long leveraged VIX ETF adding further potential gains to a falling VIX price.

vix-atn


Momentum Trade Extreme Panic & Greed

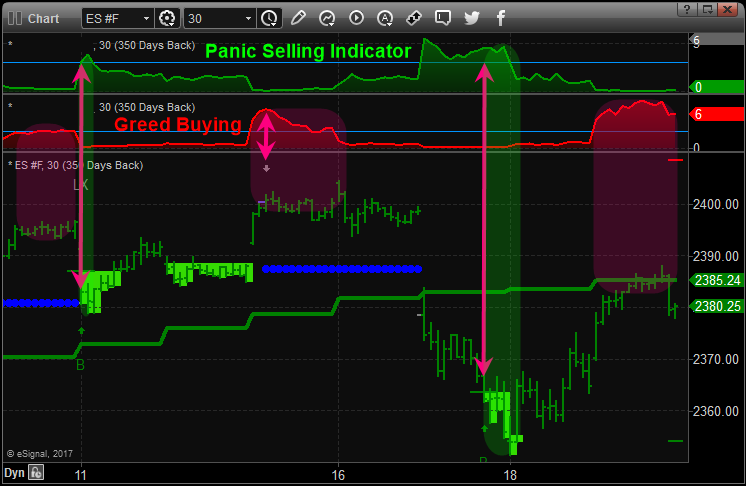
The two previous charts above were based on daily charts of the markets. This portion shows you the potential turning points and trade setups each week based on the 30-minute intraday chart. Some weeks can provide multiple trade setups if property identified.

The below chart is the SP500 continuous contract futures chart which I created and use for identifying turning points and trades in the broad market using SPY, SSO, SDS, or ES Mini Futures. This chart and its analysis also helps me identify when the VIX (Fear index) should be topping or bottoming as well.

Obviously, these moves are small and quick only lasting a day or two. But keep in mind if you have high probability trade setups and apply leverage like ES mini futures one can profit handsomely from small but frequent moves like this ranging between $250 – $1500 profit.

OB-OS


In Conclusion:

In short, the longer-term trend for US equities remains up (bullish). Based on the short-term 30-minute chart above stocks are a little overbought so a small pullback or pause is likely. While this week is a full trading week, it is going into a holiday weekend which typically favors higher stock prices by the closing bell on Friday.

In my next article, I plan to share with you what gold, silver, and miners are setting up for and it’s likely bigger and in the opposite direction than you think, stay tuned!

Finally, I want to mention that I will be getting back to my roots and passion in terms of article content. The past two years I changed gears to write more about the global economy and news. Recently I realized that I just don’t enjoy writing about these types of thing. Its all doom, gloom, corruption, and ridiculous actions but leaders around the world and not fun to write or read. So, I am thrilled to say that things will be back to how they were: Simple, technical analysis based forecasts and weekly trade setups.

Learn more about my daily price forecasts and turning points video: www.TheGoldAndOilGuy.com

Chris Vermeulen

Speculators boosted US Dollar bullish positions for 1st time in 4 weeks

By CountingPips.comGet our weekly COT Reports by Email

US Dollar net speculator positions rose to $13.5 billion last week

The latest data for the weekly Commitment of Traders (COT) report, released by the Commodity Futures Trading Commission (CFTC) on Friday, showed that large traders and currency speculators raised their bullish bets for the US dollar after three weeks of declining wagers.

Non-commercial large futures traders, including hedge funds and large speculators, had an overall US dollar long position totaling $13.5 billion as of Tuesday May 16th, according to the latest data from the CFTC and dollar amount calculations by Reuters. This was a weekly change of $2.5 billion from the $11.0 billion total long position that was registered the previous week, according to the Reuters calculation (totals of the US dollar contracts against the combined contracts of the euro, British pound, Japanese yen, Australian dollar, Canadian dollar and the Swiss franc).

Speculators had decreased their bullish positions to the lowest bullish level since October before last week’s rebound.


Weekly Speculator Contract Changes:

The individual major currency contracts saw more sharp movements this week with six major currencies seeing weekly changes above the 10,000 contract mark (the previous week had seen five currencies above that figure).

The euro continued to gain speculator bids after advancing into bullish territory on May 9th for the first time in three years while the Japanese yen fell for a third week and saw the largest shortfall in speculator positions on the week.

The major currencies that improved against the US dollar last week were the euro (15,205 weekly change in contracts), British pound sterling (13,803 contracts), New Zealand dollar (1,184 contracts) and the Mexican peso (151 contracts).

The currencies whose speculative bets declined last week versus the dollar were the Japanese yen (-23,701 weekly change in contracts), Canadian dollar (-11,785 contracts), Australian dollar (-19,440 contracts) and the Swiss franc (-5,966 contracts).


Table of Weekly Commercial Traders and Speculators Levels & Changes:

CurrencyNet CommercialsComms Weekly ChgNet SpeculatorsSpecs Weekly Chg
EuroFx-49951-167523760415205
GBP32005-11885-3299513803
JPY8235824465-60008-23701
CHF303093990-21162-5966
CAD1086849408-98000-11785
AUD8986250436344-19440
NZD13108-1119-107861184
MXN-75420-65170054151


This latest COT data is through Tuesday and shows a quick view of how large speculators or non-commercials (for-profit traders) as well as the commercial traders (hedgers & traders for business purposes) were positioned in the futures markets. All currency positions are in direct relation to the US dollar where, for example, a bet for the euro is a bet that the euro will rise versus the dollar while a bet against the euro will be a bet that the dollar will gain versus the euro.


Weekly Charts: Large Trader Weekly Positions vs Price

EuroFX:


British Pound Sterling:


Japanese Yen:


Swiss Franc:


Canadian Dollar:


Australian Dollar:


New Zealand Dollar:


Mexican Peso:

*COT Report: The weekly commitment of traders report summarizes the total trader positions for open contracts in the futures trading markets. The CFTC categorizes trader positions according to commercial hedgers (traders who use futures contracts for hedging as part of the business), non-commercials (large traders who speculate to realize trading profits) and nonreportable traders (usually small traders/speculators). Find CFTC criteria here: (http://www.cftc.gov/MarketReports/CommitmentsofTraders/ExplanatoryNotes/index.htm).

The Commitment of Traders report is published every Friday by the Commodity Futures Trading Commission (CFTC) and shows futures positions data that was reported as of the previous Tuesday (3 days behind).

Each currency contract is a quote for that currency directly against the U.S. dollar, a net short amount of contracts means that more speculators are betting that currency to fall against the dollar and a net long position expect that currency to rise versus the dollar.

(The charts overlay the forex closing price of each Tuesday when COT trader positions are reported for each corresponding spot currency pair.) See more information and explanation on the weekly COT report from the CFTC website.

Article by CountingPips.com


COT Report: US Dollar Speculator positions rebound, Gold & Silver bets tumble

By CountingPips.com

Here is a short summary and this week’s links (below) to the latest Commitment of Traders changes.

– Speculators stopped the 3-week slide and rebooted their bullish bets for the US dollar while many of the major currencies also saw big movements on the week with Euro longs rising higher.

WTI Crude speculative positions were virtually unchanged on the week and halted the sharp falls of the last three weeks in crude oil bets

– The 10-year note speculators continued to increase bullish positions for the fourth week out of the last five and to the highest speculative level since 2007

Gold speculators continued to sharply reduce their bullish bets for a third week and by more than -70,000 contracts in that time frame

Silver bets dropped for a fifth straight week and continued to fall off after a record high bullish position on April 11th

Copper speculative bets edged a bit higher although positions are below the 10,000 contract threshold for a 2nd week

– Large S&P500 speculative bets slightly rose on the week after two down weeks


Speculators boosted US Dollar bullish positions for 1st time in 4 weeks

US Dollar net speculator positions leveled at $13.5 billion last week

The latest data for the weekly Commitment of Traders (COT) report, released by the Commodity Futures Trading Commission (CFTC) on Friday, showed that large traders and currency speculators raised their bullish bets for the US dollar after three weeks of declining wagers. See full article


WTI Crude Oil Speculator net positions were virtually unchanged last week

The non-commercial contracts of WTI crude futures totaled a net position of 328,952 contracts, according to data from last week. This was a slight gain of just 201 contracts from the previous weekly total. See full article


Gold Speculators sharply cut their bullish net positions for 3rd week

The large speculator contracts of gold futures declined to a total net position of 126,724 contracts. This was a weekly drop of -23,282 contracts from the previous week. See full article


10 Year Treasury Note Speculators raised bullish net positions for 2nd week

The large speculator contracts of 10-year treasury note futures totaled a net position of 240,010 contracts. This was a weekly gain of 10,891 contracts from the previous week. See full article


S&P500 Speculators trimmed their bearish net positions last week

The large speculator contracts of S&P 500 futures totaled a net position of -4,571 contracts. This was a increase of 829 contracts from the reported data of the previous week. See full article


Silver Speculators continued to sharply pare back bullish net positions

The non-commercial contracts of silver futures totaled a net position of 43,004 contracts, according to data from last week. This was a weekly fall of -10,651 contracts from the previous totals. See full article


Copper Speculators bullish net positions edged slightly higher last week

The large speculator contracts of copper futures totaled a net position of 8,646 contracts. This was a weekly addition of 565 contracts from the data of the previous week. See full article


Article by CountingPips.com

The Commitment of Traders report data is published in raw form every Friday by the Commodity Futures Trading Commission (CFTC) and shows the futures positions of market participants as of the previous Tuesday (data is reported 3 days behind).

To learn more about this data please visit the CFTC website at http://www.cftc.gov/MarketReports/CommitmentsofTraders/index.htm


Gold Speculators sharply cut their bullish net positions for 3rd week

By CountingPips.comGet our weekly COT Reports by Email

Gold Non-Commercial Positions:

Large speculators continued to sharply cut back on their bullish net positions in the gold futures markets for a third straight week and brought the overall level to the lowest standing in eight weeks, according to the latest Commitment of Traders (COT) data released by the Commodity Futures Trading Commission (CFTC) on Friday.

The non-commercial futures contracts of Comex gold futures, traded by large speculators and hedge funds, totaled a net position of 126,724 contracts in the data reported through May 16th. This was a weekly drop of -23,282 contracts from the previous week which had a total of 150,006 net contracts.

Speculators have now reduced their bullish positions by over -70,000 contracts in the past three weeks which followed a streak of six straight weekly gains.

Gold Commercial Positions:

The commercial traders position, categorized by the CFTC as hedgers or traders engaged in buying and selling for business purposes, totaled a net position of -142,859 contracts last week. This was a weekly gain of 21,563 contracts from the total net of -164,422 contracts reported the previous week.

Gold ETF:

Over the same weekly reporting time-frame, from Tuesday to Tuesday, the GLD ETF, which tracks the price of gold, closed at approximately $117.65 which was a rise of $1.60 from the previous close of $116.05, according to ETF financial market data.

*COT Report: The COT data, released weekly to the public each Friday, is updated through the previous Tuesday (data is 3 days old) and shows a quick view of how large speculators or non-commercials (for-profit traders) as well as the commercial traders (hedgers & traders for business purposes) were positioned in the futures markets. The CFTC categorizes trader positions according to commercial hedgers (traders who use futures contracts for hedging as part of the business), non-commercials (large traders who speculate to realize trading profits) and nonreportable traders (usually small traders/speculators). Find CFTC criteria here: (http://www.cftc.gov/MarketReports/CommitmentsofTraders/ExplanatoryNotes/index.htm).

Article by CountingPips.com


WTI Crude Oil Speculator net positions were virtually unchanged last week

By CountingPips.comGet our weekly COT Reports by Email

WTI Crude Oil Non-Commercial Positions:

Large speculators and traders barely edged their net positions higher in the WTI crude oil futures markets last week, according to the latest Commitment of Traders (COT) data released by the Commodity Futures Trading Commission (CFTC) on Friday.

The non-commercial contracts of WTI crude futures, traded by large speculators and hedge funds, totaled a net position of 328,952 contracts in the data reported through May 16th. This was a weekly bump up of 201 contracts from the previous week which had a total of 328,751 net contracts.

Last week’s small rise ended a three week streak of sharp declines that took off over -115,000 contracts from the net position.

WTI Crude Oil Commercial Positions:

The commercial traders position, categorized by the CFTC as hedgers or traders engaged in buying and selling for business purposes, totaled a net position of -333,507 contracts last week. This is a weekly addition of 6,287 contracts from the total net of -339,794 contracts reported the previous week.

USO Crude Oil ETF:

Over the same weekly reporting time-frame, from Tuesday to Tuesday, the USO Crude Oil ETF, which tracks the price of WTI crude oil, closed at approximately $10.11 which was a rise of $0.54 from the previous close of $9.57, according to ETF market data.

*COT Report: The COT data, released weekly to the public each Friday, is updated through the previous Tuesday (data is 3 days old) and shows a quick view of how large speculators or non-commercials (for-profit traders) as well as the commercial traders (hedgers & traders for business purposes) were positioned in the futures markets. The CFTC categorizes trader positions according to commercial hedgers (traders who use futures contracts for hedging as part of the business), non-commercials (large traders who speculate to realize trading profits) and nonreportable traders (usually small traders/speculators). Find CFTC criteria here: (http://www.cftc.gov/MarketReports/CommitmentsofTraders/ExplanatoryNotes/index.htm).

Article by CountingPips.com


10 Year Treasury Note Speculators raised bullish net positions for 2nd week

By CountingPips.comGet our weekly COT Reports by Email

10 Year Treasury Note Non-Commercial Positions:

Large speculators boosted their bullish net positions in the 10-year treasury note futures markets for a second straight week last week, according to the latest Commitment of Traders (COT) data released by the Commodity Futures Trading Commission (CFTC) on Friday.

The non-commercial futures contracts of 10-year treasury note futures, traded by large speculators and hedge funds, totaled a net position of 240,010 contracts in the data reported through May 16th. This was a weekly gain of 10,891 contracts from the previous week which had a total of 229,119 net contracts.

Speculative positions have risen four out of the past five weeks and are now at the highest bullish level since 2007.

10 Year Treasury Note Commercial Positions:

The commercial traders position, categorized by the CFTC as hedgers or traders engaged in buying and selling for business purposes, totaled a net position of -41,248 contracts last week. This is a weekly decline of -16,740 contracts from the total net of -24,508 contracts reported the previous week.

IEF 7-10 Year Bond ETF:

Over the same weekly reporting time-frame, from Tuesday to Tuesday, the 7-10 Year Treasury Bond ETF (IEF) closed at approximately $106.26 which was a gain of $0.65 from the previous close of $105.61, according to ETF market data.

*COT Report: The COT data, released weekly to the public each Friday, is updated through the previous Tuesday (data is 3 days old) and shows a quick view of how large speculators or non-commercials (for-profit traders) as well as the commercial traders (hedgers & traders for business purposes) were positioned in the futures markets. The CFTC categorizes trader positions according to commercial hedgers (traders who use futures contracts for hedging as part of the business), non-commercials (large traders who speculate to realize trading profits) and nonreportable traders (usually small traders/speculators). Find CFTC criteria here: (http://www.cftc.gov/MarketReports/CommitmentsofTraders/ExplanatoryNotes/index.htm).

Article by CountingPips.com


S&P500 Speculators trimmed their bearish net positions last week

By CountingPips.comGet our weekly COT Reports by Email

S&P500 Non-Commercial Positions:

Large speculators slightly pared their bearish net positions in the S&P500 stock futures markets last week, according to the latest Commitment of Traders (COT) data released by the Commodity Futures Trading Commission (CFTC) on Friday.

The non-commercial futures contracts of S&P500 futures, traded by large speculators and hedge funds, totaled a net position of -4,571 contracts in the data reported through May 16th. This was a weekly gain of 829 contracts from the previous week which had a total of -5,400 net contracts.

Large SP500 speculators had decreased their net positions in the previous two weeks and brought the net level into negative territory for the first time since February.

S&P500 Commercial Positions:

The commercial traders position, categorized by the CFTC as hedgers or traders engaged in buying and selling for business purposes, totaled a net position of 5,756 contracts last week. This is a weekly decline of -1,149 contracts from the total net of 6,905 contracts reported the previous week.

SPY ETF:

Over the same weekly reporting time-frame, from Tuesday to Tuesday, the SPY ETF closed at approximately 240.08 which was a gain of 0.64 from the previous close of 239.44, according to market data.

*COT Report: The COT data, released weekly to the public each Friday, is updated through the previous Tuesday (data is 3 days old) and shows a quick view of how large speculators or non-commercials (for-profit traders) as well as the commercial traders (hedgers & traders for business purposes) were positioned in the futures markets. The CFTC categorizes trader positions according to commercial hedgers (traders who use futures contracts for hedging as part of the business), non-commercials (large traders who speculate to realize trading profits) and nonreportable traders (usually small traders/speculators). Find CFTC criteria here: (http://www.cftc.gov/MarketReports/CommitmentsofTraders/ExplanatoryNotes/index.htm).

Article by CountingPips.com