The popularity of exchange-traded funds fits with the market’s Elliott wave structure
By Elliott Wave International
Stock picking is losing favor. On the other hand, passive investing is growing in popularity. This fits with the stock market’s Elliott wave pattern. The mania is not over, but the end might be closer than many investors realize.
[Editor’s Note: The text version of the story is below.]
*********
Early summer dinner-party guests have gathered around the pool for a drink or two before dinner is served.
Two of the guests start talking about investing, and then one offers the other the all-too-familiar “stock tip.”
The recipient might nodd politely, but increasingly, those tips are going in one ear and out the other. Passive investing is what’s growing in favor (CNBC, June 26):
Exchange-traded funds, or ETFs, owned nearly 6 percent of the U.S. stock market as of the end of the first quarter, their greatest share on record.
Known as passive investments, ETFs are baskets of stocks tracking various market indexes and have grown in popularity for their relatively low fees. In contrast, mutual funds that involve higher-cost active stock picking have declined in popularity, and their ownership of the U.S. stock market has fallen to 24 percent, the lowest since 2004.
The article also notes that ETFS are on pace to buy $390 billion of stock this year, more than the last two years combined.
We’re not surprised by this latest ETF data. Indeed, our January 2017 Elliott Wave Financial Forecast showed this chart and said:
Notice that most of the rise in index funds’ market share has come since the mid-1990s. This rise also fits the wave structure, as The Elliott Wave Theorist observed in 1997 that the final advance of the Grand Supercycle bull market would not be an ordinary bull market. It is a mania, and “a very human aspect of manias is that no prudent professional is perceived to add value to a client’s investment experience.” … The historically unprecedented demand for index funds shows that some mania traits remain in place. The popular appeal of index funds will likely grow as stocks trace out the final waves of Primary wave 5.
The final wave of the entire investing mania may not be complete, but this massive push into passive investing tells us that we’re closer to the end than many investors might realize.
Now’s the perfect time to learn all you can about the market’s Elliott wave pattern. Our friends at Elliott Wave International have launched a new resource to show you what they see on the horizon. See below for full details.
3 Videos + 8 Charts = Opportunities You Need to See.
Join this free event hosted by Elliott Wave International and you’ll get a clear picture of what’s next in a variety of U.S. markets. After seeing this videos and charts you will be ready to jump on opportunities and sidestep risks in some major markets. This free report (a $29 value) will present a unique outlook and give you a new perspective on the markets you won’t get anywhere else.
This article was syndicated by Elliott Wave International and was originally published under the headline What the New Passive Investing Push Tells You. EWI is the world’s largest market forecasting firm. Its staff of full-time analysts led by Chartered Market Technician Robert Prechter provides 24-hour-a-day market analysis to institutional and private investors around the world.
In early May, 2017, we alerted our follwers to a trading opportunity that resulted in a nearly perfect Momentum Reversal Method (MRM) setup – this trade was MOBL (Mobileiron Inc). Now that the trade has completed, we wanted to share with you an example of how the MRM trading strategy works and how successful some of these setups can become. But first, lets take a bit of time to understand what ActiveTradingPartners.com is and how we provide benefit and services to our clients.
ActiveTradingPartners.com is a research and analytics firm that specialized in US Equities, ETFs and major Commodities analysis. Our objective is to continually provide updated research and analytics for our members as well as to actively deploy our specialized Momentum Reversal Method (MRM) trading strategy for our members use and benefit. As many of you may remember, on June 11 2017, we posted our research that the “NASDAQ would sell off” and the “VIX would SPIKE” on or near June 29th, 2017. How many of you would have loved to know that we predicted a 6% swing in the NASDAQ and a 52% swing in the VIX two weeks in advance on the EXACT DAY it happened? Read the article here (http://www.activetradingpartners.com/active-trader-predicts-vix-spike-nasdaq-selloff/)
What we are trying to illustrate to you is that we attempt to provide value beyond our trading signals and beyond our daily updates. We attempt to keep you aware of what is likely to happen in the global markets and how these swings can be advantageous for you as traders/investors. So, before we get sidetracked on the extras we provide, lets focus on this MOBL trade.
MOBL began to appear on our MRM alerts in early April 2017. As with many of the MRM type of setups, they begin can sometimes start to alert us to setups days or weeks in advance of the actual move. In this case, classic technical and Fibonacci analysis assisted in confirming our MRM trigger. The MRM setup was valid and we simply wanted to watch the MRM setup for signs of price volume/rotation. We often use this price/volume rotation trigger as a means of setting up entry functions for pending MRM triggers.
In early May 2017, the price/volume rotation trigger was complete and now we had a valid entry into MOBL with projected targets of $5.45 and $6.25. Our analysts identify the targets based on recent price action, where our entry is located and current price/volume rotation levels. In other words, if we believe the move will be short-term, then we will adjust our targets to focus on immediate objectives. If we believe the move will be a bit longer-term, then we will adjust our targets to focus on that objective.
Just to be clear, everything originates from the MRM trigger. We may see 20 or 30 of these triggers each week. From there, price confirmation MUST occur or have already happened in order for it to be considered for our ATP members. Additionally, we attempt to gauge the overall global markets in terms of risk parameters for each MRM setup/trigger. If the US majors or global markets are weak and fearful, then we’ll address that risk by being more selective of our MRM triggers and setups. If our analysts believe the US and global markets are going to continue to trend, then we may widen our risk parameters a bit more.
On May 11th, 2017, we issued a BUY Swing Trade Alert for MOBL @ $4.65 for a FULL Position. This exact alert read as follows:
Buy Symbol : MOBL Max Buy Price: $4.85 or lower Position Size: FULL Stop loss: Close below $3.95 Target: $5.45, then $6.25 objective for a 17~35%+ swing potential
Enter FULL position below $4.85 today. A move above $5.35 is expected with a potential for a move above $6.50 later.
As you can see from these charts, we executed the MOBL trade flawlessly. The first target was hit only 6 trading days after entry for a +17% gain. The second target took a bit longer, but it was eventually hit 26 trading days after entry (about one month after entry). It was just prior to the second target being hit that our research team indicated that MOBL could run much higher and that we should alert our members that we are going to use Target #2 as a stop adjustment and attempt to let this position run. Typically, we get about 2~4 of these types of trades each calendar year for our members – you know, the big breakout runners that can turn into 30%, 50%, 120% or more.
When all was said and done, Our VIX/NASDAQ analysis was perfect and the rotation in the tech markets resulted in our MOBL trade getting stopped out July 3rd, 2017 @ $5.85 for a +25.6% gain. This single trade resulted in a +$4000 total return for our members – this one trade will cover their ActiveTradingPartners.com membership for almost FOUR YEARS. Believe it or not, we are expecting MOBL to generate another MRM setup soon that could allow us to re-enter this trade for the next run higher.
This is an excellent example of how our Momentum Reversal Method strategy works and provides benefits for our clients. Not only do you receive these timely and accurate triggers, but you also receive our advanced research and market analysis. Like we said early, we alerted our members to a critical June 29th market move two weeks before it happened and our analysis hit perfectly. We like to ask our clients and viewers this question, “isn’t it time you invested in your future?”. We would really like to help you achieve greater success and find greater opportunities in the markets, but you have to subscribe at ActiveTradingPartners.com for this to happen.
Isn’t it time you invested in quality, logical trade research your future? CLICK HERE TO JOIN
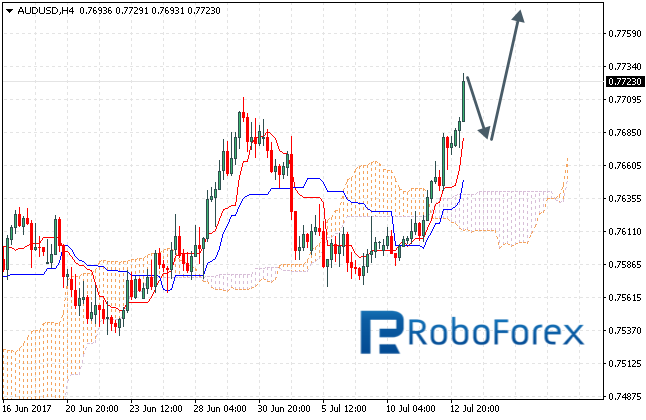
The AUD/USD pair is trading at 0.7722; it is moving above Ichimoku Cloud, which means that it may continue growing. We should expect the price to test Tenkan-Sen and Kijun-Sen close to 0.7685 and then continue moving upwards above 0.7780. However, this scenario may be cancelled if the price breaks the downside border of the cloud and fixes below 0.7580. In this case, the instrument may continue falling towards 0.7490.
NZD/USD, “New Zealand Dollar vs US Dollar”
The NZD/USD pair is trading at 0.7305; it managed to break the upside border of Ichimoku Cloud, which means that the tendency may reverse upwards. We should expect the price to test the upside border of the cloud at 0.7295 and then continue moving upwards to reach 0.7350. However, the scenario that implies further growth may be cancelled if the price breaks the downside border of the cloud and fixes below 0.7270. In this case, the instrument may continue falling towards 0.7220 and lower.
USD/CAD, “US Dollar vs Canadian Dollar”
The USD/CAD pair is trading at 1.2749; it is still moving below Ichimoku Cloud, which means that it may continue falling. We should expect the price to test Tenkan-Sen and Kijun-Sen at 1.2805 and then continue moving downwards to reach 1.2590. However, this scenario may be cancelled if the price breaks the upside border of the cloud and fixes above 1.2970. In this case, the instrument may continue growing towards 1.3120 and higher.
Attention! Forecasts presented in this section only reflect the author’s private opinion and should not be considered as guidance for trading. RoboForex LP bears no responsibility for trading results based on trading recommendations described in these analytical reviews.
On Wednesday, trading on the euro closed down. Market volatility was high as Janet Yellen’s pre-prepared remarks were published a well as while she was giving testimony to Congress. She remarked that the US economy was growing fast enough for another rate hike and to continue normalising the Fed’s balance sheet.
The dollar strengthened against its major rivals on this news. In theory, it should have begun to weaken against the euro by the end of the day, given that the US regulator doesn’t feel it necessary to sharply raise interest rates. US bond yields sharply fell in response to the comments. Depending on the data to come out over the course of the rest of the year, the American central bank may decide to raise interest rate one more time this year, and that’s all. I think it most likely that there’s some crowd psychology at play here. The market swung downwards and buyers started closing their long positions, which caused the euro to slide by 98 pips to 1.1392.
Day’s news (GMT+3):
09:00 Germany: CPI (Jun);
10:15 Switzerland: producer and import prices (Jun);
11:30 UK: BoE credit conditions survey;
15:30 Canada: new housing price index (May);
15:30 USA: PPI (Jun), initial jobless claims (7 July), PPI ex food and energy (Jun);
17:00 USA: Fed’s Yellen testifies;
18:30 USA: Fed’s Evans speech;
20:00 USA: FOMC member Brainard speech, 30-year bond auction;
21:00 USA: monthly budget statement (Jun).
EURUSD rate on the hourly. Source: TradingView
A breakout of the trend line occurred at the low of 1.1312, but the subsequent rebound to 1.1392 made it a false one. The euro has been finishing rather weakly over the past few days. Buyers didn’t allow the formation of a bearish engulfing.
The euro rate has since recovered to 1.1444. The 45th degree runs through 1.1445. My forecast is based purely on technical factors, but let’s not forget that Janet Yellen will be speaking again today and that US bond yields are down. The price could easily return to 1.1490 and continue higher.
It’s also worth noting that the price is rising with low trading volume. Consider the idea that buyers who didn’t manage to close their long positions in time for Yellen’s testimony should use the current rebound to cash in on them. There should be a higher volume, but there isn’t. Because of this, there are two potential scenarios. The first is that the pair will trade flat at its current level until the opening of the US session (accumulation phase), and then with increased volume, the price will go up with the trend to 1.15. The second scenario is that the price will fall to 1.1380 or lower, and those buyers still sitting on long positions will incur losses as their stop levels are activated. You’ll have to play it as you see it. All traders have a different line of sight, so while buyers may be right on one timeframe, sellers could be right on another.
I remind you once again that this forecast does not account for Janet Yellen’s testimony.
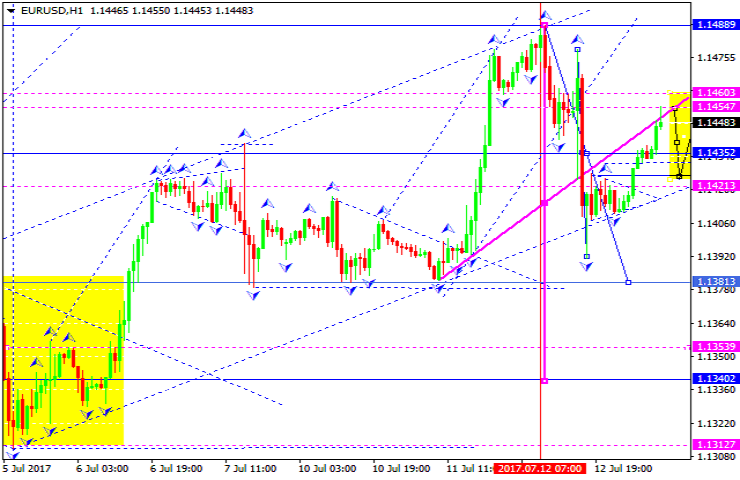
The EUR/USD pair has finished two descending impulses and right now is being corrected. Possibly, the price may reach 1.1454 and then fall towards 1.1424. After that, the instrument may grow to reach 1.1460 and then start another descending wave with the target at 1.1381.
GBP USD, “Great Britain Pound vs US Dollar”
The GBP/USD pair has broken its consolidation channel upwards and right now is growing with the target at 1.2935. This structure may be considered as a correctional one. Later, in our opinion, the market may start another descending wave to reach 1.2794.
USD CHF, “US Dollar vs Swiss Franc”
The USD/CHF pair is being corrected to the downside. We think, today the price may reach 0.9619 and then grow towards 0.9636. After that, the instrument may form another descending structure with the target at 0.9613 and complete the correction. Later, in our opinion, the market may continue growing towards 0.9655.
USD JPY, “US Dollar vs Japanese Yen”
The USD/JPY pair is trading to rebound from 113.32 to the downside. The target of the wave is at 112.19. Later, in our opinion, the market may be corrected to return to 113.32.
AUD USD, “Australian Dollar vs US Dollar”
The AUD/USD pair is attempting to break the top of the ascending wave. Possibly, the price may reach 0.7754. Later, in our opinion, the market may fall towards 0.7533.
USD RUB, “US Dollar vs Russian Ruble”
The USD/RUB pair is moving downwards. The first target is at 59.71. After that, the instrument may grow with the target at 60.20 and then continue falling towards 58.57.
XAU USD, “Gold vs US Dollar”
Gold is forming the fifth ascending structure with the target at 1228.77. Later, in our opinion, the market may be corrected towards 1216.77 and then move upwards to reach 1240.20.
BRENT
Brent has reached the local target of the ascending structure and the correction. Possibly, today the price may grow to reach 49.90. Later, in our opinion, the market may be corrected towards 47.70 and then start another growth with the target at 50.20.
Attention! Forecasts presented in this section only reflect the author’s private opinion and should not be considered as guidance for trading. RoboForex LP bears no responsibility for trading results based on trading recommendations described in these analytical reviews.
Two months ago I interviewed Dwayne Melrose, Director & Chair of the Technical Committee for LiCo Energy Metals [TSX-V: LIC / OTCQB: WCTXF]. Since then there has been a number of noteworthy press releases, and the Cobalt price continues to rise. In addition, Bearing Lithium’s 17.7% pro forma interest in a Chilean Maricunga project (a ~4,400 hectare project valued by the market at about C$280 M) is getting a major mineral resource upgrade this month, and a rumor that a Chinese PE firm might acquire up to 20% of NYSE: SQM sent Wealth Minerals’ shares up ~10% on July 5th.
Here’s a brief recap of 3 developments at LiCo from just the past 3 weeks….
As of June 22nd, Greg Reimer joined LiCo’s Advisory Board. Greg is EVP of BC Hydro’s Transmission & Distribution Network. BC Hydro is Canada’s 3rd largest Electric Utility with over 4 M customers and $5.7 billion in revenue. {See press release}
In a press release dated June 28th, LiCo announced that, in conjunction with the Purickuta project, it’s opening an exploration & development office in Santiago, Chile.
“Beneath the surface crust is detected a conductive unit with values of resistivity less than 1 ohm-m, (interpreted as brines) divided into 2 sub units; a high-conductivity saturated unit (0.4 to 0.9 ohm-m) 6.3 to 22 meters thick, and a very high-conductivity saturated unit (0.2 to 0.4 ohm-m) detected at two depths, the first under the saline crust with thickness of 3 and 7 m, then again under the unit of high-conductivity with a thickness of 100 m, not detecting the floor of this stratum,” (meaning beyond the detective depth capacity of the TEM survey).
Each of these events is significant in building out key components of the Company, especially the reading of the geophysical results, which suggest full speed ahead on initial drilling. Regarding Mr. Reimer, I believe that a senior executive with his green energy credentials choosing LiCo to express optimism on surging Li & Cobalt (“Co“) demand is a meaningful vote of confidence in the Company.
Boots on the ground is one thing, some juniors barely have that, but opening an office, “in- country” is another thing entirely. For example, in looking at roughly 20 Canadian & Australian-listed Li juniors that have optioned, leased or own Li properties in Argentina, few have in-country offices. Director Melrose’s comment from my earlier interview appear to be accurate,
“I’ve been impressed at how rapidly we have been able to move the ball forward on our projects. That’s something that attracted me to LiCo Energy, a corporate culture of getting things done and being properly funded to work quickly and efficiently.”
Behind the scenes, discussions continue….
Management, consultants & advisors continue to review lithium & cobalt assets in Canada, Chile & Argentina.
Did someone say “Cobalt?” “Canada?” Notice last week’s blockbuster news that First Cobalt Corp. intends to combine Australia’s Cobalt One and Vancouver’s Cobaltech Mining into a pro forma entity with a $160 M market cap. I think this is great news for LiCo’s Teledyne project. In my mind, this pretty much assures cobalt production will be returning to the immediate area, an area measured in just thousands of square kms. Talk about close-ology, and on a prolific past producing mine site, with valuable underground mine workings. The only thing better would be if LiCo could lockdown additional property….. they’re working on that.
LiCo was one of the first companies to assemble both Li & Co assets into a single company, and one of the few willing to take a Li leap into Chile. Next up, how about a first mover to combine Li & Co assets in Chile? Yes, there are discussions being held on that front.
For more about progress in Chile, I caught up with Malcolm Bell, a consultant with over 45 years’ experience either as principal, director, or senior officer of private & public resource companies. {see bios of officers, directors & technical advisors}
Malcolm, I understand that LiCo Energy Metals is keeping you busy, what have you been up to?
On LiCo’s behalf I’ve been to Chile 5 times and Argentina twice. Of the two places, Chile seems to have better lithium opportunities at the moment. The salar de Atacama, the Salar itself, not the surrounding desert, is the largest & highest-grade source of lithium brines on the planet, and that’s where LiCo’s flagship project is located. Nearly 40% of the world’s production comes from this single region.
How about Argentina, are you seeing interesting assets there?
Yes, both countries have high-quality assets and reasons to be excited, but the infrastructure in Chile is much better. At the Atacama, I can stay at a 4-5-star hotel that’s a 30-minue walk from the edge of the salar. There’s a national highway running across LiCo’s concession, plus a natural gas pipeline and power transmission lines nearby. Argentina’s salars, for the most part, are more remote and sit at higher elevations.
Some investors have questioned the size / scale of the Purickuta project (160 hectares). Is it too small to be a viable lithium brine operation?
It could be too small, but LiCo is actively seeking to expand that footprint. And look, it all depends on brine chemistry, flow rates and extraction / processing methodology, among other things. Readers comparing each Li brine junior they come across to say a Lithium Americas Corp (TSX: LAC) are probably making a mistake. LiCo need not produce 25,000 Mt of LCE to be a winner. There are many possible roads to viability.
LiCo plans to drill a hole in late July or early August to begin the investigation of brine chemistry and flow rate characteristics. If a solid Li grade and flow rate can be determined (no direct evidence of this yet) then even one production well could potentially lead to a viable business for a company with a market cap of just few thousand tonnes of LCE/year. However, a production outcome would likely be predicated on the use of an advanced extraction / processing solution such as Tenova Bateman’s, which hasn’t been proven at commercial scale.
Why do some investors seem to believe that Li juniors will have a very difficult time in Chile? A more difficult time than in Argentina?
I’m not sure why that is, but I take your point. There are, what, about 20 Li juniors in Argentina, but only 4 or 5 in Chile? I think there’s less available property in the (possibly fewer) Li sweet spots. There’s a perception of widespread disagreements (legal, tax, royalties, fraud, corruption) and uncertainties among SQM, Albemarle / (Rockwood), Corfo, etc. But the Rule of Law is strong in Chile. Long-lasting problems attached to these large players are tied to corporate / governmental politics of which juniors should be relatively immune.
Conclusion
LiCo Energy Metals [TSX-V: LIC / OTCQB: WCTXF] is making impressive moves in Cobalt & Lithium in Canada & Chile. The price of Cobalt continues to rise. Punctuated by First Cobalt’s proposed merger with Cobalt One and Cobaltech, all eyes are on the prime property surrounding the town of Cobalt, Ontario. LiCo’s Teledyne project is in the middle of that fairway and management is pursuing a significant expansion there. In Chile, not only is a substantially larger Li footprint a good possibility, management is carefully considering a few really interesting cobalt prospects. Unlike in Argentina, there are only a few Li juniors to choose from in Chile. LiCo has a lot of bases covered and a lot of discussions underway that could lead to important news in July & August, in Cobalt and Lithium, in Canada and Chile.
Disclosures: The content of this article is for illustrative and informational purposes only. Readers fully understand and agree that nothing contained herein, written by Peter Epstein of Epstein Research, [ER]including but not limited to, commentary, opinions, views, assumptions, reported facts, estimates, calculations, etc. is to be considered implicit or explicit, investment advice. Further, nothing contained herein is a recommendation or solicitation to buy or sell any security. Mr. Epstein and [ER] are not responsible for investment actions taken by the reader. Mr. Epstein and [ER] have never been, and are not currently, a registered or licensed financial advisor or broker/dealer, investment advisor, stockbroker, trader, money manager, compliance or legal officer, and they do not perform market making activities. Mr. Epstein and [ER] are not directly employed by any company, group, organization, party or person. Shares of LiCo Energy Metals are highly speculative, not suitable for all investors. Readers understand and agree that investments in small cap stocks can result in a 100% loss of invested funds. It is assumed and agreed upon by readers that they consult with their own licensed or registered financial advisors before making investment decisions.
At the time this article was posted, Peter Epstein owned shares in LiCo Energy Metalsand the Company was an advertiser on [ER]. By virtue of ownership of the Company’s shares and it being an advertiser on [ER], Peter Epstein should be considered biased in his views on the Company.Readers understand and agree that they must conduct their own research, above and beyond reading this article. While the author believes he’s diligent in screening out companies that are unattractive investment opportunities, he cannot guarantee that his efforts will (or have been) successful. Mr. Epstein & [ER] are not responsible for any perceived, or actual, errors including, but not limited to, commentary, opinions, views, assumptions, reported facts & financial calculations, or for the completeness of this article. Mr. Epstein & [ER] are not expected or required to subsequently follow or cover events & news, or write about any particular company or topic. Mr. Epstein and [ER] are not experts in any company, industry sector or investment topic.
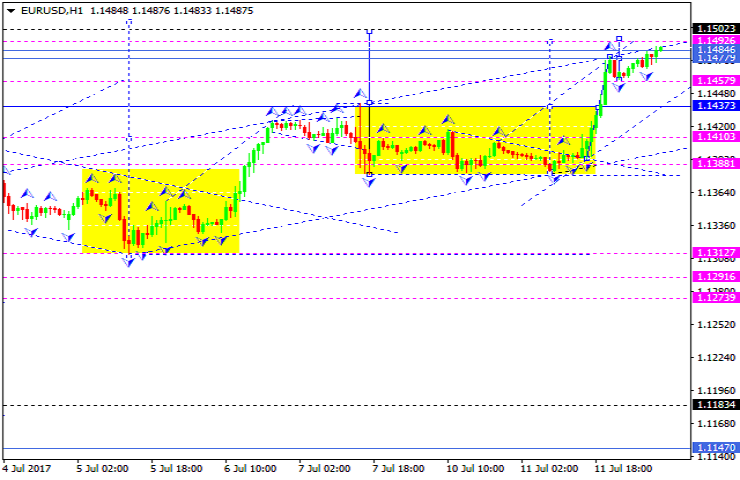
The EUR/USD pair has reached another high, expanded the consolidation range to the upside, and may yet continue growing towards 1.1500. Taking into account that the market has already reached the targets of the ascending wave, it may start plummeting at any moment. Possibly, the pair may grow and try to reach 1.1492 (alternative scenario). According to the main scenario, the instrument is expected to move downwards with the first target at 1.1388.
GBP USD, “Great Britain Pound vs US Dollar”
The GBP/USD pair is consolidating near the lows of the descending wave. Possibly, today the price may grow to reach 1.2890 and then return to 1.2845, thus defining the borders of this consolidation range. If later the instrument breaks this channel to the upside, the market may start another correction to reach 1.2935; if to the downside – falling with the target at 1.2817 and then start the above-mentioned correction.
USD CHF, “US Dollar vs Swiss Franc”
The USD/CHF pair has extended the correction downwards. We think, today the price may grow to reach 0.9643. After that, the instrument may break the above-mentioned level and then continue growing towards 0.9676 or even extend this wave to reach 0.9700.
USD JPY, “US Dollar vs Japanese Yen”
The USD/JPY pair has finished the descending impulse. We think, today the price may be corrected towards 113.89 and then continue falling with the target is 112.70.
AUD USD, “Australian Dollar vs US Dollar”
The AUD/USD pair is attempting to extend the correction towards 0.7670. Later, in our opinion, the market may fall to break 0.7550. The target is at 0.7400.
USD RUB, “US Dollar vs Russian Ruble”
The USD/RUB pair is consolidating at the top of the ascending wave. Possibly, today the price may break the downside border of this consolidation range and reach 59.70. After that, the instrument may be corrected with the target at 60.00 and then continue falling inside towards 58.57.
XAU USD, “Gold vs US Dollar”
Gold has broken the consolidation channel upwards and may yet continue growing to reach 1228.77. Possibly, the market may be corrected towards 1217.00 and then move upwards with the target at 1252.00.
BRENT
Brent has also broken the consolidation range to the upside and may grow to reach 48.60. Later, in our opinion, the market may be corrected towards 47.5 and then start another growth with the target at 50.30.
Attention! Forecasts presented in this section only reflect the author’s private opinion and should not be considered as guidance for trading. RoboForex LP bears no responsibility for trading results based on trading recommendations described in these analytical reviews.
The Australian Dollar continues rising against the USD on Wednesday. The current quote for the instrument is 0.7645. Today’s statistics from Australia was quite neutral. The Westpac Consumer Sentiment added 0.4% in July and increased up to 96.6 points after losing 1.8% and falling up to 96 points the month before. Westpac, which monitors the indicator dynamics, says that there are no really positive factors in the consumer prices sector so far. The indicator had been falling for three months in a row, and the July growth is just the first step on the way to stabilization. It is thought that the higher the Consumer Sentiment index, the better for the national currency.
However, these days the Aussie mostly relies on the USD weakness. The American Dollar is getting more and more troubled, and other currencies are trying to benefit from it. Apart from a low-intensity political scandal featuring, theoretically, Donald Trump, Russia, the Congress, and others, the USD is being pressured by the market expectations of what Janet Yellen, the Fed Chair, might say. She is going to speak in the Congress today and tomorrow and may, one way or another, touch upon fiscal policy matters, the economic outlook, and future steps of the Fed relating to the rate increase. The USD is expecting nothing really positive from Yellen and, as a result, retreating, thus providing other currencies with a chance.
Attention! Forecasts presented in this section only reflect the author’s private opinion and should not be considered as guidance for trading. RoboForex LP bears no responsibility for trading results based on trading recommendations described in these analytical reviews.
On Tuesday the 11th of July, trading on the euro closed significantly up. Before the US session, the price was trading within a 20-pip range. The price exited this range as BoE representative Broadbent gave his speech and the euro/pound cross sharply rose. US bond yields fell by 1% to 2.37%.
Later in the day, it was revealed to the market that US president Donald Trump’s son, Donald Jr., published email transcripts on Twitter of his correspondence about meetings with Russian lawyer Natalya Veselnitskaya and American music promoter Rob Goldstone, who organized the meeting. Trump Jr. was expecting to receive some compromising information about Hillary Clinton.
Now, the media is using this correspondence to reinforce their accusations against President Trump having ties with Russia. Trump Jr. was forced to release the emails before anyone else as the New York Times had already partially revealed their content. As a result, the US dollar index fell to 95.65, US bond yields fell to 2.35% and the dollar fell against the euro to 1.1480.
17:00 Canada: BoC monetary policy report and interest rate decision;
17:00 USA: Fed’s Yellen testifies;
17:30 USA: EIA crude oil stocks change (7 Jul);
18:15 Canada: BoC press conference;
20:00 USA: 10-year note auction;
21:00 USA: Fed’s beige book.
EURUSD rate on the hourly. Source: TradingView
On Tuesday, BoE member Broadbent, as well as Trump Jr. helped the euro bulls bring the euro rate up to 1.1480. In Asia, the euro rose to 1.1489.
The price has deviated from the LB balance line by 0.62% and from the low of 1.1380 by 90 degrees. The U3 MA line runs through 1.1533 and the 112th degree through 1.1514. These are the levels that the price could reach if Janet Yellen disappoints dollar buyers. She’s giving testimony to Congress on Wednesday and Thursday.
The EURUSD has hit a new 52-week high. Now it’s an open question of whether the euro/dollar rate will fall with the euro/pound cross or the pound/dollar will catch up with the other pairs. The euro/pound cross has helped the euro strengthen against the dollar. If people start profit-taking here, the euro/dollar could also fall.
The price is currently slightly above the daily A-A channel. If the day closes above 1.1470, it’ll open the way towards 1.1595/1.16. Without any corrections on the euro/pound cross, the euro/dollar rate could reach 1.16 by way of a saw tooth model.
I’ve decided not to make a forecast with Yellen’s testimony looming. Speeches from central bank representatives and newsmakers could easily break all technical models and signal indicators. In the last few days, buyers have stopped the formation of a double top model.
Learn how to put the power of the Wave Principle to work in your forex trading with this free, 14-page eBook. EWI Senior Currency Strategist Jim Martens shares actionable trading lessons and tips to help you find the best opportunities in the FX markets you trade.
This article was syndicated by Elliott Wave International and was originally published under the headline Down Dollar Down: Time for “UP”?. EWI is the world’s largest market forecasting firm. Its staff of full-time analysts led by Chartered Market Technician Robert Prechter provides 24-hour-a-day market analysis to institutional and private investors around the world.