Article By RoboForex.com
EUR USD, “Euro vs US Dollar”
The EUR/USD pair has almost reached the target of the correction. We think, today the price may fall towards 1.1600, thus forming a new consolidation range. If later the instrument breaks this consolidation range to the downside, the market may fall to reach 1.1530; if to the upside – continue the correction towards 1.1720 and then resume falling inside the downtrend.

GBP USD, “Great Britain Pound vs US Dollar”
The GBP/USD pair has reached the downside border of the consolidation channel and right is forming a new one around 1.3086; it is expected to break this level and form a downside continuation pattern. Possibly, today the price may reach 1.3000 and then start another consolidation range and continue falling with the local target at 1.2929.

USD CHF, “US Dollar vs Swiss Franc”
The USD/CHF pair is consolidating in the middle of the range. We think, today the price may form another ascending structure to reach 1.0045. After that, the instrument may test 0.9990 from above and then continue growing towards 1.0090.

USD JPY, “US Dollar vs Japanese Yen”
The USD/JPY pair is also consolidating in the middle of the range. Possibly, the price may grow to reach 114.50 and then return to 114.00. Later, in our opinion, the market may resume growing inside the uptrend with the target at 115.00 and then start another correction towards 111.24.

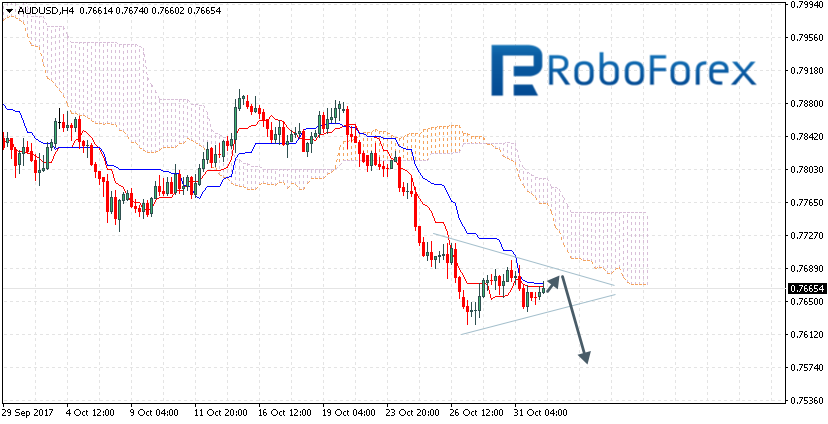
AUD USD, “Australian Dollar vs US Dollar”
The AUD/USD pair has fallen towards 0.7680; it is still being corrected. Possibly, today the price may grow to reach 0.7735. After that, the instrument may move downwards with the target at 0.7615.

USD RUB, “US Dollar vs Russian Ruble”
The USD/RUB pair is still consolidating around 58.10. We think, today the price may fall towards the downside border of the range, break it, and then reach 57.10. And that’s just a half of the descending wave. The local target is at 56.60.

XAU USD, “Gold vs US Dollar”
Gold has reached the target of the correction and right now is falling towards 1274. Possibly, today the price may continue consolidating. If later the instrument breaks this consolidation channel to the downside, the market may continue falling to reach 1250; if to the upside – continue the correction towards 1290 and then resume falling to reach 1250.

BRENT
Brent is consolidating in the center of the range. If later the instrument breaks this range to the upside, the market may grow to reach 62.50; if to the downside – continue the correction with the target at 58.25.

RoboForex Analytical Department
Article By RoboForex.com
Attention!
Forecasts presented in this section only reflect the author’s private opinion and should not be considered as guidance for trading. RoboForex LP bears no responsibility for trading results based on trading recommendations described in these analytical reviews.