The EUR/USD pair is consolidating near the lows. We think, today the price may reach 1.1896 and complete this wave. Later, in our opinion, the market may start the third descending wave to break the low of the first one. The predicted target is at 1.1762.
GBP USD, “Great Britain Pound vs US Dollar”
The GBP/USD pair has formed a continuation pattern at 1.3371; right now, it is extending the third wave towards 1.3523. After that, the instrument may resume falling to reach 1.3295.
USD CHF, “US Dollar vs Swiss Franc”
The USD/CHF pair is growing towards 0.9880. Later, in our opinion, the market may fall to reach 0.9820 and then resume growing with the local target at 0.9920.
USD JPY, “US Dollar vs Japanese Yen”
The USD/JPY pair has broken 111.80 upwards and right now is still growing towards 112.58. After that, the instrument may fall to reach 111.70 and then start another consolidation range. If later the price breaks this range to the downside, the market may fall towards 110.50; if to the upside – grow with the target at 113.56.
AUD USD, “Australian Dollar vs US Dollar”
The AUD/USD pair has reached the target of another descending wave and right now is being corrected to the upside with the target at 0.7601. Later, in our opinion, the market may resume moving downwards to reach the local target at 0.7496.
USD RUB, “US Dollar vs Russian Ruble”
The USD/RUB pair is still consolidating below 58.58. According to the main scenario, the price may trade to the downside and reach the local target at 57.45. After that, the instrument may grow to return to 58.548 and then start another decline towards 56.55.
XAU USD, “Gold vs US Dollar”
Gold has broken 1287 downwards. Possibly, the price may start another descending structure towards 1276 and then resume growing to reach 1287.
BRENT
Brent is moving upwards. Possibly, today the price may reach 64.00 and then start another decline towards 62.60. Later, in our opinion, the market may resume growing with the target at 66.00.
Attention! Forecasts presented in this section only reflect the author’s private opinion and should not be considered as guidance for trading. RoboForex LP bears no responsibility for trading results based on trading recommendations described in these analytical reviews.
The AUD/USD pair is trading at 0.7589; the instrument is still moving below Ichimoku Cloud, which means that it may continue falling. We should expect the price to test the broken border of the cloud at 0.7595 and then continue moving downwards to reach 0.7520. However, the scenario that Implies further decline may be cancelled if the price breaks the upside border of the cloud and fixes below 0.7630. In this case, the pair may continue growing towards 0.7760.
NZD USD, “New Zealand Dollar vs US Dollar”
The NZD/USD pair is trading at 0.6846; the instrument is still moving below Ichimoku Cloud, which means that it may continue falling. We should expect the price to test the broken border of the cloud at 0.6850 and then continue moving downwards to reach 0.6770. However, the scenario that implies further decline may be cancelled if the price breaks the upside border of the cloud and fixes above 0.6920. In this case, the pair may continue growing towards 0.7020.
USD CAD, “US Dollar vs Canadian Dollar”
The USD/CAD pair is trading at 1.2862; the instrument is still moving above Ichimoku Cloud, which means that it may continue growing. We should expect the price to test Tenkan-Sen and Kijun-Sen at 1.2830 and then continue moving upwards to reach 1.2940. However, the scenario that implies further growth may be cancelled if the price breaks the downside border of the cloud and fixes below 1.2760. In this case, the pair may continue falling towards 1.2650.
Attention! Forecasts presented in this section only reflect the author’s private opinion and should not be considered as guidance for trading. RoboForex LP bears no responsibility for trading results based on trading recommendations described in these analytical reviews.
On Wednesday the 29th of November, trading on the euro/dollar pair closed slightly up. Buyers recovered all their intraday losses during the American session after the British pound made some gains. The pound was boosted by the news that the UK had reached a deal with Brussels “in principle” regarding the EU divorce bill.
The euro’s rise was held up by a rise in US bond yields as well as increased caution from traders with the crucial Senate vote on tax reform approaching.
In yesterday’s speech, Fed Chair Janet Yellen said that the strengthening of the US economy would ensure the need for continued interest rate hikes. This speech along with the publication of US data strengthened the dollar, but it had erased all its gains by the end of the day.
16:30 USA: personal spending (Oct), personal income (Oct), core personal consumption expenditures – price index (Oct), initial jobless claims (24 Nov).
17:45 USA: Chicago PMI (Nov).
Fig 1. EURUSD rate on the hourly. Source: TradingView
Yesterday’s forecast came off; the target was reached. Sellers made several attempts to break down the trend line, but none were successful.
The euro dropped to 1.1817 due to a decline on the euro/pound cross and a surge for the US dollar. The price didn’t manage to go any lower. The price then rebounded upwards during the Asian session to reach the 45th degree at 1.1871. Since the trend line from 1.1961 has been broken through, today I’m expecting the rate to rise to 1.1895.
The price is currently sitting on the LB balance line (sma – 55). The market is in equilibrium and is ready for a price divergence of +/- 0.38%. I don’t think the price will make it to 1.1899 (67 degrees) given that the stochastic oscillator is currently reversing downwards. If the price drops to 1.1845, it won’t have enough time to return to the 67th degree.
If sellers break through the TR2 trend line during their attack, the growth described above will not come to pass. Under the current pricing model, I can’t see the price declining any further should it break down the TR2 line. I think that in such a case we can expect to see a complex formation taking shape.
A determined James Stafford of OilPrice.com just busted wide open an oil industry information cartel that has existed for decades.
Most investors look at WTI and Brent prices at Bloomberg or CME Futures, and figure the oil price is in the public domain. You would be about 2% correct, because there are hundreds of different grades of oil, and hubs where it is bought and sold. And they all have different prices.
Since the age of oil began until a few months ago, most real time oil prices were jealously guarded by marketers, who used it to their advantage in the daily multi-billion dollar physical oil trade.
But I’m going to tell you the story of how Stafford and his small team made 18 months of calls, cajoling and ultimately paying for an amazing service you now get FOR FREE. It’s a true David vs. Goliath story. And just like in the Bible, the little guy won.
What they have assembled to date is remarkable, and free. You can access it through the link below:
This is an incredible and unprecedented collection of information available for the public.
Stafford says that the feedback he has received has been exceptional. With no marketing effort the oil price page is already receiving 40,000 visits daily.
It was an 18 month quest to democratize the world of oil pricing and bust the information cartel that has existed for decades.
A Simple Question – With No Easy Answer
Stafford’s quest started well over a year ago when he received a phone call from a reporter working for the Wall Street Journal. The journalist wanted help finding a simple piece of information.
He was writing an article about the African oil industry and simply wanted to know the current price for Bonny Light crude oil (the main benchmark price for Nigerian crude).
Now remember, this is a Wall Street Journal writer with access to an incredible network of contacts and research. This was not a casual retail investor sitting at home with pedestrian internet search skills and no industry contacts. You would expect that finding the current price for Africa’s main brand of crude for a Wall Street Journal writer would be a simple internet search or phone call away.
You would be wrong.
The Wall Street Journal writer not only couldn’t find the current price for Bonny Light but the best he could do was get a price from six months ago!
We were passing information around faster with the Pony Express 150 years ago.
The trouble that the Wall Street Journal writer was having surprised Stafford, who then realized that he too couldn’t get access to the current price of Bonny Light.
As the founder of the very popular website OilPrice.com, not being able to find a price for a globally important type of crude did not sit well with him.
So he put his head down and got to work.
Information Held Hostage – The Ransom…
$30,000 Per Year
The internet has made information available to everyone…..with ease.
Nowhere is that more true than in the investment world. I can tap into any SEC filing of any company within seconds. It wasn’t that long ago that I would have had to request that information by telephone and wait to receive it by mail.
The internet has sent the encyclopedia the way of the dodo bird, ruined many a local newspaper and made the world a much smaller place.
It has also levelled the playing field in many cases, especially when it comes to investing.
When it comes to obtaining global oil price information however the internet has done nothing. We are still completely in the dark.
Your first inclination may be to disagree with me. You know that you can tap into the current (or historic) price of West Texas Intermediate or Brent crude any time you want.
What you are missing is that those are just two oil benchmarks out of hundreds — thousands likely. Generally people believe that oil is a single completely indistinguishable, homogenous substance. A barrel of oil is a barrel of oil is a barrel of oil.
That is not the case.
In its natural unrefined state crude oil differs in consistency and density from very thin, volatile and light oil to very thick, almost solid heavy oil. It also differs in color with all kinds of shades from pitch black to a light golden yellow.
Each place where oil is found has very unique properties when it comes to volatility, viscosity and toxicity.
In Canada alone there are north of seventy different oil blends. You read that correctly….I said seventy!
Knowing the exact blend is essential for the refinery process which has to account for the exact chemical and viscosity of the oil being processed.
Stafford knew that if couldn’t find pricing for a major type of crude like Bonny light that there were countless others that would be even hard to get.
His quest quickly led him to a discovery. The only place to obtain a fairly complete set of current oil price data required a subscription—of $30,000 to $50,000 per year.
These sources knew they had the upper hand over people who had to have that data, and they exploited it.
Even that expensive cost the oil price info wasn’t complete. It involved receiving only an end of day price for the various source of crudes – nothing real time.
This just motivated Stafford more. His focus now was on finding a way to open up the world of oil prices, to make the information available to everyone.
But it wasn’t easy, and it certainly wasn’t cheap.
It took Stafford and his team almost 18 months of making phone calls, getting rejected, making more phone calls – over and over again.
When he found the right people they were often reluctant to release the information for fear of ruffling the feathers of senior management.
Stafford ultimately succeeded simply by knocking on enough doors across the globe to find enough oil industry people who were sick and tired of this oil price information being held hostage. Like Stafford these were people who felt that there should be transparency with respect to this information Stafford will be out of pocket by a couple of hundred thousand dollars per year in order to secure the continued contractual commitments to supply this data.
The Result – Global Oil Price Information
For Everyone (Finally)
Stafford and his team aren’t done. They are still making calls, sending e-mails and adding different blends to their pricing list. There are a few blends that he knows they are still missing but are incredible hard to get ahold of. Certain OPEC blends in particular have been hard to pin down.
Since the 1980s, economic success in Asia has often relied on foreign investment, at least initially. Last week, President Duterte took a decisive step toward that direction. Why has the change taken so long? And why is the devil in the details?
In the third quarter, the Philippine economy grew 6.9%, which made it Asia’s second fastest-growing economy after Vietnam. But unlike Vietnam, which has reaped many benefits of foreign direct investment (FDI), the Philippines has not.
Again and again, former President Benigno Aquino III acknowledged the need to boost FDI during his reign. Yet, the main challenge to attract FDI has been the 60/40 foreign ownership law, which Aquino neglected to confront between 2010 and 2016.
On November 21 President Duterte ordered the National Economic Development Authority (NEDA) to take “immediate steps” to lift or ease restrictions on foreign direct investment (FDI) in the Philippines to foster economic growth.
With this directive, the foreign investment negative list is expected to be cut by half. The goal is to “raise the Philippines’ competitiveness, and to foster higher economic growth in the Association of Southeast Asian Nations (ASEAN) region and beyond.”
As I have argued for years – on the basis of my work in competitiveness, innovation and FDI in several continents – a change is desperately needed in the Philippines. And it is about three decades late.
Falling behind
While FDI stock illustrates the size of foreign investment historically, FDI flows exemplify the size of recent investments. In the years of booming globalization, FDi stock as percentage of GDP increased slowly in the Philippines, but more than doubled in Indonesia and almost quadrupled in Thailand – until global FDI plunged during the global financial crisis in 2008.
True, FDI flows in the Philippines more than doubled to $5.7 billion in 2013-14, but only to plunge to $4.9 billion in 2015 toward the end of the Aquino era. These flows should be set in the historical context: In the early 2010s – when Aquino promised to attract far more investment to the Philippines – FDI as a percentage of GDP actually declined to 12.4%. This figure was only half of that in Indonesia, barely a fourth of its counterpart in Thailand and a fifth of the regional average.
During the past decade, Singapore has remained Southeast Asia’s leader in inward FDI flows, which peaked at $74 billion in 2014.
More recently, the FDI performance of both Indonesia and Thailand has eroded significantly. In turn, the weaker FDI players – Myanmar, Cambodia, Laos and Brunei – continue to generate about $1 billion to $2 billion annually.
Consequently, Malaysia, Vietnam and the Philippines are now competing FDI flows in the same category. In the early 2010s, Malaysia was the leader with some $12 billion in FDI flows. Currently, Vietnam has the mantle with almost $13 billion, but – in the Duterte era – FDI flows to the Philippines grew to almost $8 billion last year and there is potential for far more (Figure 1).
Figure 1Inward FDI Flows, 2005-2016
Source: Data from UNCTAD
In historical view, the picture is worse because, unlike its more successful ASEAN peers, the Philippines has failed to benefit from inward FDI for decades.
In the 1990s, FDI stock as percentage of the GDP was more than 30% in Malaysia, close to 28% in Vietnam but only 8% in the Philippines. By 2016, the ratio had soared to 57% in Vietnam, while climbing to 41% in Malaysia. In the Philippines, it was 20% – while remaining stagnant through much of the Aquino era (Figure 2).
Figure 2Inward FDI Stock as Percentage of GDP, 1995-2016
Source: Data from UNCTAD
The good news is that the change in FDI flows has come with the Duterte era. The bad news is that it has been preceded by three decades of missed opportunities.
But how should the Philippines attract FDI?
Using FDI to upgrade competitiveness
The bottom line is that FDI flows should enhance Philippine competitiveness over time. Otherwise, foreign investment may benefit foreign companies and their investors – but not Philippine living standards.
In the Global Competitiveness Index, the Philippines is today ranked 56th, right after Vietnam. In the Corruption Perception Index, the country (101st) is ahead of Vietnam (113th).
But here’s the real challenge: Despite impressive growth performance, the Philippines (113th) remains far behind Vietnam (68th) in the Ease of Doing Business rankings, along with Malawi, Swaziland, and Palestine. That’s unconscionable. The Philippines needs substantial structural reforms to unleash entrepreneurship.
But how should the Duterte government use FDI to upgrade competitiveness?
First of all, the objective should not be to attract investors with subsidized input costs, but with higher productivity. For instance, subsidizing electricity rates may offer private gains for investors, but improving the efficiency and quality of the electricity grid would support the productivity of the entire business environment.
Second, the goal should not be to improve the quality of the location in ways that benefit just investors, but multiple companies and industries. For instance, tariff exemptions generate market distortions, whereas improved customs procedures enhance national competitiveness.
Third, it is vital to develop “sticky” incentives that are tied to the location. Corporate tax breaks boosts the “race to the bottom,”’ whereas general improvements in the business environment contribute to the country’s attractiveness.
Fourth, focus should be on sustained investment rather than transient one-time deals. If incentives are tied to the total size of the investment, they will be more beneficial to the country (and to the investors). Indeed, the government’s “Build, Build, Build” infrastructure plan is one vital instrument in this regard. Similarly, incentives that encourage profitability and motivate investors to upgrade activities in the country contribute to more sustained FDI.
Indeed, boosting FDI flows should be linked with efforts to enhance innovation in strategic clusters that will be vital in the future as the Philippines competitiveness is enhanced and upgraded.
The magnitude of challenges
Nevertheless, increased foreign investment is no panacea, as labor and nationalist leaders often argue. If FDI flows rise at the cost of the country’s long-term productivity and economic development, nation’s sovereignty will be penalized. Furthermore, without appropriate efforts at the long-term “indigenization” of foreign investment, FDI benefits are likely to prove transient.
In much of emerging Asia, including China, national leaders did not opt for the FDI as a way to enhance productivity because it was the best option, but because alternatives were worse.
Second, the countries that have truly benefited from FDI are ones that have excelled in “learning by doing.” Initially, foreign multinationals arrived with their own eco-systems; over time, foreign suppliers were replaced by cost-effective indigenous contractors.
Third, as China’s success has demonstrated, assembly manufacturing, coupled with unleashed entrepreneurship, can make a great difference in economic development because it opens the benefits of industrialization to many.
Even currently favorable “demographic sweet spots” will only prove tomorrow’s development traps unless jobs are available, under-employment is marginal and the best and the most industrious are not being exported to other countries.
Moreover, significant FDI flows are necessary but not enough in countries in which manufacturing lacks adequate presence and in which landed elites are reluctant to renounce historical privileges – even in the name of their children or grandchildren.
Undoubtedly, the Duterte government is now paving way to recapture some of the FDI flows of the missed decades. Yet, the magnitude of the challenges should be taken seriously.
What the Philippines needs is inclusive foreign investment, which requires a long-term focus on economic development.
About the Author:
Dr Dan Steinbock is the founder of Difference Group and has served as research director at the India, China and America Institute (USA) and visiting fellow at the Shanghai Institutes for International Studies (China) and the EU Center (Singapore). For more, see https://www.differencegroup.net/
The original commentary was published by The Manila Times on November 27, 2017
As we can see at the H4 chart, the EUR/USD pair has finished another correction from the resistance level and formed Inverted Hammer pattern. The pattern may indicate that the correction completed and the price may resume moving upwards.
USD JPY, “US Dollar vs. Japanese Yen”
As we can see at the H4 chart, after finishing a slight pullback, the USD/JPY pair has reached the resistance level and formed Hanging Man pattern. The pattern indicates that the pullback is over and the instrument may continue falling.
Attention! Forecasts presented in this section only reflect the author’s private opinion and should not be considered as guidance for trading. RoboForex LP bears no responsibility for trading results based on trading recommendations described in these analytical reviews.
The EUR/USD pair has completed the first descending wave. We think, today the price may start another correction towards 1.1896 and then resume falling to break the low of the first wave. Later, in our opinion, the market may continue falling inside the downtrend with the first target at 1.1703.
GBP USD, “Great Britain Pound vs US Dollar”
The GBP/USD pair has reached 1.3222 and then formed another ascending structure to break the high. Possibly, the price may reach 1.3411 during the correction. After that, the instrument may fall towards 1.3222.
USD CHF, “US Dollar vs Swiss Franc”
The USD/CHF pair has broken its consolidation channel upwards. We think, the price may grow to reach 0.9880 and then start another correction towards 0.9820. Later, in our opinion, the market may continue growing with the target at 0.9920.
USD JPY, “US Dollar vs Japanese Yen”
The USD/JPY pair has reached the upside border of the consolidation channel. Possibly, today the price may fall towards 111.33 and then resume growing to break the upside border. The target is at 112.58.
AUD USD, “Australian Dollar vs US Dollar”
The AUD/USD pair has broken the consolidation rage downwards and right now is still falling. The downside target is at 0.7504.
USD RUB, “US Dollar vs Russian Ruble”
The USD/RUB pair has failed to continue falling and right now is still consolidating below 58.28. We think, today the price may trade to the downside and reach 57.90. The target is at 57.47.
XAU USD, “Gold vs US Dollar”
Gold is still consolidating at the top. Possibly, today the price may reach 1299.40. After that, the instrument may form another descending structure towards 1287.00.
BRENT
Brent is still consolidating around 63.20. We think, today the price may expand it towards 62.72. Later, in our opinion, the market may form another ascending structure with the local target at 64.85.
Attention! Forecasts presented in this section only reflect the author’s private opinion and should not be considered as guidance for trading. RoboForex LP bears no responsibility for trading results based on trading recommendations described in these analytical reviews.
“Sometimes a [price] pattern will clear up on a particular day and you must act…”
By Elliott Wave International
FREE Online Tutorial from Elliott Wave International
If you are prepared to take the next step in educating yourself about the basics of the Wave Principle — access the FREE Online Tutorial from Elliott Wave International.
The Elliott Wave Basic Tutorial is a 10-lesson comprehensive online course with the same content you’d receive in a formal training class — but you can learn at your own pace and review the material as many times as you like!
This article was syndicated by Elliott Wave International and was originally published under the headline How to Forecast the Stock Market… from a Desert Island. EWI is the world’s largest market forecasting firm. Its staff of full-time analysts led by Chartered Market Technician Robert Prechter provides 24-hour-a-day market analysis to institutional and private investors around the world.
Only a decade ago, Chinese companies accounted for barely 1 percent of the world’s largest companies and multinationals. Today, their share has grown by more than tenfold.
After mid-November, Alibaba again won the highest ecommerce sales day in history on China’s Singles’ Day beating last year’s record by almost 40 percent – hitting some $25.4 billion.
In the United States, the 2016 combined Black Friday and Cyber Monday sales amounted to $6.5 billion, while Amazon’s 2017 Prime Day sales rose to $600 million to $1 billion range. Even combined, all of these revenues account for less than one-third of Alibaba’s Singles’ Day sales.
In one decade, Chinese companies have captured a significant chunk of global competition, thanks to Chinese infrastructure development, savings, rising middle-class – and increasingly global sales.
Corporate behemoths in history
The British multinationals were at the peak of their power in 1914, when they controlled half of the world’s stock of outward foreign direct investment (FDI).
After World War II, US multinationals were positioned to take advantage of post-war reconstruction, transfer of new technologies, and leverage of management capabilities. Their power peaked in the late 1960s, when they dominated half of the world FDI. Coming from a large and integrated economy, the rise of U.S. multinationals – from General Electric and Procter & Gamble to Intel – was often driven by internationalization, based on technological and managerial innovations.
After postwar reconstruction, European multinationals resurfaced. Coming from a continent of diverse economies, their expansion was driven by responsive national strategies, from Unilever to Philips and Ericsson. By the 1960s, British, French and German multinationals began to challenge U.S. multinationals in some sectors.
Starting in the late 1960s,Japanese challengers began to capture increasing market share from cars to consumer electronics, across industries. They benefited from falling trade barriers, improved transport and communications, and increasingly homogeneous markets.
Coming from a unified island-nation, Japanese multinationals – from Matsushita and Toyota to Sony – excelled in global scale efficiencies. The peak of their power occurred in 1990, when they controlled about a tenth of the stock of foreign investment worldwide.
The rise of Chinese multinationals
Since the 1980s, globalization has contributed to the rise of large emerging economies. Unlike corporate giants from advanced economies, aspiring Chinese companies have had to cope with competition that is increasingly global, capital-intensive, and innovative.
From Haier and Lenovo to Huawei and Tencent – not to speak about the Chinese giants in banking and insurance, construction, utility, automotive, oil and engineering – the pioneering Chinese corporate behemoths often benefit from cost advantages that are beyond the reach of their current rivals.
Before the global crisis, advanced economies – US (16%), Europe (49%) and Japan (4%) – accounted for more than two-thirds of all outward foreign direct investment (FDI) worldwide. In contrast, China’s share was barely 1 percent.
Today, advanced economies – US (21%), EU (32%), Japan (10%) – continue to dominate almost two thirds of total outward FDI. However, the share of China has grown more than tenfold to 13 percent of the total. That’s a dramatic increase in just a decade (Figure 1)
Figure 1 Global 500, 2015
Source: Data from FT Global 500
The rise of Chinese corporate giants
The same goes for the rankings of the world’s largest companies, as measured by market value.
At the eve of the global financial crisis, advanced economies – US (16%), EU (49%) and Japan (4%) – still dominated more than two thirds of the market value of the world’s 500 leading corporations. In contrast, the share of Chinese companies was barely 1 percent.
Barely half a decade after the global crisis and the European credit crisis, advanced economies – US (21%), EU (32%), Japan (10%) – still had almost two-thirds of the total. However, the share of Chinese companies had soared more than ten-fold (11%) (Figure2).
This, however, is just the beginning. As global R&D hubs broaden in China and the role of the mainland’s multinationals spreads worldwide, Chinese companies will begin to compete for global leadership – while paving way for the rise of other corporate giants from large emerging economies.
Figure 2 Outward FDI Flows, 2016
Source: UNCTAD
About the Author:
Dr Dan Steinbock is the founder of Difference Group and has served as research director at the India, China and America Institute (USA) and visiting fellow at the Shanghai Institutes for International Studies (China) and the EU Center (Singapore). For more, see https://www.differencegroup.net/
The original commentary was published by Shanghai Daily on November 27, 2017
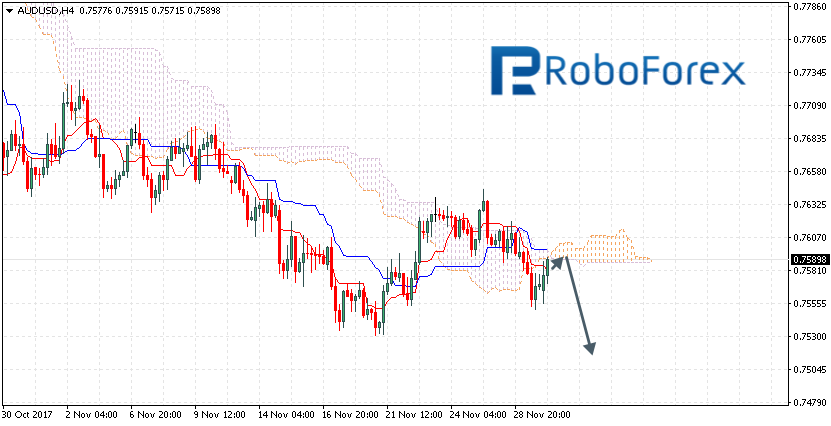
The AUD/USD pair is trading at 0.7604; the instrument is still moving inside Ichimoku Cloud, which means that it is moving sideways. We should expect the price to test the upside border of the cloud at 0.7610 and then continue moving downwards to reach 0.7530. However, the scenario that Implies further decline may be cancelled if the price breaks the upside border of the cloud and fixes below 0.7630. In this case, the pair may continue growing towards 0.7760. After breaking the downside border of the cloud and fixing below 0.7550, the price may resume falling.
NZD USD, “New Zealand Dollar vs US Dollar”
The NZD/USD pair is trading at 0.6930; the instrument is still moving above Ichimoku Cloud, which means that it may continue growing. We should expect the price to test Tenkan-Sen and Kijun-Sen at 0.6905 and then continue moving upwards to reach 0.6995. However, the scenario that implies further growth may be cancelled if the price breaks the downside border of the cloud and fixes below 0.6840. In this case, the pair may continue falling towards 0.6750.
USD CAD, “US Dollar vs Canadian Dollar”
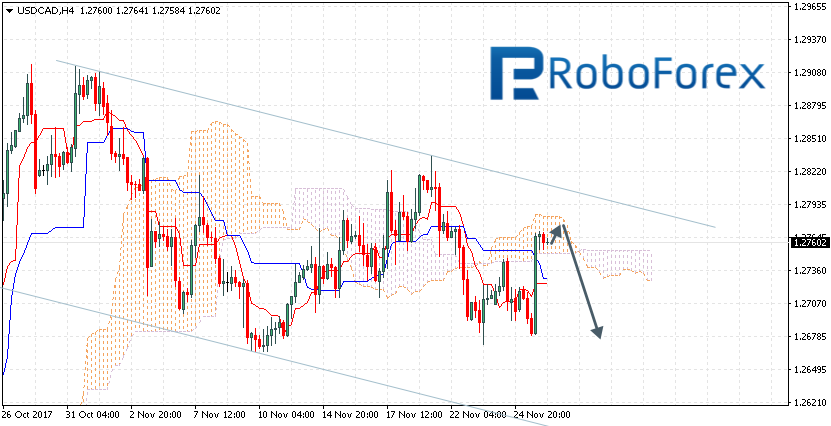
The USD/CAD pair is trading at 1.2760; the instrument is still moving inside Ichimoku Cloud, which means that it is moving sideways. We should expect the price to test the upside border of the cloud at 1.2775 and then continue moving downwards to reach 1.2680. However, the scenario that implies further decline may be cancelled if the price breaks the upside border of the cloud and fixes above 1.2805. In this case, the pair may continue growing towards 1.2905.
Attention! Forecasts presented in this section only reflect the author’s private opinion and should not be considered as guidance for trading. RoboForex LP bears no responsibility for trading results based on trading recommendations described in these analytical reviews.