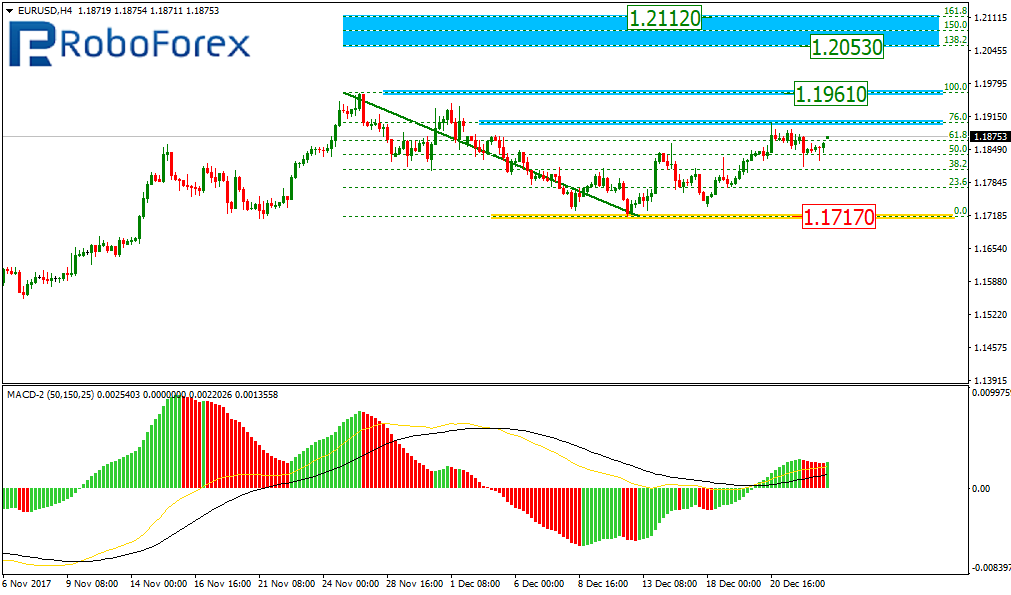
As we can see at the H4 chart, the EUR/USD pair is forming a new ascending impulse. After reaching the retracement of 76.0%, the price started moving towards the high at 1.1961. If the price breaks it, the instrument may trade towards the post-correctional extension area between the retracements of 138.2% and 161.8% at 1.2053 and 1.2112 respectively. The support level is at 1.1717.
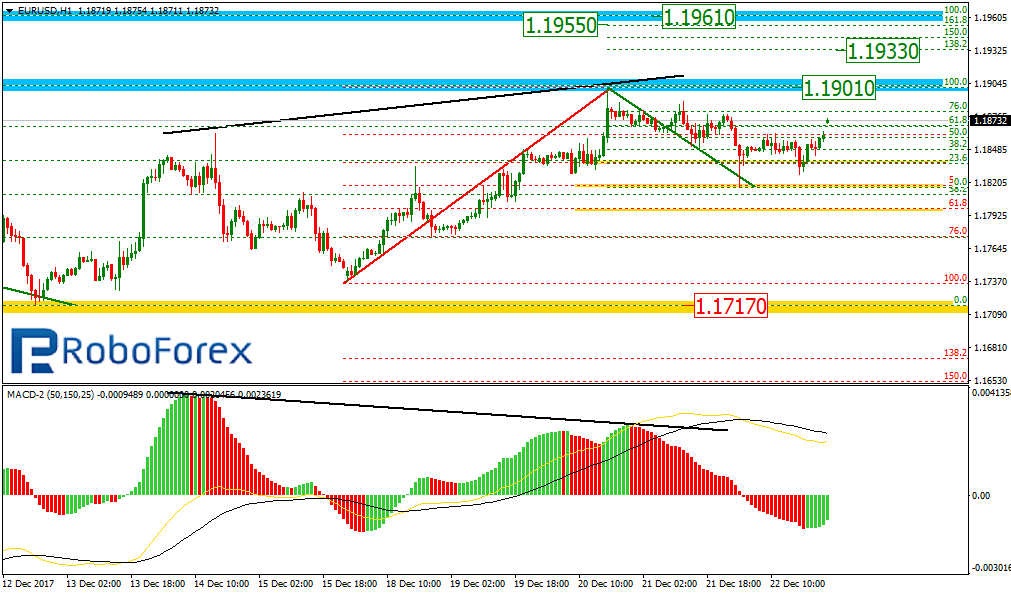
At the H1 chart, we can see the divergence, after which the EUR/UISD pair was corrected by 50.0%. right now, the price is forming a short-term ascending impulse towards 1.1901. After breaking it, the instrument may grow towards the post-correctional extension area between the retracements of 138.2% and 161.8% at 1.1933 and 1.1955 respectively.
USD JPY, “US Dollar vs. Japanese Yen”
As we can see at the H4 chart, the USD/JPY pair is about to reach the current high at 113.75. After breaking this level, the price may continue growing towards the post-correctional extension area between the retracements of 138.2% and 161.8% at 114.40 and 114.80 respectively. The support level is at 111.95.
At the H1 chart, the price is starting a new correction to the downside. The targets of the correction are the retracements of 38.2% and 50.0% at 113.13 and 112.97 respectively. The closest target for a possible ascending impulse after that is the current local high at 113.64.
Attention! Forecasts presented in this section only reflect the author’s private opinion and should not be considered as guidance for trading. RoboForex LP bears no responsibility for trading results based on trading recommendations described in these analytical reviews.
The EUR/USD pair is trading to return to 1.1870. We think, today the price may reach this level and then start another decline to break 1.1800. The local target is at 1.1750.
GBP USD, “Great Britain Pound vs US Dollar”
The GBP/USD pair is still consolidating above 1.3330. Possibly, today the price may break this range to the downside. The local target is at 1.3244.
USD CHF, “US Dollar vs Swiss Franc”
The USD/CHF pair has broken its consolidation range upwards. Possibly, the price may grow towards 0.9927 and then fall to reach 0.9857. Later, in our opinion, the market may start another growth with the target at 1.0031.
USD JPY, “US Dollar vs Japanese Yen”
The USD/JPY pair has expanded the consolidation channel and reached the first target; right now, it is forming another descending impulse towards 112.84. After that, the instrument may start another growth with the target at 113.70.
AUD USD, “Australian Dollar vs US Dollar”
The AUD/USD pair has broken the consolidation range to the upside. Possibly, the price may extend this wave towards 0.7720. Later, in our opinion, the market may trade to the downside and reach the first target at 0.7635.
USD RUB, “US Dollar vs Russian Ruble”
The USD/RUB pair has broken 58.50 downwards. Possibly, today the price may continue falling inside the downtrend to reach the local target at 58.00.
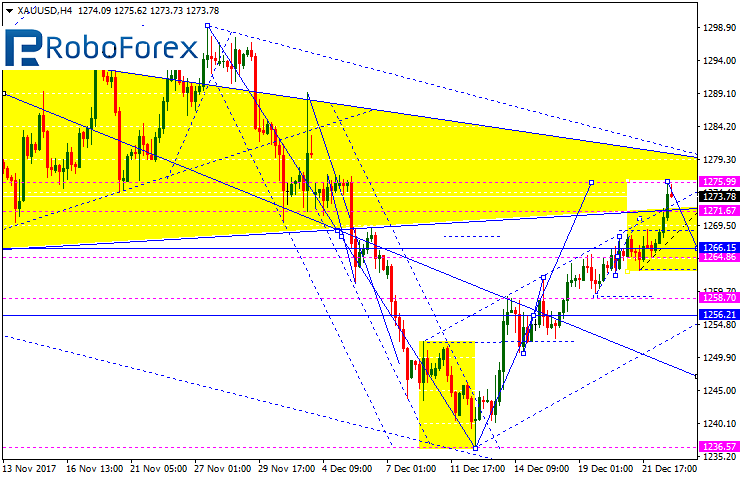
XAU USD, “Gold vs US Dollar”
Gold has finished the ascending wave. We think, today the price may start another descending structure. The first target is at 1256.
BRENT
Brent has reached the local target of another ascending structure. Possibly, today the price may be corrected towards 64.00. After that, the instrument may start another growth with the target at 66.30.
Attention! Forecasts presented in this section only reflect the author’s private opinion and should not be considered as guidance for trading. RoboForex LP bears no responsibility for trading results based on trading recommendations described in these analytical reviews.
If you are new to the world of currency trading it may look complicated, but in truth it’s not too hard to get your head around. Using the Sirix trader platform, we’ll walk you through the basics of trading forex. So sign up to the platform and join us, as we walk you through it.
First there is a trading platform that you need to get familiar with. Via the platform you will be able to analyze the price movements of different currencies and execute your trades. Most trading platforms offer a demo version, if you login what you’ll see is an exact replica of a real trading platform, but with the ability to trade fake money. Using a demo platform is a great way to learn as it will allow you to develop skills at no risk.
On the left side of the screen you’ll find a variety of the most popular currency pairs. They are called the Majors, the less traded currency pairs are called the minors. The value of a currency is a set a rate and it is determined by its comparison to another currency. So for example, if we look here at the AUD/DAC currency pair, the Australian Dollar is the base currency which if you sold to buy the equivalent amount in the Canadian Dollar you would pay 0.987c, or if you chose to sell it, you would get 0.988c.
All forex trades involve the simultaneous purchase of one currency and sale of another, but the currency pair itself can be thought of as a single unit, an instrument that you can either buy or sell.
Spread
The spread is the amount that is gained or lost in the difference between the bid and the ask price of the currency pair. So going back to our example of the AUD/CAD, let’s say you bought the forex pair at the bid price of 0.9813 and then sold it later in the day for the ask price of 0.9850. The spread is the difference between the 2 values, which in this case would have made you a nifty profit.
Some brokers charge their fees in terms of the spread, where if they operate as a market maker, they will take their profit from the spread. Other brokers will just charge a commission on the transaction instead.
Candlesticks
As soon you come on to the page you will see a chart that looks something like this. Each of those little squiggly lines is called a Japanese candlestick the purpose of which is to visually depict the value changes of the currency pair.
If you can zone in you’ll see that each of the candlesticks looks more or less like a rectangular box with sticks poking through the top and the bottom. The two ends of the box represent the open and close price of the forex pair, while the edge of the two sticks represent the highest and lowest points that were reached.
Periodicity
Like any chart, forex charts are made up of the dependent variable which is the price and the independent variable which is time. The periodicity relates to the time interval that you want to select in order to analyze the charts. If you select a 1 minute periodicity, each candlestick will reflect the price movements within that 1 minute duration of time.
Those looking to execute short term trades, should analyze trades with a relatively short periodicity of say 1 minute or 5 minutes, while those looking to execute long term trades, should select a longer periodicity of 1 week or 1 month. In that way the relevant trend can be analyzed and understood.
Leverage
Lastly, the most important thing to know about trading is leverage. Simply put, leverage is a ratio of the trader’s equity to the amount that is borrowed. The purpose of leverage is to help traders amplify the value of their positions. So that if the trader wants to leverage their position by 1:10, this means that instead of just trading $10, they are now trading with $100. While this has the potential for the win to be multiplied by $100 so too is the loss. Therefore traders need to be aware that trading with leverage is not without its risks.
About the Author:
Adinah Brown is a professional writer who has worked in a wide range of industry settings, including corporate industry, government and non-government organizations. Within many of these positions, Adinah has provided skilled marketing and advertising services and is currently the Content Manager at Leverate.
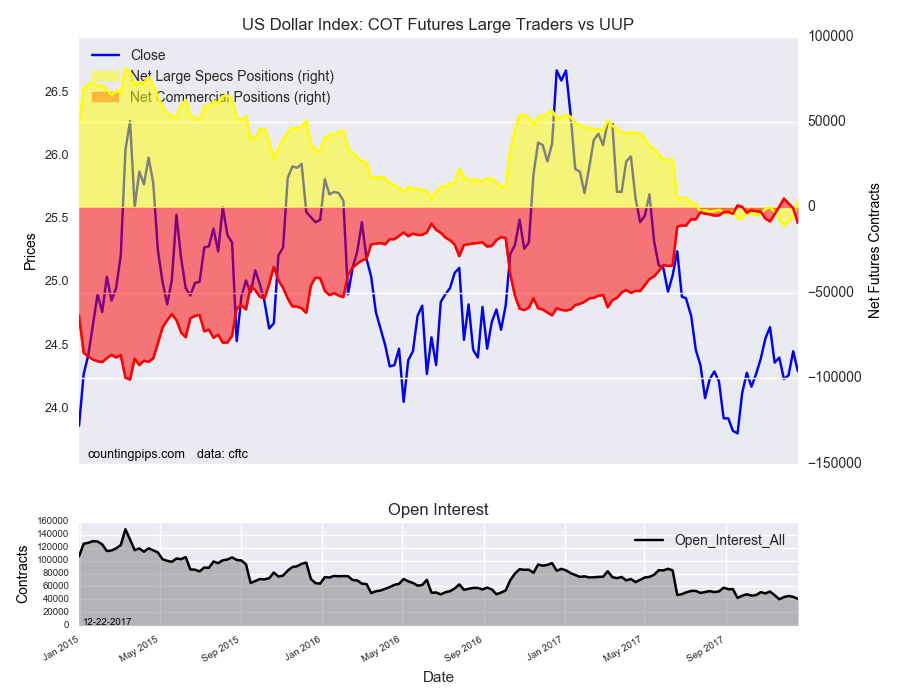
US Dollar Index Non-Commercial Speculator Positions:
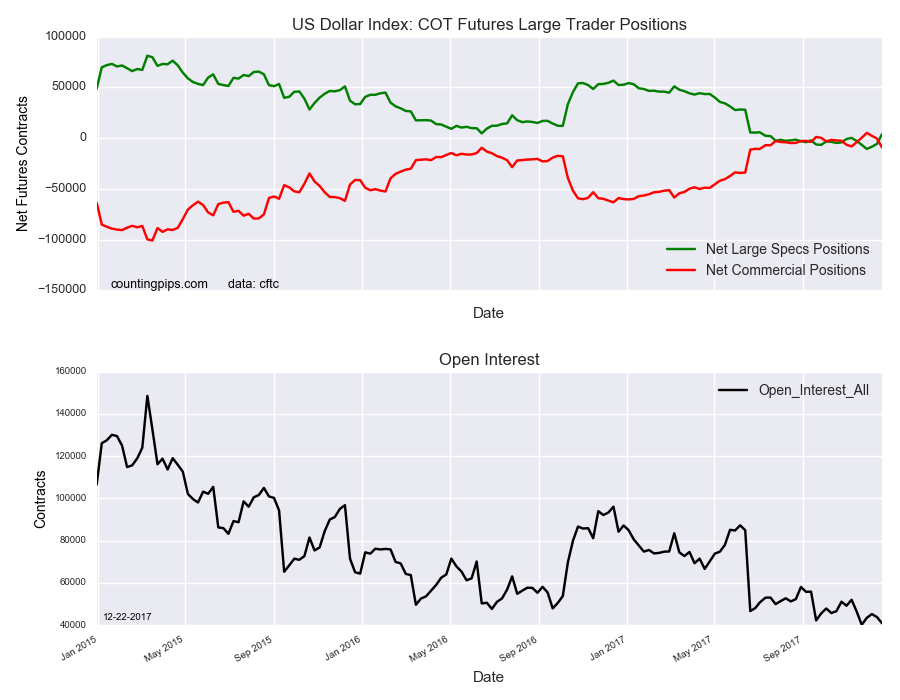
Large currency speculators boosted their net positions in the US Dollar Index futures markets this week, according to the latest Commitment of Traders (COT) data released by the Commodity Futures Trading Commission (CFTC) on Friday.
The non-commercial futures contracts of US Dollar Index futures, traded by large speculators and hedge funds, totaled a net position of 3,868 contracts in the data reported through Tuesday December 19th. This was a weekly boost of 9,553 contracts from the previous week which had a total of -5,685 net contracts.
Speculative positions rose in favor of the dollar index for a third straight week and pushed the overall net position into a bullish level for the first time since a short lived bullish standing on November 7th.
US Dollar Index Commercial Positions:
The commercial traders position, hedgers or traders engaged in buying and selling for business purposes, totaled a net position of -9,093 contracts on the week. This was a weekly fall of -8,679 contracts from the total net of -414 contracts reported the previous week.
Over the same weekly reporting time-frame, from Tuesday to Tuesday, the UUP ETF, which tracks the price of US Dollar Index, closed at approximately $24.3 which was a loss of $-0.157 from the previous close of $24.457, according to unofficial market data.
*COT Report: The COT data, released weekly to the public each Friday, is updated through the most recent Tuesday (data is 3 days old) and shows a quick view of how large speculators or non-commercials (for-profit traders) as well as the commercial traders (hedgers & traders for business purposes) were positioned in the futures markets. The CFTC categorizes trader positions according to commercial hedgers (traders who use futures contracts for hedging as part of the business), non-commercials (large traders who speculate to realize trading profits) and nonreportable traders (usually small traders/speculators). Find CFTC criteria here: (http://www.cftc.gov/MarketReports/CommitmentsofTraders/ExplanatoryNotes/index.htm).
US Dollar net speculator positions leveled at $-2.18 billion as of Tuesday
The latest data for the weekly Commitment of Traders (COT) report, released by the Commodity Futures Trading Commission (CFTC) on Friday, showed that large traders and currency speculators cut back on their bearish bets for the US dollar this week. See full article
The non-commercial contracts of WTI crude futures totaled a net position of 601,839 contracts, according to data from this week. This was a slide of -12,658 contracts from the previous weekly total. See full article
The large speculator contracts of gold futures totaled a net position of 113,795 contracts. This was a weekly advance of 6,727 contracts from the previous week. See full article
The large speculator contracts of 10-year treasury note futures totaled a net position of -44,230 contracts. This was a weekly reduction of -88,971 contracts from the previous week. See full article
The large speculator contracts of S&P 500 futures totaled a net position of 1,532 contracts. This was a decrease of -3,052 contracts from the reported data of the previous week. See full article
The non-commercial contracts of silver futures totaled a net position of 2,469 contracts, according to data from this week. This was a weekly fall of -7,445 contracts from the previous totals. See full article
The large speculator contracts of copper futures totaled a net position of 42,698 contracts. This was a weekly boost of 14,944 contracts from the data of the previous week. See full article
The Commitment of Traders report data is published in raw form every Friday by the Commodity Futures Trading Commission (CFTC) and shows the futures positions of market participants as of the previous Tuesday (data is reported 3 days behind).
US Dollar net speculator positions stand at $-2.18 billion this week
The latest data for the weekly Commitment of Traders (COT) report, released by the Commodity Futures Trading Commission (CFTC) on Friday, showed that large traders and currency speculators cut back on their bearish bets for the US dollar this week.
Non-commercial large futures traders, including hedge funds and large speculators, had an overall US dollar net position totaling $-2.18 billion as of Tuesday December 19th, according to the latest data from the CFTC and dollar amount calculations by Reuters. This was a weekly rise of $5.63 billion from the $-7.81 billion total position that was registered the previous week, according to the Reuters calculation (totals of the US dollar contracts against the combined contracts of the euro, British pound, Japanese yen, Australian dollar, Canadian dollar and the Swiss franc).
The aggregate dollar position had fallen for four straight weeks before this week’s rebound. The improvement of the dollar’s position this week was the best one week gain since June 7th 2016 when the aggregate bets rose by $6.44 billion.
Weekly Speculator Contract Changes:
This week saw four substantial changes (+ or – 10,000 contracts) in the individual currency contracts for the speculator category.
The euro speculative bets, which rose by over +20,000 contracts last week to the highest position since May 15th 2007, fell sharply this week by -27,665 net contracts. This week’s pullback brought the net contract position to back below the +100,000 contract level.
The Australian dollar speculative bets dropped huge this week by over +50,000 contracts and brought the overall net position into a small short position. This is the first short level in the AUD since June 13th 2017
The Mexican peso position dropped by over -30,000 contracts this week after falling by over -10,000 last week. The overall net position remains bullish but is at the lowest level since May 2nd when net bets totaled +15,115 contracts.
The Swiss franc position rose by over -11,000 contracts and has risen for three straight weeks. The overall net position remains bearish but is at the lowest bearish level since October 24th when net bets totaled -11,597 contracts.
Overall, the major currencies that improved against the US dollar this week were the British pound sterling (9,000 weekly change in contracts), Swiss franc (11,370 contracts) and the Canadian dollar (3,941 contracts).
The currencies whose speculative bets declined this week versus the dollar were the euro (-27,665 weekly change in contracts), Japanese yen (-250 contracts), Australian dollar (-53,380 contracts), New Zealand dollar (-3,191 contracts) and the Mexican peso (-32,282 contracts).
Table of Weekly Commercial Traders and Speculators Levels & Changes:
Currency
Net Commercials
Comms Weekly Chg
Net Speculators
Specs Weekly Chg
EuroFx
-119,761
15,769
86,224
-27,665
GBP
-26,832
-8,890
20,388
9,000
JPY
136,603
-2,352
-114,373
-250
CHF
33,310
-13,592
-17,395
11,370
CAD
-55,571
-2,084
45,901
3,941
AUD
20,317
49,003
-12,660
-53,380
NZD
18,739
2,307
-16,619
-3,191
MXN
-55,007
34,710
53,894
-32,282
This latest COT data is through Tuesday and shows a quick view of how large speculators or non-commercials (for-profit traders) as well as the commercial traders (hedgers & traders for business purposes) were positioned in the futures markets. All currency positions are in direct relation to the US dollar where, for example, a bet for the euro is a bet that the euro will rise versus the dollar while a bet against the euro will be a bet that the dollar will gain versus the euro.
Weekly Charts: Large Trader Weekly Positions vs Price
EuroFX:
British Pound Sterling:
Japanese Yen:
Swiss Franc:
Canadian Dollar:
Australian Dollar:
New Zealand Dollar:
Mexican Peso:
*COT Report: The weekly commitment of traders report summarizes the total trader positions for open contracts in the futures trading markets. The CFTC categorizes trader positions according to commercial hedgers (traders who use futures contracts for hedging as part of the business), non-commercials (large traders who speculate to realize trading profits) and nonreportable traders (usually small traders/speculators). Find CFTC criteria here: (http://www.cftc.gov/MarketReports/CommitmentsofTraders/ExplanatoryNotes/index.htm).
The Commitment of Traders report is published every Friday by the Commodity Futures Trading Commission (CFTC) and shows futures positions data that was reported as of the previous Tuesday (3 days behind).
Each currency contract is a quote for that currency directly against the U.S. dollar, a net short amount of contracts means that more speculators are betting that currency to fall against the dollar and a net long position expect that currency to rise versus the dollar.
(The charts overlay the forex closing price of each Tuesday when COT trader positions are reported for each corresponding spot currency pair.) See more information and explanation on the weekly COT report from the CFTC website.
Large energy speculators cut back on their bullish net positions in the WTI Crude Oil futures markets this week, according to the latest Commitment of Traders (COT) data released by the Commodity Futures Trading Commission (CFTC) on Friday.
The non-commercial futures contracts of WTI Crude Oil futures, traded by large speculators and hedge funds, totaled a net position of 601,839 contracts in the data reported through Tuesday December 19th. This was a weekly lowering of -12,658 contracts from the previous week which had a total of 614,497 net contracts.
Speculative positions had risen to new record high bullish levels for each of the previous three weeks before this week’s decline. The overall net position remains above the +600,000 contract level for a fourth straight week.
WTI Crude Oil Commercial Positions:
The commercial traders position, hedgers or traders engaged in buying and selling for business purposes, totaled a net position of -619,991 contracts on the week. This was a weekly boost of 9,339 contracts from the total net of -629,330 contracts reported the previous week.
Over the same weekly reporting time-frame, from Tuesday to Tuesday, the USO Crude Oil ETF, which tracks the price of WTI crude oil, closed at approximately $11.51 which was an advance of $0.07 from the previous close of $11.44, according to unofficial market data.
*COT Report: The COT data, released weekly to the public each Friday, is updated through the most recent Tuesday (data is 3 days old) and shows a quick view of how large speculators or non-commercials (for-profit traders) as well as the commercial traders (hedgers & traders for business purposes) were positioned in the futures markets. The CFTC categorizes trader positions according to commercial hedgers (traders who use futures contracts for hedging as part of the business), non-commercials (large traders who speculate to realize trading profits) and nonreportable traders (usually small traders/speculators). Find CFTC criteria here: (http://www.cftc.gov/MarketReports/CommitmentsofTraders/ExplanatoryNotes/index.htm).
Large treasury speculators sharply reduced their net positions in the 10-Year Note futures markets this week, according to the latest Commitment of Traders (COT) data released by the Commodity Futures Trading Commission (CFTC) on Friday.
The non-commercial futures contracts of 10-Year Note futures, traded by large speculators and hedge funds, totaled a net position of -44,230 contracts in the data reported through Tuesday December 19th. This was a weekly lowering of -88,971 contracts from the previous week which had a total of 44,741 net contracts.
Speculative positions fell over into an overall bearish position this week for the first time since April 18th of 2017 when the net positions totaled -41,300 contracts.
10-Year Note Commercial Positions:
The commercial traders position, hedgers or traders engaged in buying and selling for business purposes, totaled a net position of 242,045 contracts on the week. This was a weekly increase of 81,114 contracts from the total net of 160,931 contracts reported the previous week.
Over the same weekly reporting time-frame, from Tuesday to Tuesday, the 7-10 Year Treasury Bond ETF (IEF) closed at approximately $105.24 which was a decrease of $-0.35 from the previous close of $105.59, according to unofficial market data.
*COT Report: The COT data, released weekly to the public each Friday, is updated through the most recent Tuesday (data is 3 days old) and shows a quick view of how large speculators or non-commercials (for-profit traders) as well as the commercial traders (hedgers & traders for business purposes) were positioned in the futures markets. The CFTC categorizes trader positions according to commercial hedgers (traders who use futures contracts for hedging as part of the business), non-commercials (large traders who speculate to realize trading profits) and nonreportable traders (usually small traders/speculators). Find CFTC criteria here: (http://www.cftc.gov/MarketReports/CommitmentsofTraders/ExplanatoryNotes/index.htm).
Large metals speculators added to their bullish net positions in the Gold futures markets this week, according to the latest Commitment of Traders (COT) data released by the Commodity Futures Trading Commission (CFTC) on Friday.
The non-commercial futures contracts of Gold futures, traded by large speculators and hedge funds, totaled a net position of 113,795 contracts in the data reported through Tuesday December 19th. This was a weekly advance of 6,727 contracts from the previous week which had a total of 107,068 net contracts.
Speculative positions had sharply dropped in each of the previous two weeks before this week’s modest rebound. The overall net position is above the +100,000 contract level but has now been remained under the +200,000 contract level for a third straight week and for seven out of the last ten weeks.
Gold Commercial Positions:
The commercial traders position, hedgers or traders engaged in buying and selling for business purposes, totaled a net position of -128,217 contracts on the week. This was a weekly shortfall of -8,754 contracts from the total net of -119,463 contracts reported the previous week.
Over the same weekly reporting time-frame, from Tuesday to Tuesday, the GLD ETF, which tracks the price of gold, closed at approximately $119.82 which was an increase of $1.67 from the previous close of $118.15, according to unofficial market data.
*COT Report: The COT data, released weekly to the public each Friday, is updated through the most recent Tuesday (data is 3 days old) and shows a quick view of how large speculators or non-commercials (for-profit traders) as well as the commercial traders (hedgers & traders for business purposes) were positioned in the futures markets. The CFTC categorizes trader positions according to commercial hedgers (traders who use futures contracts for hedging as part of the business), non-commercials (large traders who speculate to realize trading profits) and nonreportable traders (usually small traders/speculators). Find CFTC criteria here: (http://www.cftc.gov/MarketReports/CommitmentsofTraders/ExplanatoryNotes/index.htm).
Large stock market speculators cut back on their bullish net positions in the S&P500 futures markets this week, according to the latest Commitment of Traders (COT) data released by the Commodity Futures Trading Commission (CFTC) on Friday.
The non-commercial futures contracts of S&P500 futures, traded by large speculators and hedge funds, totaled a net position of 1,532 contracts in the data reported through Tuesday December 19th. This was a weekly fall of -3,052 contracts from the previous week which had a total of 4,584 net contracts.
Speculative positions had gained for the previous three weeks before this week’s turnaround. The large speculator position has now been on the bullish side for four straight weeks.
S&P500 Commercial Positions:
The commercial traders position, hedgers or traders engaged in buying and selling for business purposes, totaled a net position of -6,461 contracts on the week. This was a weekly shortfall of -10,509 contracts from the total net of 4,048 contracts reported the previous week.
Over the same weekly reporting time-frame, from Tuesday to Tuesday, the SPY ETF, which tracks the price of S&P500 Index, closed at approximately $267.17 which was a boost of $1.75 from the previous close of $265.42, according to unofficial market data.
*COT Report: The COT data, released weekly to the public each Friday, is updated through the most recent Tuesday (data is 3 days old) and shows a quick view of how large speculators or non-commercials (for-profit traders) as well as the commercial traders (hedgers & traders for business purposes) were positioned in the futures markets. The CFTC categorizes trader positions according to commercial hedgers (traders who use futures contracts for hedging as part of the business), non-commercials (large traders who speculate to realize trading profits) and nonreportable traders (usually small traders/speculators). Find CFTC criteria here: (http://www.cftc.gov/MarketReports/CommitmentsofTraders/ExplanatoryNotes/index.htm).


