Author Archive for InvestMacro – Page 438

Are These Gold Bankers Better Than Wall St?

There are a group of bankers based in three cities, not Wall St., but Toronto, Vancouver, and Denver that you probably never heard of. Surprisingly, they are gold stocks. They are royalty & streaming companies, otherwise known as the Three Kings (Franco-Nevada, Royal Gold, and Wheaton Precious Metals) are the non-media grabbing bankers in the mining sector. They collect their revenue from some of the biggest mining companies in the world: Glencore, Vale, Teck Resources, Barrick Gold, Newmont Mining, AngloGold Ashanti Limited. Yet, if you add up the staff of these 3 companies, it would be less than 100 people. At the same time, their combined revenue of almost $2 billion in 2016.  You could call them the bankers of mining.

Franco-Nevada and Royal Gold were both founded in the 1980’s. Wheaton Precious Metals (previously named Silver Wheaton) is the new entrant over the past ten years to join the club.

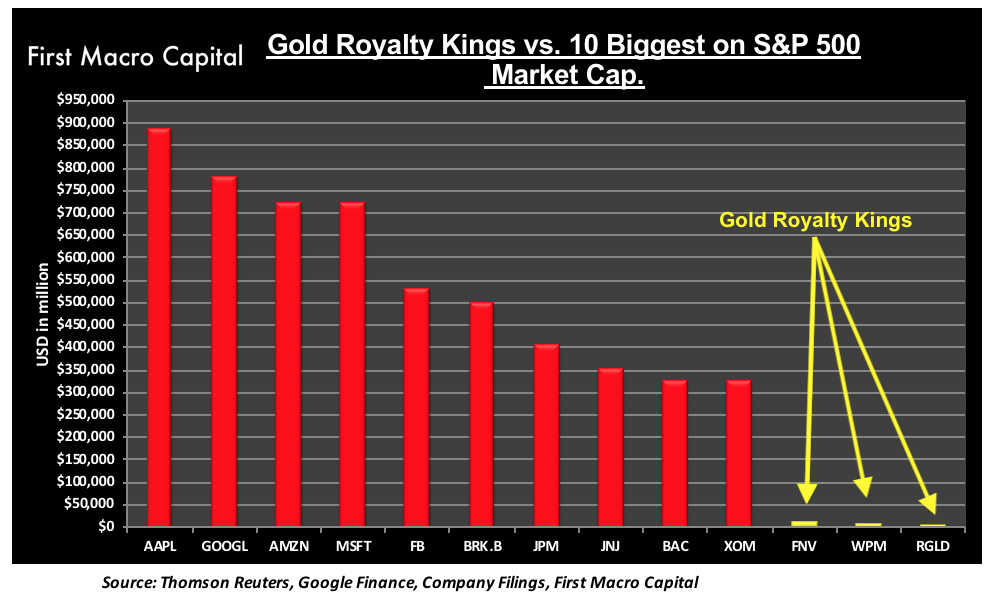
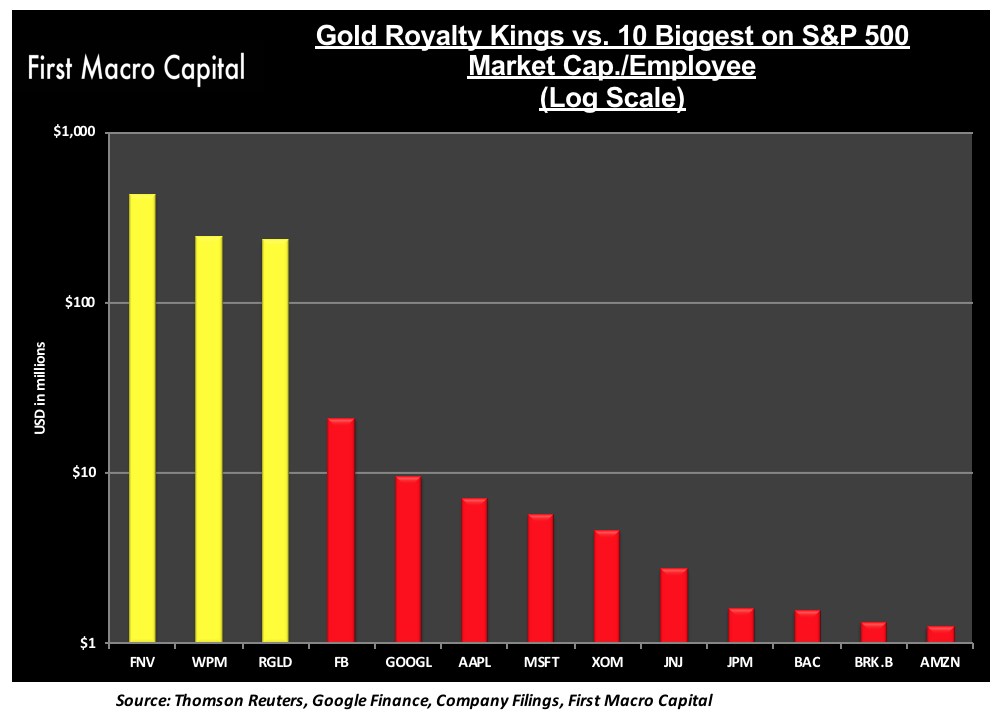
GOLD ROYALTY KINGS VS THE 10 BIGGEST ON THE S&P 500

When you look at the market cap of these three companies to the ten biggest companies on the S&P 500, they appear incredibly small.

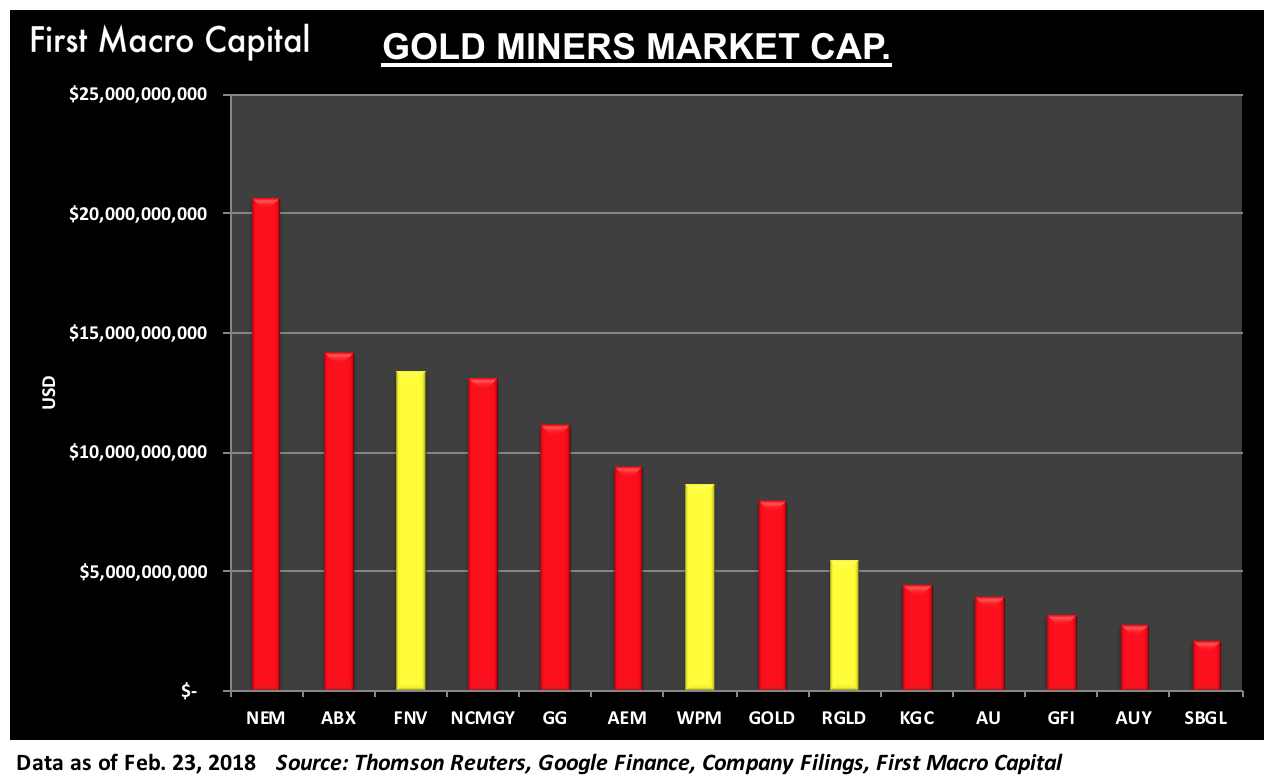
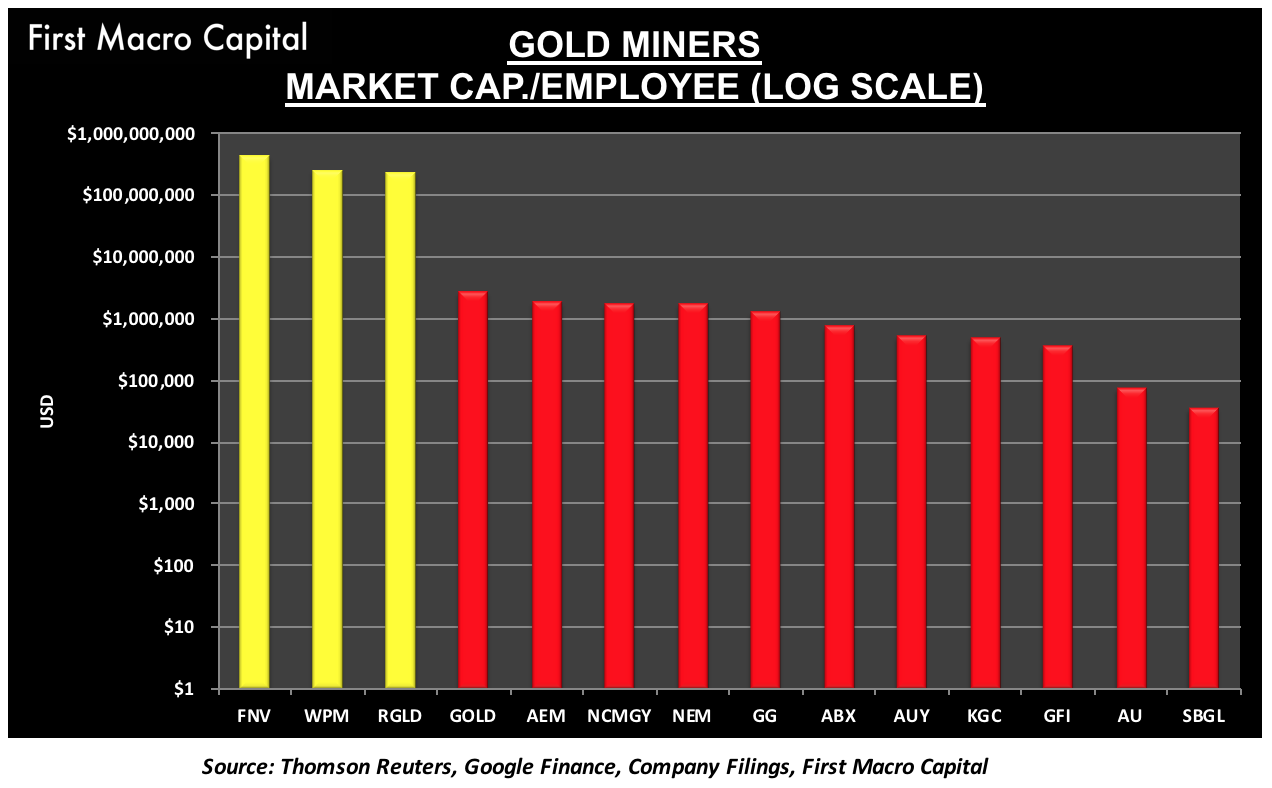
GOLD ROYALTY KINGS VS THE BIG GOLD MINING COMPANIES

In the gold mining sector, you always hear about the stalwart names of Newmont Mining, Barrick Gold, Goldcorp, Newcrest Mining, Agnico Eagle Mines. Sometimes you will hear about the three kings: Franco-Nevada, Royal Gold, or Wheaton Precious Metals. Yet, 3 of the top 10 gold-focused companies in the world are royalty and streaming companies. Much of the attention for investors is focused on the mining companies since they are the ones that develop and manage the mines to get the gold and other commodities out of the ground. The royalty and streaming companies are a critical piece in providing financing to explorers, developer, and producers to reaching their desired goals.  Mines are some of the most capital-intensive operations in the world. They need ongoing capital to build their operations. Royalty and streaming companies help fill that void when bankers or capital markets aren’t interested during the commodity bust period.

FMC - GOLD MINERS - MARKET CAP

WEALTH CREATION FROM ROYALTY COMPANIES

But when you look at the market capitalization per employee for these same companies, it starts to give you a different picture of how drastically different the business models of streaming & royalty companies are to mining companies and the biggest companies in the world. The Three Kings create millions of dollars in market cap per employee compared to the S&P 500 stalwarts and the largest gold miners. It is not even close.

FMC - MARKET CAP PER EMPLOYEE - LOG SCALE

FMC - MINERS MARKET CAP PER EMPLOYEE - LOG SCALE

REVENUE GENERATING MACHINES

The real magic of the business is displayed, when you look at the revenue generated per employee. Most people when they think of this metric, think of companies like Apple, Google, and Facebook, with the addition of ExxonMobil back in the mix because of the rise in oil prices.

FMC - ROYALTY - REVENUE PER EMPLOYEE

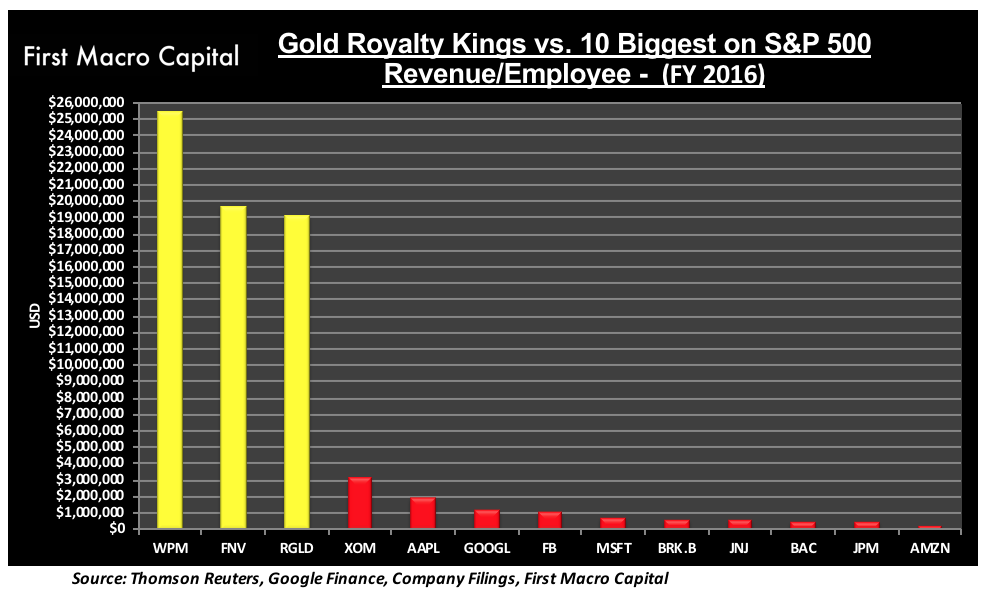
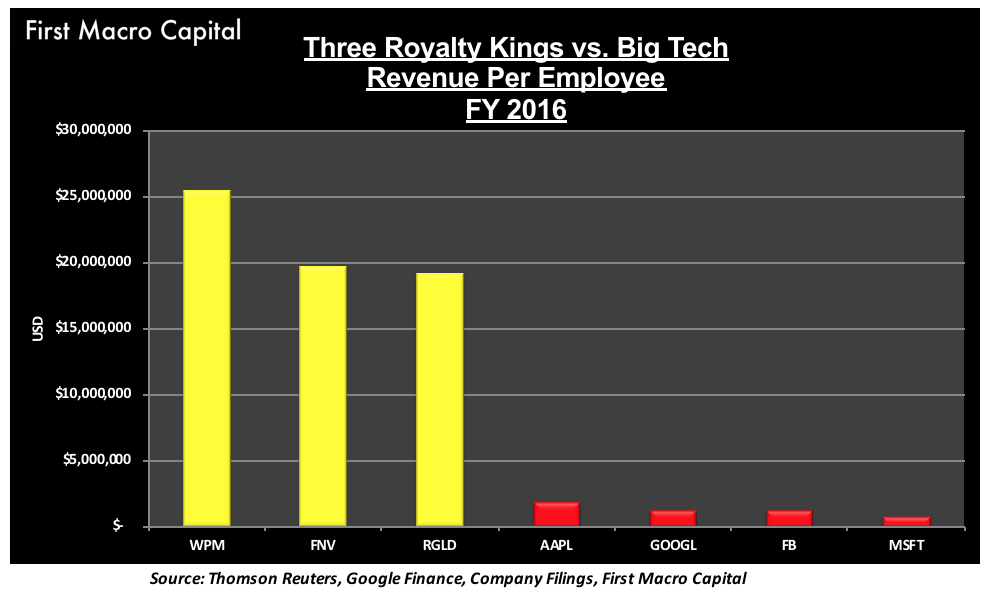
These three royalty companies generate some of the highest revenue per employee in the world, and it is by a wide margin. You can really see how scalable these royalty companies are when you compare them to the tech giants of Google, Apple, Microsoft, and Facebook.

FMC - ROYALTY KINGS VS. BIG TECH

OPTIONALITY IN THE BUSINESS

The Three Kings can add more contracts in the form of royalties and streaming contracts, without having to add hundreds of new staff to their business. Whereas a gold miner, depending on the jurisdiction where the mine is operated, may have to add 100’s, even 1000’s of staff to start a new mine and keep it in production. Both business models still have the optionality to the price of gold and the expansion of the resource at a mine.

WHAT ARE THEY KNOWN FOR? 

  • Royalty companies are long-term growth stories that growth & dividendinvestors seek out.
  • Longer-term investors, like retirees or those managing a diversified industry portfolio, tend to prefer owning mining stocks with lower volatility and more consistency in the business. This results in royalty gold stocks being easier to manage in the portfolio.

TRADING VOLUME DOES NOT EQUAL SHAREHOLDER WEALTH

When looking at the volume of shares traded by the gold miners vs. streamers, most traders and portfolio managers are trading the miners. It could be for a number of reasons:

  1. Lots of liquidity, so you can do algorithmic trading.
  2. The gold mining stocks tend to have a higher daily average-true range (ATR), because they are more sensitive to the price changes in gold or the main commodities the gold stock is exposed to. The ATR is the difference in the high and low price of the day from the previous days close. Basically, the ATR shows you the daily volatility of the share price from the open. The higher the daily volatility the more traders love trading in the stocks.
  3. When you look at the number of shares traded by Barrick Gold on the NYSE, Barrick average of 13.571 million shares, this is more than 16X the number of shares traded of Franco-Nevada at 0.594 million shares traded. This doesn’t tell us the whole picture [2]. What matters more is the total value of shares traded each day. This gives investors a sense of the amount of money moving around between investors. Franco-Nevada trades about $46 million worth of shares each day, whereas Barrick Gold trades about $138 million every day, which Barrick Gold trades about 3X more than Franco-Nevada in dollar terms.

Gold Mines - Trading Volume

HOW DO THESE ROYALTY KINGS MAKE THEIR MONEY?

These royalty companies earn their revenue in two primary ways, a royalty or a streaming contract. They obtain these by providing money to mining companies that need the capital for current mining operations or the development of a new mine, even for exploration of a property. In exchange for the money, the royalty & streaming company receives a simple “percentage of the value of the future production from the property, typically 1% to 5%. Often these are stated as a percentage of the net value the operating company receives for its concentrated product when it is processed at a smelter, hence the term “net smelter return royalty” or “NSR royalty” [2]. In other words, they let the miner operate the mine, and they collect checks as a percentage of what is produced. There are two less common royalties that are based on the profits of a mine or a fixed-rate royalty. No additional capital is exchanged to maintain the royalty. Up front work for years of rewards.

WHAT IS THE STREAM? 

Streams are metal purchase agreements that provide, in exchange for an upfront payment, the right to purchase all or a portion of the gold, silver or other products from a mine at a preset price.”[3] The royalty & streaming company is required to make ongoing cash payments at the agreed upon price, which typically ranges from 60-80% below the spot price of the commodity when the contract is signed. The streams last for a specified number of years, where the royalty will last in perpetuity or until it gets bought out (if there is an option), or government seizes the claim.

DO ROYALTY STOCKS HAVE BUFFETT STYLE MOATS?

For the Three Kings, as they continue to add more contracts, whether it be a stream or a royalty, once the contracts start to generate cash flow, it reduces the volatility of the total revenue because each new contract generating revenue, reduces the percentage the older contract has on the total revenue. Think of each new cash-flowing contract as a new ring, adding to the initial ring, creates one moat after another to protect the business. This reduced volatility is the reason why non-mining portfolio managers prefer holding these stocks, because their clients do not like volatility, but the businesses continue to grow with the new contracts added every year. They are great compounders of wealth.  What if gold stayed the same for a year? As long as they add new royalties and streams for projects that eventually come online, we would expect the revenue to grow, and the dividend checks to continue to grow as one.

fmc-rings_moat

SHOULD THE ROYALTY & STREAMERS ADD DEVELOPMENT STAFF?

When you look at how similar the revenue per employee is between the Three Kings, yet the markets caps between the Three Kings are between $5 billion and $15 billion. Shareholders could start asking themselves when evaluating the royalty & streaming companies, “how many additional staff can these royalty companies continue to add to continue to grow revenue?” Since 2015, we have seen many new entrants into the royalty market during this time to seize on the opportunity that the Three Kings have left to these new entrants. Adding a couple of staff would allow them to capitalize on this opportunity and sign mid-tier transactions.

Yes, these companies are all tied to the price of gold, but revenue is a function of 1) Gold price and 2) Attributable gold equivalent ounces. If these companies assume they don’t know what the price of gold will be (which is a reasonable expectation), and only signing new royalty and streaming contracts is in their control. The value of adding a new employee could add 100’s of millions in market cap, particularly on the corporate development side. This would add significant value to these businesses and to shareholders over the long-term. Finding the right mix of headcount is no easy task.

Maybe, instead of adding more staff they will buyout smaller royalty companies instead of creating new royalties and adding more staff. Franco-Nevada and Royal Gold have a history of acquiring companies from past cycles. Will Wheaton Precious Metals take the plunge? We can see this new cycle being not much different to past and M&A will occur.

THE BENEFITS OF THESE ROYALTY COMPANIES FOR THE GOLD STOCK ANALYST

  • Blow-ups are less likely to occur for mining royalty stocks because they have a portfolio of revenue streams coming into the business.
  • Countercyclical to bank lending and Capital Markets Financing
    • Banks tend to reduce lending when the commodity prices fall, thus allowing the royalty and streaming companies to obtain new royalties and streams with less competition.
    • Capital markets reduce access to new equity capital when commodity prices fall, typically resulting in lower mining stock prices, and investors fleeing the sector.
  • They have optionality to commodity prices increases, across the majority of its royalties and streams, allowing them to boost revenues without doing anything.
  • These three royalty stocks (FNV, RGLD, WPM) are consistent dividend paying stocks.
  • Optionality to the expansion of a resource, that a royalty has a claim on, but may not generate revenue until the mine expands its operations onto the claim.
  • As new streams and royalties are added, it provides a moat of ring around the business that makes the business stronger and stronger. As more royalties turn into cash flowing royalties, it reduces the percentage any one royalty or stream has on the business.
  • M&A is probably a more likely scenario:
    • There has been a number of new entrants since 2015, and consolidation is inevitable with any industry.
    • It will be easier to acquire than do new royalties because the new royalty and streaming returns will be reduced because of new competition.
    • Higher commodity prices give miners confidence they can raise their capital through equity and/or debt than through a royalty.

Paul Farrugia, BCom. Paul is the President & CEO of First Macro Capital. He helps his readers identify mining stocks that you can hold for the long-term. He provides a checklist to find winning gold and silver mining producer stocks, including battery metals.


Source: 1. Yahoo Finance 2. Franco-Nevada. 3. Royal Gold

Disclaimer:

The information contained herein is obtained from sources believed to be reliable, but its accuracy cannot be guaranteed. It is not designed to meet your financial situation – we are not investment advisors, nor do we give personalized investment advice. The opinions expressed herein are those of the publisher and are subject to change without notice. It may become outdated, and there is no obligation to update any such information.

Investments recommended in our publications, blog posts, emails, online communications, or any online contents published by any party of First Macro Capital and its affiliated companies should be made only after consulting with your investment advisor and only after reviewing the prospectus or financial statements of the company in question. You should not make any decision based solely on what you read here.

First Macro Capital writers and publications do not take compensation in any form for covering those securities or commodities. First Macro Capital employees and agents of First Macro Capital and its affiliated companies own some of the stocks mentioned in this article,  prior to the writing of this article.

How Transparency International’s Corruption Perceptions Fail

By Dan Steinbock

The conventional view is that advanced economies have subdued corruption, which burdens mainly emerging countries. An alternative view is that dominant corruption indices are biased against emerging economies.

In the most recent Corruption Perceptions Index (CPI), the rankings are topped, as often before, by the tiny Nordic countries, Western Europe, the US and advanced Asia, including Singapore, Hong Kong and Japan. Yet, anomalies seem to abound.

South Korea’s performance improved the most when the country suffered from bribery and corporate scandals associated with the now-impeached president Park Geun-hue. Despite more than 100,000 anti-corruption indictments, China’s ranking has improved slowly and it is still ranked far behind Romania, Senegal, and Belarus,  which may come as a great surprise to foreign multinationals and expats operating in these countries.

The Philippines was seen as least corrupt when the drug trade thrived, corruption soared and US observers warned about the Philippines’ plunge toward a “narco state.” When the Duterte government began its fight against corruption, the ranking fell to its worst in years. In turn, Myanmar has steadily improved its ranking, while more than half a million Rohingyas have fled persecution to neighboring Bangladesh.

These anomalies and others cannot be easily explained away. They are systemic.


Methodological bias

While corruption may be too complex to be captured by a single score, CPI is often used precisely for that purpose. Also, no distinction is made in terms size. As a result, corruption and the ways to overcome it are seen as pretty much identical in both India and China, and in Suriname (560,000) and Solomon Islands (600,000).

Moreover, the CPI does not measure actual corruption, due to challenges in measurement, but perceived corruption, which adds to bias. If history is written by the victors, then corruption perceptions are framed by the world’s leading media companies, most of which are headquartered in the US and Western Europe.

Analysts and investors routinely use the CPI for longitudinal purposes. Yet, the methodology was changed only in 2012 to allow for comparison across time. And even these changes leave questions about such comparisons. In the case of Nigeria, the largest African economy, the CPI suggests that the country had some of its least corrupt years under President Jonathan Goodluck, even though that’s when illicit capital outflows soared.

In theory, CPI tries to bypass the bias problem by including “different” perceptions. The problem is that the sources appear different but perceptions aren’t. In practice, most come from the US and few European countries, including the World Bank, the Economist Intelligence Unit, Freedom House, Global Insights, and Political and Economic Risk Consultancy. In the emerging world, these sources are often – and for a good reason – criticized for US and Western bias.

Most problematically, the surveys focus largely on emerging countries, yet the latter are systematically excluded as sources, which do not include even a single think-tank or consultancy operating in emerging and developing economies. It is as if “diversity” would be redefined as different shades of white rather than as a rainbow.


Internal divides

The CPI was developed by the Transparency International (TI), an international non-governmental organization, which seeks to combat global corruption. Though based in Germany, TI’s key founders were not only Germans but represented the World Bank, US military intelligence, US multinationals and industrialists.

Intriguingly, even TI lacks internal consensus, as evidenced by recent drift between TI and its US affiliate. In 2012, Transparency International USA gave Hillary Clinton its Integrity Award, even as the US State Department issued a subpoena to the Clinton Foundation, which had raised $2 billion in two decades. Since 2000s, the Foundation had been criticized for lack of transparency, odd deals with resource-rich oligarchs and the highly controversial Blackwater Worldwide. In the Clinton deals, billions of dollars exchanged hands, but only a fraction ended in the final destination.

In 2013, TI members called for “Edward Snowden’s recognition as a whistleblower.” TI-USA rejected the idea. A year later, TI-USA honored Raytheon, a leading Pentagon defense contractor, for its “efforts to prevent corruption.” In 2015, Bechtel, a global nuclear-security giant, won TI-USA’s corporate leadership award. As questionable corporate capital soared in TI-USA, corruption perceptions increased around TI in both the US and Germany.

By January 2017, the open conflict between TI and its US arm led TI to strip its US affiliate of its accreditation. Today, TI-USA has renamed itself as “Coalition for Integrity,” and its major funders include US defense contractor giants (Lockheed Martin, and Raytheon) and security-nuclear conglomerates (Bechtel), financial interests (Citigroup, Deloitte) and multinationals (GE, Google, Johnson & Johnson, PepsiCo, Pfizer).


Private-sector corruption excluded

Oddly enough, the CPI only measures “public-sector” corruption. That’s a striking limitation and one that is routinely ignored by most who rely on the Index. The implications are many.

According to OECD, public sector employment is highest in Nordic countries (25%-35%), and countries with strong state (France and Russia 28%- 30%). In advanced economies, public sector has a lower role (15%-22% in UK, US and Germany). Conversely, private sector activities are significant in Nordic countries and state-led economies (60-75%), but higher in major advanced economies (over 80%).

Since the private sector is excluded, Sweden had one of the best CPI scores in 2015, even though TeliaSonera was facing serious bribery allegations. Despite the massive LIBOR scandal, the US and UK rankings did not take major hits. The same goes for corporate scandals from WorldCom and Enron to Lehman and AIG. Similarly, recent Volkswagen scandal failed to tarnish Germany’s high position.

In 2015 Transparency International actually accepted millions of dollars from Siemens, which has paid some of the largest corporate corruption fines for international bribes, and other companies criticized for corruption.


Illicit financial capital flows excluded

The private-sector exclusion means that the activities of multinationals dominating developing economies are ignored, although they also involve huge illicit financial flows to and from developing countries. The magnitude of estimated illicit inflows in the latest year for available data (2014) ranged from $1.4 to $2.5 trillion.

Yet, corruption indices typically rank developing countries, which suffer the most from these illicit flows, as the most corrupt, whereas advanced economies, which often benefit the most from such flows, are deemed the least corrupt.

Transparency International operates in a very important area. There is a huge, pressing need for an effective multidimensional corruption indicator. But the current Index is too prejudiced for informed analysis, too biased in its exclusions and too hypocritical in its professed neutrality.

About the Author:

Dr Dan Steinbock is the founder of Difference Group and has served as research director at the India, China and America Institute (USA) and visiting fellow at the Shanghai Institutes for International Studies (China) and the EU Center (Singapore). For more, see https://www.differencegroup.net/ 


The original, slightly shorter commentary was released by South China Morning Post on March 16, 2018

Fibonacci Retracements Analysis 16.03.2018 (BITCOIN, ETHEREUM)

Article By RoboForex.com

BTCUSD, “Bitcoin vs US Dollar”

In the H4 chart, the downtrend continues. After finishing the short-term correction and breaking the local low, BTCUSD has fallen towards the post-correctional extension area between the retracements of 138.2% and 161.8%. The closest downside target is at 7480.00. However, the main downside targets is the retracement of 261.8% at 5980.00. Taking into account the convergence that is being formed, one may expect a short-term pullback.

BTCUSD1
Risk Warning: the result of previous trading operations do not guarantee the same results in the future

As we can see in the H1 chart, the pair is being corrected to the upside and has already reached the retracement of 23.6%. The next targets may be the retracements of 38.2% and 50.0% at 8500.00 and 8765.00 respectively.

BTCUSD2
Risk Warning: the result of previous trading operations do not guarantee the same results in the future


ETHUSD, “Ethereum vs. US Dollar”

In the H4 chart, the downtrend continues; ETHUSD has reached the post-correctional extension area between the retracements of 138.2% and 161.8%. The next downside target is the retracement of 261.8% at 463.50. However, the main targets of the downtrend may be inside the post-correctional extension area between the retracements of 138.2% and 161.8% at 415.20 and 317.80 respectively.

ETHUSD1
Risk Warning: the result of previous trading operations do not guarantee the same results in the future

As we can see in the H1 chart, the pair is steadily falling towards 463.50.

ETHUSD2
Risk Warning: the result of previous trading operations do not guarantee the same results in the future


RoboForex Analytical Department

Article By RoboForex.com

Attention!
Forecasts presented in this section only reflect the author’s private opinion and should not be considered as guidance for trading. RoboForex LP bears no responsibility for trading results based on trading recommendations described in these analytical reviews.

Forex Technical Analysis & Forecast 16.03.2018 (EURUSD, GBPUSD, USDCHF, USDJPY, AUDUSD, USDRUB, GOLD, BRENT)

Article By RoboForex.com

EURUSD, “Euro vs US Dollar”

After reaching the target of the descending impulse, EURUSD has formed another consolidation range and broken it downwards. Possibly, the price may continue falling. The target is at 1.2245.

EURUSD
Risk Warning: the result of previous trading operations do not guarantee the same results in the future


GBPUSD, “Great Britain Pound vs US Dollar”

GBPUSD is trading to break 1.3936 downwards. The target is at 1.3877. After that, the instrument may grow to test 1.3936 from below and then resume falling inside the downtrend with the target at 1.3760.

GBPUSD
Risk Warning: the result of previous trading operations do not guarantee the same results in the future


USDCHF, “US Dollar vs Swiss Franc”

USDCHF has broken 0.9480 upwards and may continue growing to reach 0.9545. Later, the market may fall to return to 0.9480 and then continue forming the third wave with the target at 0.9620.

USDCHF
Risk Warning: the result of previous trading operations do not guarantee the same results in the future


USDJPY, “US Dollar vs Japanese Yen”

USDJPY is falling. Possibly, the price may break 105.80 downwards and then continue falling towards 105.04. After that, the instrument may resume growing to reach 106.50.

USDJPY
Risk Warning: the result of previous trading operations do not guarantee the same results in the future


AUDUSD, “Australian Dollar vs US Dollar”

AUDUSD has completed another descending structure. Today, the price may start another correction towards 0.7840. Later, the market may resume falling to reach the short-term target at 0.7630.

AUDUSD
Risk Warning: the result of previous trading operations do not guarantee the same results in the future


USDRUB, “US Dollar vs Russian Ruble”

USDRUB is moving upwards. Possibly, the price may reach 57.46 and then fall with the target at 56.85.

USDRUB
Risk Warning: the result of previous trading operations do not guarantee the same results in the future


XAUUSD, “Gold vs US Dollar”

Gold has broken 1320.00 downwards and may continue falling towards 1310.00. After that, the instrument may start another growth to return to 1320.00 and then continue falling inside the downtrend towards 1300.00.

GOLD
Risk Warning: the result of previous trading operations do not guarantee the same results in the future


BRENT

Brent has broken 64.98 upwards and may continue growing to reach 65.90. Later, the market may start another correction to return to 64.98 and then continue growing with the target at 67.90.

BRENT
Risk Warning: the result of previous trading operations do not guarantee the same results in the future


RoboForex Analytical Department

Article By RoboForex.com

Attention!
Forecasts presented in this section only reflect the author’s private opinion and should not be considered as guidance for trading. RoboForex LP bears no responsibility for trading results based on trading recommendations described in these analytical reviews.

EURUSD: drop on the hourly timeframe still incomplete

By Gabriel Ojimadu, Alpari


Previous:

On Thursday the 16th of March, trading on the euro closed down. The US dollar yesterday made gains against all the majors. Demand for it increased after the publication of US economic data.

The US posted a rise in import prices, a decline in initial jobless claims, and a significantly higher-than-expected value on the Fed’s NY Empire State manufacturing index.

Markets expect that the FOMC will raise interest rates by 0.25% next week. US10Y bond yields are currently trading at 2.83%. The end of yesterday’s session was met with the news that special prosecutor Robert Muller has subpoenaed Trump Organization documents in connection with the Russia probe.

US data:

  • Initial jobless claims (9 Mar): 226,000 (forecast: 226,000, previous: 230,000).
  • Import price index (Feb): 0.4% (forecast: 0.3%, previous: 0.8%).
  • Export price index (Feb): 0.2% (forecast: 0.3%, previous: 0.8%).
  • NY Empire State manufacturing index (Mar): 22.5 (forecast: 15.0, previous: 13.1).
  • Philadelphia Fed manufacturing survey (Mar): 22.3 (forecast: 23.0, previous: 25.8).

Day’s news (GMT+3):

  • 13:00 Eurozone: CPI (Feb).
  • 15:30 Canada: Canadian portfolio investment in foreign securities (Jan), foreign portfolio investment in Canadian securities (Jan), manufacturing shipments (Jan).
  • 15:30 USA: building permits (Feb), housing starts (Feb).
  • 16:15 USA: industrial production (Feb).
  • 17:00 USA: Michigan consumer sentiment index (Mar), JOLTS job openings (Jan).
  • 20:00 USA: Baker Hughes US oil rig count.

Fig 1. EURUSD hourly chart. Source: TradingView

The first half of my forecast yesterday worked out perfectly. This all changed, however, after the breakout of the trend line.

During the US session, sellers trading on the news managed to break through the horizontal support zone of 1.2340 – 1.2350, as well as the trend line from the 1.2273 low. The drop slowed down around the 90thdegree. This isn’t a significant support level, so after a correction to 1.2324 (22 degrees), I’m expecting the euro to drop against the greenback to the 112th degree at 1.2274.

The trend line extended from the high of 1.2413 runs through 1.2450 on the current hour (9:00 EET). Here, it is being bolstered by the 45th degree. Given that trading in Asia today paints a mixed picture of the US dollar, and that most of the euro crosses are trading up, we can’t rule out the possibility of quotes rising as far as 1.2340/50.

There’s a lot of news planned for today, which should keep market volatility high. It will be worth taking note of the Eurozone’s CPI for February during the European session.

China Toward Sustainable Growth

By Dan Steinbock

In the past, Chinese growth was too much fueled by credit. Now it is becoming more sustainable and the emphasis is shifting on living standards, poverty reduction and environmental protection.

In his annual work report, Chinese Premier Li Keqiang said on Monday that China aims to expand its economy by around 6.5 percent this year, or the same as in 2017.

However, numbers do not tell the full story. In the past, credit growth was almost twice as high as the growth rate. Now the government’s attention is on credit risks and higher-quality growth. The latter is exemplified by rising per capita incomes, eradication of poverty and the struggle against climate change.

Decelerating growth, rising incomes

Barely a decade ago, China still enjoyed double-digit growth. Today China’s growth is slowing relative to its past performance. Historically, that is the norm with all industrializing economies.

At the same time, rapidly-rising living standards are supporting thriving consumption. This narrative can be illustrated with the first term of President Xi Jinping and Premier Li Keqiang and their projected next half a decade, assuming the current trend line and peaceful conditions will prevail (Figure 1).

Between 2012 and 2022, Chinese growth rate could decelerate from 7.9 percent to 5.8 percent. Despite deceleration, living standards will double. In 2012, Chinese GDP per capita income was about $11,000. By 2022, it may increase to $20,000. That means that per capita incomes are likely to grow by 6.7 percent in China. That’s more than four times the comparable U.S. figure in the same time period.

In other words, the past “high-speed” growth, which was typical to intensive industrialization, is morphing into “high-quality” growth. Due to China’s huge size, the repercussions will reverberate around the world.

End of abject poverty

President Xi Jinping’s idea of “Chinese dream” is predicated on greater economic focus on quality and equality of development.  In the coming years, that is likely to mean investments in social equity to reduce uneven coverage of pension and health care insurance nationwide and better public services

It is also likely to translate to rejuvenation of rural areas, scaling of farming operations, increased spending on high school education and vocational training, affordable housing and extended rural land leases – and an aggressive push to eradicate poverty.

In his report, Li Keqiang said the government would seek to lift a further 10 million out of poverty in 2018, adding to the 68 million already relieved of that burden over the past five years (Figure 2).

China’s progressive eradication of poverty is a world-historical milestone.

Against climate change

A key aspect of new growth is Beijing’s goal to restore blue skies over the mainland by cutting pollutants dramatically by 2020, coupled with efforts to attract investors to put substantial funds into environmental rehabilitation.

Overall, the new stress on environmental protection means new technologies in green manufacturing and clean energy; cleaning up air, water and soil pollution; green finance; emissions-reduction per targets; and tighter environmental rules.

In aggregate terms, China has been the greatest polluter worldwide since the early 2010s. Yet, emissions must be measured on per capita terms, which allow true international comparisons because population size contributes significantly to countries’ aggregate pollution levels. In this comparative view, per capita emissions in China have never exceeded those in Germany and the US (Figure 3).

In the past half century, U.S. carbon dioxide (CO2) emissions have slowly decreased from more than 22 ton per capita to less than 16; in Germany, from 15 to less than 10. In China, per capita emissions increased dramatically during the reform period, due to rapid industrialization and export-led manufacturing. However, per capita emissions peaked at 7.5 in the mid-2010s but are now decreasing.

Double standards and climate change

In other words, even at the peak of industrialization, Chinese per capita emissions were only one third of the peak level in the US and only half of the corresponding German level.

It should also be recalled that, historically, the heavy phase of US and German industrialization took place a century ago. So when these two countries were in the stage of development in which China is today, their per capita emissions were far higher relative to China.

In China, it is imperative to cut down emissions as fast as possible, to ensure higher-quality growth. But it would be far, far more beneficial internationally if the major advanced economies would reduce their wasteful living styles, which in the 21st century will penalize future generations in emerging economies.

Double standards benefit nobody and only delay the inevitable.

About the Author:

Dr Dan Steinbock is the founder of Difference Group and has served as research director at the India, China and America Institute (USA) and visiting fellow at the Shanghai Institutes for International Studies (China) and the EU Center (Singapore). For more, see https://www.differencegroup.net/ 

The original commentary was published by China.org, China’s official government portal, on March 9, 2018.


Ichimoku Cloud Analysis 15.03.2018 (AUDUSD, NZDUSD, USDCAD)

Article By RoboForex.com

AUDUSD, “Australian Dollar vs US Dollar”

AUDUSD is trading at 0.7863; the instrument is moving above Ichimoku Cloud, which means that it may continue growing. The markets could indicate that the price may test Tenkan-Sen and Kijun-Sen at 0.7845 and then continue moving upwards to reach 0.7955. Another signal to confirm further ascending movement is the price’s rebounding from the support level. However, the scenario that Implies further growth may be cancelled if the price breaks the downside border of the cloud and fixes below 0.7780. In this case, the pair may continue falling towards 0.7720.


Risk Warning: the result of previous trading operations do not guarantee the same results in the future


NZDUSD, “New Zealand Dollar vs US Dollar”

NZDUSD is trading at 0.7318; the instrument is moving above Ichimoku Cloud, which means that it may continue growing. The markets could indicate that the price may test Tenkan-Sen and Kijun-Sen at 0.7295 and then continue moving upwards to reach 0.7405. Another signal to confirm further ascending movement is the price’s rebounding from the support level. However, the scenario that implies further growth may be cancelled if the price breaks the downside border of the cloud and fixes below 0.7230. In this case, the pair may continue falling towards 0.7165.


Risk Warning: the result of previous trading operations do not guarantee the same results in the future


USDCAD, “US Dollar vs Canadian Dollar”

USDCAD is trading at 1.2957; the instrument is moving above Ichimoku Cloud, which means that it may continue growing. The markets could indicate that the price may test the upside border of the cloud at 1.2925 and then continue moving upwards to reach 1.3120. However, the scenario that implies further growth may be cancelled if the price breaks the downside border of the cloud and fixes below 1.2810. In this case, the pair may continue falling towards 1.2750.


Risk Warning: the result of previous trading operations do not guarantee the same results in the future


RoboForex Analytical Department

Article By RoboForex.com

Attention!
Forecasts presented in this section only reflect the author’s private opinion and should not be considered as guidance for trading. RoboForex LP bears no responsibility for trading results based on trading recommendations described in these analytical reviews.

Japanese Candlesticks Analysis 15.03.2018 (GOLD, NZDUSD)

Article By RoboForex.com

XAUUSD, “Gold vs US Dollar”

As we can see in the H4 chart, XAUUSD continues trading at the support level and forming Hammer, Engulfing, and Inverted Hammer reversal patterns. These patterns indicate that the instrument may trade sideways for a while and then resume moving to the upside.

GOLD
Risk Warning: the result of previous trading operations do not guarantee the same results in the future


NZDUSD, “New Zealand vs. US Dollar”

As we can see in the H4 chart, after reaching another resistance level, NZDUSD has formed Engulfing and Shooting Star reversal patterns there. At the moment, it may be assumed that after finishing the correction the instrument may break the level and continue its ascending movement.

NZDUSD
Risk Warning: the result of previous trading operations do not guarantee the same results in the future


RoboForex Analytical Department

Article By RoboForex.com

Attention!
Forecasts presented in this section only reflect the author’s private opinion and should not be considered as guidance for trading. RoboForex LP bears no responsibility for trading results based on trading recommendations described in these analytical reviews.

EURUSD: trading expected within a range of 1.2348 – 1.2410

By Gabriel Ojimadu, Alpari

Previous:

On Wednesday the 14th of March, trading on the EURUSD pair closed down. The drop started during the European session from the 112th degree and the trend line. The rate dropped from 1.2413 to reach 1.2361. The euro’s drop was facilitated by Mario Draghi’s speech. He said that a strong euro would temper inflation, which is currently at a low level and needs to become more sustainable before ending the asset purchasing program.

The market then entered a phase of high volatility following reports that President Trump is considering imposing tariffs on up to 60bn USD of Chinese goods in order to address America’s trade deficit with China.

In the US session, the euro slumped to 1.2347 before closing at 1.2367 as weak US retail sales data weighed down on the dollar.

US data:

  • PPI (MoM) (Feb): 0.2% (forecast: 0.1%, previous: 0.4%).
  • PPI ex food & energy (MoM) (Feb): 0.2% (forecast: 0.2%, previous: 0.4%).
  • Retail sales (MoM) (Feb): -0.1% (forecast: 0.3%, previous: -0.1%).
  • Retail sales ex autos (MoM) (Feb): 0.2% (forecast: 0.4%, previous: 0.1%).

Day’s news (GMT+3):

  • 10:45 France: CPI (Feb).
  • 11:15 Switzerland: producer and import prices (Feb).
  • 11:30 Switzerland: SNB interest rate decision.
  • 15:30 USA: initial jobless claims (9 Mar), NY Empire State manufacturing index (Mar), import price index (Feb), Philadelphia Fed manufacturing survey (Mar).
  • 17:00 USA: NAHB housing market index (Mar).
  • 18:45 Eurozone: ECB’s Lautenschläger speech.
  • 23:00 USA: net long-term TIC flows (Jan).

Fig 1. EURUSD hourly chart. Source: TradingView

My prediction that buyers wouldn’t induce a breakout of the trend line yesterday turned out to be correct. They didn’t even try testing it, giving way to Mario Draghi’s speech. After dropping to the balance line, the EURUSD pair entered a sideways phase.

At the time of writing, the euro is trading at 1.2372. I reckon that fluctuations on this pair today will be limited to a range of 1.2348 – 1.2410. According to my calculations, the rate should drop to the trend line at 1.2350 (45 degrees) before rising to reach 1.2403 (45 degrees). So basically, I’m looking at movement between the 45th degrees.

1.2350 is a support level. If sellers manage to break it, the road to 1.2310 will open up. If the hourly bar closes below 1.2350, the case for growth disappears.

Eye Opening Index, Volatility, Charts and Predictions

By www.TheTechnicalTraders.com

Volatility setting up like 2014/2015, Get ready for some interesting range rotation and price swings.

Our recent research shows that the current US markets are setting up for what could become a very interesting price range rotation as well as increased volatility.  Our team of researchers at Technical Traders Ltd. have identified a number of key elements that appear to be in place similar to 2014/2015 where the market setup an initial deep price rotation, followed by a deeper price rotation only to end with an advanced price rally on the news that the US Fed would continue buying US debt.

Let us take a look at the 2014 price activity first.  You may not be able to see the similarities like our team of researchers, and I will confess, these charts have a lot of analysis on them making it a little noisy and hard to sort through, but if you focus on the September 2014 date range, you may notice a similarity to right now in the use markets (primarily the NQ).  The focus of this article is to alert you that the market dynamics are evolving quickly and you need to stay aware of the changes as they happen.  There is a huge amount of capital at play in the US markets and if our analysis is correct, our advanced price modeling tools will assist you in understanding what to expect in the near future.


This next chart shows us the ES (S&P) chart as of today.  It is clearly a different setup from the 2014 price setup – but still similar enough for our modeling systems to catch this event.  The volatility range of price is increasing in a sideways channel.  This could be a good thing for traders like us.  The volatility could present some real issues for trend followers like Hedge Funds and other modeling systems as they are not likely to see this price pattern setting up.

We believe the ES will rotate lower over the next few days to attempt to retest support near 2660 before attempting another short rally likely ending near, or just above 2800.  This would represent a failed price rotation with a new double top or higher high price level very similar to the second top near the end of September 2014.  We believe this second top could produce another deeper dive in prices sometime in early April 2018.  Still, the 2660 level is support and we would have to be cautious near those levels.


This next chart is the NQ (NASDAQ) and is showing a pattern that is much more similar to the 2014 ES chart.  Support at 6820 is our critical price level and we are expecting a downside market price move immediately to retest this level as well as the upward price channel (in light blue).  You can see the range expansion levels drawn in YELLOW and if you study this price rotation to the 2014 price chart, you’ll see some strange similarities.

What is happening is that price is lacking direction and is attempting to hammer out peaks and valleys in an attempt to find support and resistance.  The chance of a deeper price move as well as increased volatility is quite high the further this pattern continue to form.  Any price move lower will likely cause the VIX to increase back above 20 and any price swing below 6600 on the NQ will likely cause the VIX to spike well above 25 again.  As you can see, the downside price volatility range is near 5900.

In fact, we called this rally nearly to the day over a month ago completing the bullish outlook portion. Now, the question is if our current analysis and our 6-week old prediction are correct with a big selloff.


See this near perfect stock market prediction we posted the day the market bottomed!

Our Adaptive Dynamic Learning (ADL) price modeling system is showing the VIX is setting up for a massive increase over the next two to three weeks.  VIX is currently trading near 16 and could spike to as high as 40 within just a few weeks.  The only way the VIX could attempt a move like this is with a moderately deep downward price move that would take out or test our support levels.  This is part of the analysis we conduct on a Daily basis at www.TheTechnicalTraders.com.  It is not just about one or two charts – we look at all the puzzle pieces to see how they all fit together to give us a very clear picture of what is likely to happen in the future.

This could set us up for a good short volatility trade much like the last one in Feb where we shorted UVXY for a quick 42.5% profit.


Want to know what you should be trading and how you can profit from these setups?  First thing to do is to understand this is a “trader’s” market and that you probably need some help understanding these moves.  Second thing to consider is how will you identify opportunities from this move while protecting your investment capital?  The last thing to consider is if http://www.thetechnicaltraders.com/#video is the right solution to assist you moving forward to help you navigate these markets and stay aware of these opportunities?

We believe our research is as beyond compare.  We don’t believe you can find any other firm that can accurately predict what is going to happen in the future and that our advance price modeling systems and predictive analysis models assist us in keeping our clients keenly aware of future moves and relatively safe from unexpected events.  Want to know how we can help you, visit www.TheTechnicalTraders.com and review some of our recent research reports and see how well we’ve been nailing these market moves for 2018.  We hope to see you in our members area so we can share more insight with you.

Chris Vermeulen