Author Archive for InvestMacro – Page 425

10-Year Note Speculators cut back on bearish net positions for 2nd week

By CountingPips.comReceive our weekly COT Reports by Email

10-Year Note Non-Commercial Speculator Positions:

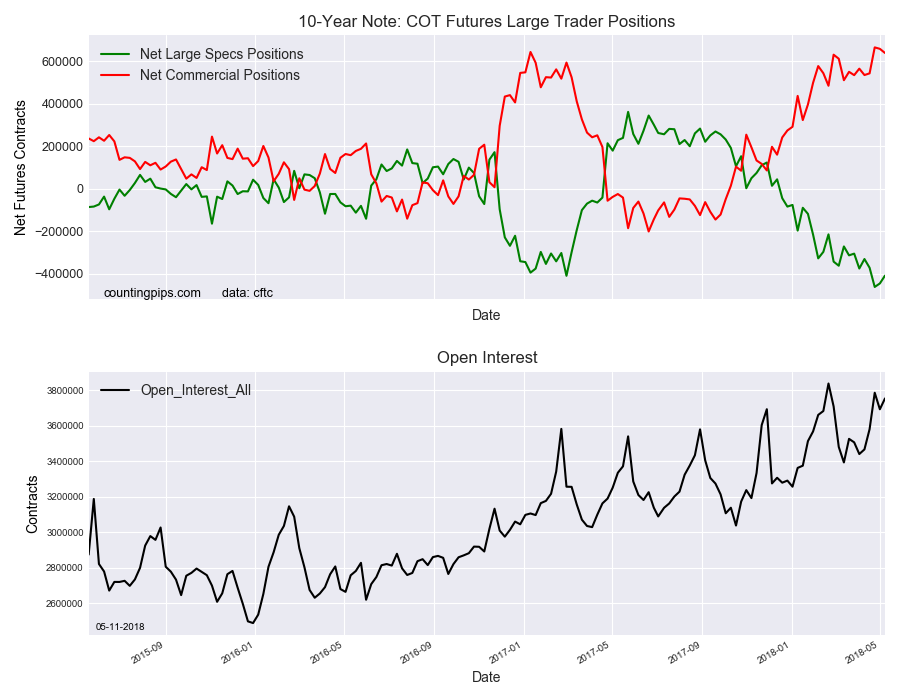
Large bond speculators reduced their bearish net positions in the 10-Year Note futures markets again this week, according to the latest Commitment of Traders (COT) data released by the Commodity Futures Trading Commission (CFTC) on Friday.

The non-commercial futures contracts of 10-Year Note futures, traded by large speculators and hedge funds, totaled a net position of -408,629 contracts in the data reported through Tuesday May 8th. This was a weekly gain of 37,049 contracts from the previous week which had a total of -445,678 net contracts.

Speculative bearish positions have fallen for two weeks by a total of +53,504 contracts following the record high bearish position that was reached on April 24th. The overall speculator level remains highly bearish and above the -400,000 net contract level for a third consecutive week.

10-Year Note Commercial Positions:

The commercial traders position, hedgers or traders engaged in buying and selling for business purposes, totaled a net position of 639,852 contracts on the week. This was a weekly decrease of -19,556 contracts from the total net of 659,408 contracts reported the previous week.
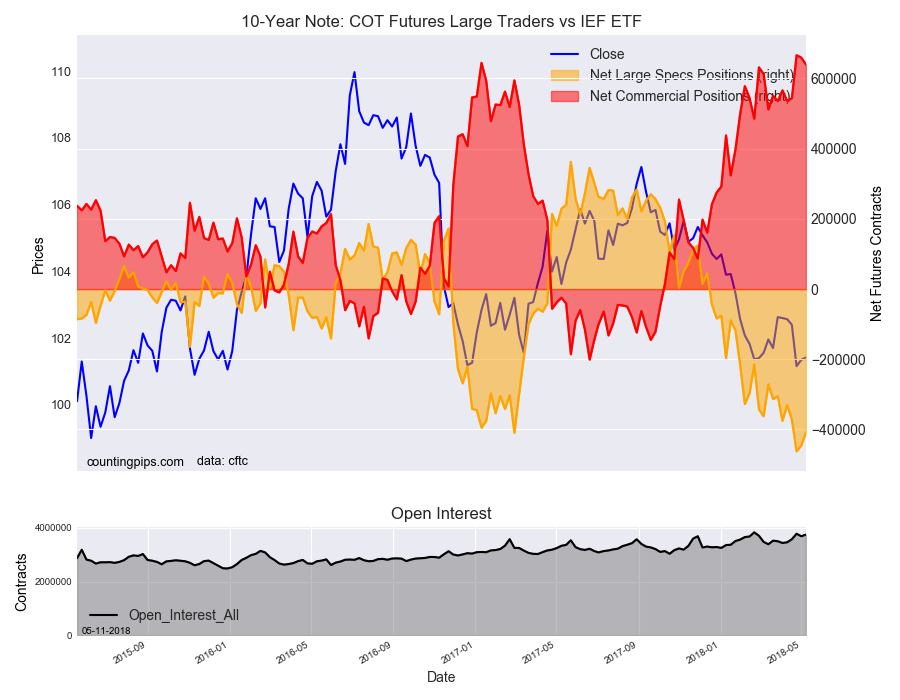
IEF ETF:

Over the same weekly reporting time-frame, from Tuesday to Tuesday, the 7-10 Year Treasury Bond ETF (IEF) closed at approximately $101.42 which was a tick higher by $0.07 from the previous close of $101.35, according to unofficial market data.

*COT Report: The COT data, released weekly to the public each Friday, is updated through the most recent Tuesday (data is 3 days old) and shows a quick view of how large speculators or non-commercials (for-profit traders) as well as the commercial traders (hedgers & traders for business purposes) were positioned in the futures markets. The CFTC categorizes trader positions according to commercial hedgers (traders who use futures contracts for hedging as part of the business), non-commercials (large traders who speculate to realize trading profits) and nonreportable traders (usually small traders/speculators). Find CFTC criteria here: (http://www.cftc.gov/MarketReports/CommitmentsofTraders/ExplanatoryNotes/index.htm).

Article By CountingPips.comReceive our weekly COT Reports by Email

Bitcoin Speculators slightly added to their bearish net positions this week

By CountingPips.comReceive our weekly COT Reports by Email

Bitcoin Non-Commercial Speculator Positions:

Large cryptocurrency speculators edged their bearish net positions slightly higher in the Bitcoin futures markets this week, according to the latest Commitment of Traders (COT) data released by the Commodity Futures Trading Commission (CFTC) on Friday.

The non-commercial futures contracts of Bitcoin futures, traded by large speculators and hedge funds, totaled a net position of -1,635 contracts in the data reported through Tuesday May 8th. This was a weekly decline of -38 contracts from the previous week which had a total of -1,597 net contracts.

Small traders, meanwhile, raised their existing bullish positions this week by an equally offsetting 38 contracts to the current level of 1,635 net contracts.

The large speculator position had seen its bearish position decrease in the previous two weeks before this week’s small rise. Overall, the trader positions in this crypto market have stayed rather subdued and have not seen any major swings since the start of futures trading. The open interest level remains small around the 5,000-6,000 contract threshold.


Bitcoin Futures COT Data: Speculators vs Small Traders

The Bitcoin futures data is in its twenty-first week since the start of the cryptocurrency futures data on December 19th. The data includes trader classifications of only speculators and small traders and without commercial traders (typically business hedgers or producers of a commodity).

Speculators continue to be bearish as they have since the beginning of the bitcoin data releases while the small traders remain on the bullish side of this market.

Bitcoin per USD:

Over the same weekly reporting time-frame, from Tuesday to Tuesday, the Bitcoin Cryptocurrency Futures closed at approximately $9182.74 which was a gain of $108.33 from the previous close of $9074.41, according to unofficial market data.

*COT Report: The COT data, released weekly to the public each Friday, is updated through the most recent Tuesday (data is 3 days old) and shows a quick view of how large speculators or non-commercials (for-profit traders) as well as the commercial traders (hedgers & traders for business purposes) were positioned in the futures markets. The CFTC categorizes trader positions according to commercial hedgers (traders who use futures contracts for hedging as part of the business), non-commercials (large traders who speculate to realize trading profits) and nonreportable traders (usually small traders/speculators). Find CFTC criteria here: (http://www.cftc.gov/MarketReports/CommitmentsofTraders/ExplanatoryNotes/index.htm).

Article By CountingPips.comReceive our weekly COT Reports by Email

Gold Speculators edged their bullish bets slightly higher this week

By CountingPips.comReceive our weekly COT Reports by Email

Gold Non-Commercial Speculator Positions:

Large metals speculators very slightly raised their bullish net positions in the Gold futures markets this week after two down weeks, according to the latest Commitment of Traders (COT) data released by the Commodity Futures Trading Commission (CFTC) on Friday.

The non-commercial futures contracts of Gold futures, traded by large speculators and hedge funds, totaled a net position of 107,440 contracts in the data reported through Tuesday May 8th. This was a weekly lift of 661 contracts from the previous week which had a total of 106,779 net contracts.

Speculative positions had dropped sharply in the previous two weeks by a total of -56,290 contracts before this week’s small turnaround. The overall bullish level remains just above the +100,000 net contract level for a second consecutive week.

Gold Commercial Positions:

The commercial traders position, hedgers or traders engaged in buying and selling for business purposes, totaled a net position of -134,984 contracts on the week. This was a weekly drop of -3,112 contracts from the total net of -131,872 contracts reported the previous week.

GLD ETF:

Over the same weekly reporting time-frame, from Tuesday to Tuesday, the GLD ETF, which tracks the price of gold, closed at approximately $124.59 which was a gain of $0.88 from the previous close of $123.71, according to unofficial market data.

*COT Report: The COT data, released weekly to the public each Friday, is updated through the most recent Tuesday (data is 3 days old) and shows a quick view of how large speculators or non-commercials (for-profit traders) as well as the commercial traders (hedgers & traders for business purposes) were positioned in the futures markets. The CFTC categorizes trader positions according to commercial hedgers (traders who use futures contracts for hedging as part of the business), non-commercials (large traders who speculate to realize trading profits) and nonreportable traders (usually small traders/speculators). Find CFTC criteria here: (http://www.cftc.gov/MarketReports/CommitmentsofTraders/ExplanatoryNotes/index.htm).

Article By CountingPips.comReceive our weekly COT Reports by Email

S&P500 Mini Speculators sharply cut their bullish net positions this week

By CountingPips.comReceive our weekly COT Reports by Email

S&P500 Mini Non-Commercial Speculator Positions:

Large stock market speculators sharply decreased their bullish net positions in the S&P500 Mini futures markets this week, according to the latest Commitment of Traders (COT) data released by the Commodity Futures Trading Commission (CFTC) on Friday.

The non-commercial futures contracts of S&P500 Mini futures, traded by large speculators and hedge funds, totaled a net position of 162,355 contracts in the data reported through Tuesday May 8th. This was a weekly decline of -66,878 contracts from the previous week which had a total of 229,233 net contracts.

Speculative positions saw the largest one week drop since February 13th when positions fell by -107,214 contracts. Overall, the spec position fell below the +200,000 contract threshold for the first time in seven weeks and now reside at the the lowest level since March 20th when net positions totaled +83,293 contracts.

S&P500 Mini Commercial Positions:

The commercial traders position, hedgers or traders engaged in buying and selling for business purposes, totaled a net position of -465,004 contracts on the week. This was a weekly gain of 36,580 contracts from the total net of -501,584 contracts reported the previous week.

The commercials had increased their bearish positions for six straight weeks and pushed bearish bets to the largest level since 1997 last week before this week’s turnaround.

SPY ETF:

Over the same weekly reporting time-frame, from Tuesday to Tuesday, the SPY ETF, which tracks the price of S&P500 Index, closed at approximately $266.92 which was an uptick of $1.94 from the previous close of $264.98, according to unofficial market data.

*COT Report: The COT data, released weekly to the public each Friday, is updated through the most recent Tuesday (data is 3 days old) and shows a quick view of how large speculators or non-commercials (for-profit traders) as well as the commercial traders (hedgers & traders for business purposes) were positioned in the futures markets. The CFTC categorizes trader positions according to commercial hedgers (traders who use futures contracts for hedging as part of the business), non-commercials (large traders who speculate to realize trading profits) and nonreportable traders (usually small traders/speculators). Find CFTC criteria here: (http://www.cftc.gov/MarketReports/CommitmentsofTraders/ExplanatoryNotes/index.htm).

Article By CountingPips.comReceive our weekly COT Reports by Email

Silver Speculators cut bearish bets to a small short position this week

By CountingPips.comReceive our weekly COT Reports by Email

Silver Non-Commercial Speculator Positions:

Large metals speculators decreased their bearish net positions in the Silver futures markets this week, according to the latest Commitment of Traders (COT) data released by the Commodity Futures Trading Commission (CFTC) on Friday.

The non-commercial futures contracts of Silver futures, traded by large speculators and hedge funds, totaled a net position of -121 contracts in the data reported through Tuesday May 8th. This was a weekly gain of 7,075 contracts from the previous week which had a total of -7,196 net contracts.

Speculative positions are virtually in a neutral position with just a tiny short position of -121 contracts. This week’s rebound follows a sharp drop last week by -19,163 contracts and the overall position remains in a short position for a second week.

Silver Commercial Positions:

The commercial traders position, hedgers or traders engaged in buying and selling for business purposes, totaled a net position of -17,077 contracts on the week. This was a weekly decrease of -5,099 contracts from the total net of -11,978 contracts reported the previous week.

SLV ETF:

Over the same weekly reporting time-frame, from Tuesday to Tuesday, the SLV ishares ETF, which tracks the price of silver, closed at approximately $15.51 which was an increase of $0.27 from the previous close of $15.24, according to unofficial market data.

*COT Report: The COT data, released weekly to the public each Friday, is updated through the most recent Tuesday (data is 3 days old) and shows a quick view of how large speculators or non-commercials (for-profit traders) as well as the commercial traders (hedgers & traders for business purposes) were positioned in the futures markets. The CFTC categorizes trader positions according to commercial hedgers (traders who use futures contracts for hedging as part of the business), non-commercials (large traders who speculate to realize trading profits) and nonreportable traders (usually small traders/speculators). Find CFTC criteria here: (http://www.cftc.gov/MarketReports/CommitmentsofTraders/ExplanatoryNotes/index.htm).

Article By CountingPips.comReceive our weekly COT Reports by Email

VIX Speculators continued to trim their bullish net positions again this week

By CountingPips.comReceive our weekly COT Reports by Email

VIX Non-Commercial Speculator Positions:

Large volatility speculators reduced their bullish net positions in the VIX futures markets this week, according to the latest Commitment of Traders (COT) data released by the Commodity Futures Trading Commission (CFTC) on Friday.

The non-commercial futures contracts of VIX futures, traded by large speculators and hedge funds, totaled a net position of 17,589 contracts in the data reported through Tuesday May 8th. This was a weekly decline of -3,373 contracts from the previous week which had a total of 20,962 net contracts.

Speculative positions have declined for four consecutive weeks following a run up to a record high level on April 10th. The overall bullish position remains at the lowest level since the speculative positions turned bullish on February 6th.

VIX Commercial Positions:

The commercial traders position, hedgers or traders engaged in buying and selling for business purposes, totaled a net position of -13,488 contracts on the week. This was a weekly boost of 3,791 contracts from the total net of -17,279 contracts reported the previous week.

VIX:

Over the same weekly reporting time-frame, from Tuesday to Tuesday, the VIX, which tracks the volatility of the S&P500, closed at approximately 14.71 which was a fall of -0.78 from the previous close of 15.49, according to unofficial market data.

*COT Report: The COT data, released weekly to the public each Friday, is updated through the most recent Tuesday (data is 3 days old) and shows a quick view of how large speculators or non-commercials (for-profit traders) as well as the commercial traders (hedgers & traders for business purposes) were positioned in the futures markets. The CFTC categorizes trader positions according to commercial hedgers (traders who use futures contracts for hedging as part of the business), non-commercials (large traders who speculate to realize trading profits) and nonreportable traders (usually small traders/speculators). Find CFTC criteria here: (http://www.cftc.gov/MarketReports/CommitmentsofTraders/ExplanatoryNotes/index.htm).

Article By CountingPips.comReceive our weekly COT Reports by Email

Copper Speculators reduced their bullish net positions for 2nd week

By CountingPips.comReceive our weekly COT Reports by Email

Copper Non-Commercial Speculator Positions:

Large precious metals speculators cut back on their bullish net positions in the Copper futures markets this week, according to the latest Commitment of Traders (COT) data released by the Commodity Futures Trading Commission (CFTC) on Friday.

The non-commercial futures contracts of Copper futures, traded by large speculators and hedge funds, totaled a net position of 33,452 contracts in the data reported through Tuesday May 8th. This was a weekly lowering of -1,464 contracts from the previous week which had a total of 34,916 net contracts.

Speculative bets have fallen for two straight weeks following a jump in bullish bets on April 24th by +11,919 contracts. The overall position remains above the +30,000 net contract level for a fourth straight week.

Copper Commercial Positions:

The commercial traders position, hedgers or traders engaged in buying and selling for business purposes, totaled a net position of -39,227 contracts on the week. This was a weekly gain of 2,372 contracts from the total net of -41,599 contracts reported the previous week.

Copper Futures:

Over the same weekly reporting time-frame, from Tuesday to Tuesday, the Copper Futures (Front Month) closed at approximately $305.9 which was an uptick of $2.15 from the previous close of $303.75, according to unofficial market data.

*COT Report: The COT data, released weekly to the public each Friday, is updated through the most recent Tuesday (data is 3 days old) and shows a quick view of how large speculators or non-commercials (for-profit traders) as well as the commercial traders (hedgers & traders for business purposes) were positioned in the futures markets. The CFTC categorizes trader positions according to commercial hedgers (traders who use futures contracts for hedging as part of the business), non-commercials (large traders who speculate to realize trading profits) and nonreportable traders (usually small traders/speculators). Find CFTC criteria here: (http://www.cftc.gov/MarketReports/CommitmentsofTraders/ExplanatoryNotes/index.htm).

Article By CountingPips.comReceive our weekly COT Reports by Email

Fibonacci Retracements Analysis 11.05.2018 (BITCOIN, ETHEREUM)

Article By RoboForex.com

BTCUSD, “Bitcoin vs US Dollar”

As we can see in the H4 chart, the divergence made BTCUSD complete the uptrend and start a new correction to the downside, which has already reached the retracement of 38.2% at 8605.60. The next downside targets may be the retracements of 50.0% and 61.8% at 8198.00 and 7779.50 respectively. The resistance level is the high at 9944.00.

BTCUSD1
Risk Warning: the result of previous trading operations do not guarantee the same results in the future

The H1 chart shows more detailed structure of the current movement.

BTCUSD2
Risk Warning: the result of previous trading operations do not guarantee the same results in the future


ETHUSD, “Ethereum vs. US Dollar”

As we can see in the H4 chart, the divergence made ETHUSD reverse and start a new descending correction, which has already reached the retracement of 23.6%. The next downside targets may be the retracements 38.2%, 50.0%, and 61.8% at 650.70, 595.00 and 540.90 respectively.

ETHUSD1
Risk Warning: the result of previous trading operations do not guarantee the same results in the future

In the H1 chart, the pair is being corrected to the downside to reach the retracement of 38.2% at 650.70.

ETHUSD2
Risk Warning: the result of previous trading operations do not guarantee the same results in the future


RoboForex Analytical Department

Article By RoboForex.com

Attention!
Forecasts presented in this section only reflect the author’s private opinion and should not be considered as guidance for trading. RoboForex LP bears no responsibility for trading results based on trading recommendations described in these analytical reviews.

Forex Technical Analysis & Forecast 11.05.2018 (EURUSD, GBPUSD, USDCHF, USDJPY, AUDUSD, USDRUB, GOLD, BRENT)

Article By RoboForex.com

EURUSD, “Euro vs US Dollar”

EURUSD has broken the top of the first ascending impulse and may continue growing towards the first target of the correction at 1.1964. After that, the instrument may fall to reach the second target at 1.1894, thus forming another consolidation range. If later the instrument breaks this range to the upside, the market may continue its growth to reach 1.2140; if to the downside – resume falling towards 1.1740.

EURUSD
Risk Warning: the result of previous trading operations do not guarantee the same results in the future


GBPUSD, “Great Britain Pound vs US Dollar”

GBPUSD is has completed another descending impulse. Today, the price may grow towards 1.3555 and then fall with the short-term target at 1.3407. Later, the market may test 1.3484 from below and then start another decline towards 1.3355.

GBPUSD
Risk Warning: the result of previous trading operations do not guarantee the same results in the future


USDCHF, “US Dollar vs Swiss Franc”

USDCHF is still consolidating near the highs. If the instrument breaks this range to the downside, the market may start a new decline to reach 0.9935; if to the upside – continue growing with the target at 1.0116.

USDCHF
Risk Warning: the result of previous trading operations do not guarantee the same results in the future


USDJPY, “US Dollar vs Japanese Yen”

USDJPY is trading to rebound from the upside border of its consolidation range downwards. Possibly, today the price may fall to reach 108.80 and then grow towards 109.40. If later the instrument breaks this range to the downside, the market may start another decline to reach the target at 107.20; if to the upside – extend this structure towards 111.00.

USDJPY
Risk Warning: the result of previous trading operations do not guarantee the same results in the future


AUDUSD, “Australian Dollar vs US Dollar”

AUDUSD has broken its range to the upside and may continue growing towards 0.7555. After that, the instrument may fall to reach 0.7484, thus forming another consolidation range. If later the price breaks this range to the downside, the downtrend may continue towards 0.7420; if to the upside – start another growth with the target at 0.7590.

AUDUSD
Risk Warning: the result of previous trading operations do not guarantee the same results in the future


USDRUB, “US Dollar vs Russian Ruble”

USDRUB has reached another downside target. Today, the price may grow towards 63.20 and then resume falling inside the third wave towards the short-term target at 60.20.

USDRUB
Risk Warning: the result of previous trading operations do not guarantee the same results in the future


XAUUSD, “Gold vs US Dollar”

Gold has reached its upside target. Possibly, today the price may fall towards 1312.00 and then grow to reach 1317.00, thus forming another consolidation range. If later the instrument breaks this range to the downside, the market may resume falling with the target at 1295.00.

GOLD
Risk Warning: the result of previous trading operations do not guarantee the same results in the future


BRENT

Brent is consolidating above 76.42. Today, the price may test this level from above and then grow towards 78.10. If later the instrument breaks this range to the upside, the market may resume growing to reach 79.45; if to the downside – start another correction towards 74.00.

BRENT
Risk Warning: the result of previous trading operations do not guarantee the same results in the future


RoboForex Analytical Department

Article By RoboForex.com

Attention!
Forecasts presented in this section only reflect the author’s private opinion and should not be considered as guidance for trading. RoboForex LP bears no responsibility for trading results based on trading recommendations described in these analytical reviews.

Admiral Markets Provides an Extensive Coverage of Stocks and ETFs in MetaTrader 5

Admiral Markets clients holding MetaTrader 5 accounts have now access to a much greater variety of stocks and share CFDs, as well as exchange-traded funds (ETFs), which have been introduced by the company for the first time.

The new instruments include:

1. Admiral.MT5 account: over 3,000 new stock CFDs and 80 ETF CFDs
2. Admiral.Invest account: over 4,000 new stocks and 100 ETFs.

The new offering provides top-volume stocks and exchange-traded funds (as well as CFDs on the majority of the same assets) from the following exchanges:

1. Austria (VIE)
2. Belgium (Euronext)
3. Denmark (CSE)
4. Finland (NASDAQ)
5. France (Euronext)
6. Germany (Xetra)
7. Netherlands (Euronext)
8. Norway (NASDAQ)
9. Portugal (Euronext)
10. Spain (BME)
11. Sweden (NASDAQ)
12. Switzerland (SWX)
13. United Kingdom (LSE)
14. United States (AMEX, NASDAQ and NYSE)

Together with the previously available instruments, Admiral Markets offering is now one of the largest amongst all online trading venues. Along with the leading trading platform – MetaTrader 5 – Admiral Markets also provides some of the most competitive terms for both traders and investors. Below are highlighted some of the major details:

1. Share and ETF CFDs on Admiral.MT5 Account

– Margin rates: from 1:2 to 1:20 (depends on the liquidity of the underlying asset)
– Short selling: available for all CFDs
– Commissions (per one-sided transaction):
– EU – from 0.1%, minimum 4.0 EUR
– UK – from 0.1%, minimum 4.0 GBP
– US – from 0.01 USD, minimum 1.0 USD
– Dividend adjustments:
– long – 65-85% (paid)
– short -100% (charged)
– Daily financing:
– if the benchmark rate (‘BR’) is positive, the daily financing is calculated as BR +/- 2.5%;
– if the BR is negative, the daily financing is calculated as -2.5% / BR – 2.5%;
– the daily financing is charged for long positions and paid for short positions (if the resulting financing rate for short positions is negative, it’s a charge).

2. Stocks and ETFs on Admiral.Invest Account

– Margin rate: 1:1
– Short selling: not available
– Commissions (per one-sided transaction):
– EU – from 0.12%, minimum 5.0 EUR
– UK – 8.0 GBP for stocks, 0.07% for ETFs and minimum 8.0 GBP for both
– US – from 0.01 USD, minimum 1.0 USD
– Dividends: 100% (paid)
– Taxes collected by Admiral Markets:
– UK – Stamp Duty Reserve Tax (SDRT): 0.5%;
– France – Taxe sur les transactions financières: 0.3%. Charged for stocks from this list.
– Other ongoing costs: none

The market data on shares, ETFs, and their respective CFDs is available in real-time at no charge for live accounts and is delayed by 15 minutes on Demo accounts.

Please find more details about the new offering via Admiral Markets’ official announcement.


Risk disclosure: Forex and CFD’s carry a high level of risk and losses may exceed your initial deposit. Admiral Markets UK Ltd. recommends you seek advice from an independent financial advisor to ensure that you understand the risks involved with Forex, CFD’s, Margin and Leveraged trading.