There is nothing more exciting to us than reading the price action of the charts to see what will happen in the future. It becomes even more exciting when we find something that everyone else seems to have missed. Right now, traders need to pay attention to our research because we believe we have correctly identified a breakout pattern that is setting up in the US majors – and everyone seems to have missed it.
Recently, our research team began a quest to properly identify the Elliot Wave structure of the US majors in relation to the recent price congestion after the February 2018 price collapse. You can read our earlier research post to better understand our conclusions.
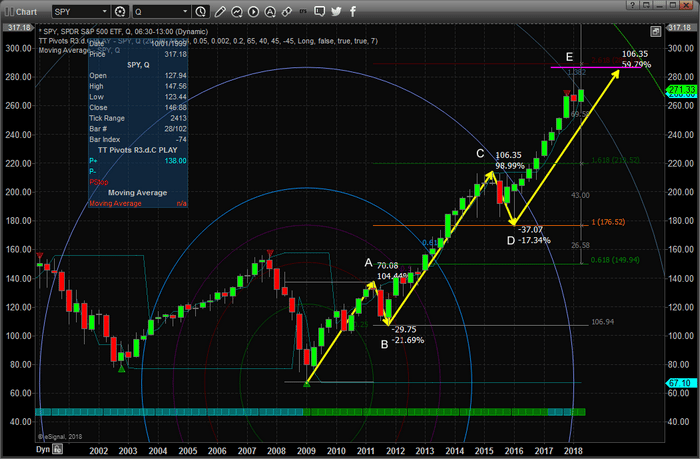
Our research shows that price could be setting up in a very unique extended Wave C pattern that would indicate the recent price correction in the markets could be a Wave D price rotation setting up a “Diagonal Price Breakout” pattern.
How is this analysis important to all traders and investors? It is critical to understand that if the majority of market analysts believe this is a Wave 5 Top Setup, believing this is an ultimate top, when the reality is this is an extended Wave 3 (2.618 x Wave 1) and possibly the Wave 3-d formation, the long-term analysis is dramatically different. Instead of an “ultimate top” setup, this analysis now becomes a “price correction in a longer-term upside trend with much greater upside potential to go”.
Let’s get into the details of this analysis to better illustrate our thinking.
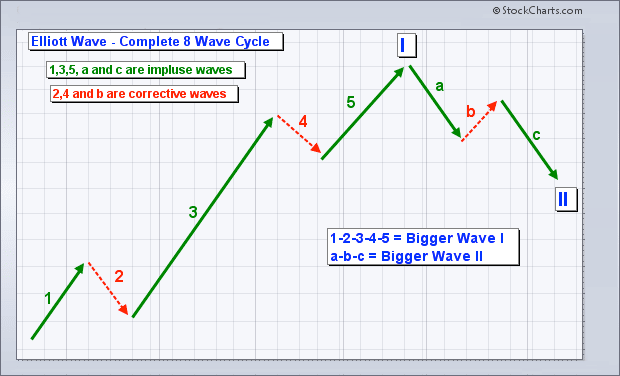
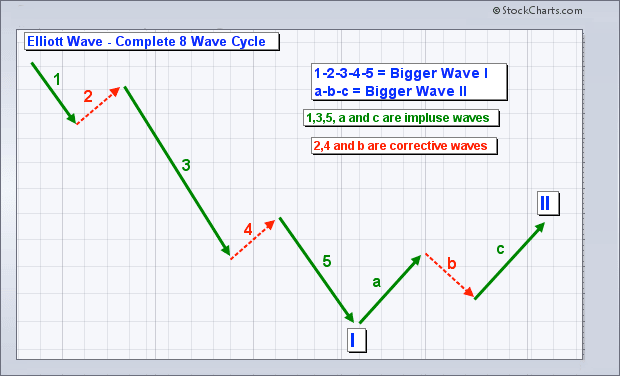
Without going into the details of how Elliot Wave theory works or the fractal price rotation balance that is essentially correlated to Fibonacci price theory, we want our readers to focus on this “Ending Diagonal” that is common near the end of wave 3 or “always in wave 5 of a motive wave sequence”. The source for this information and image below is from World Cycles Institute.
BULL MARKET MOTIVE ENDING DIAGONAL PATTERN
The Bull Market Motive Ending Diagonal pattern is the one that caught our attention as we attempted to better understand the current market price structure in the SPY chart. Pay very close attention to this pattern because we strongly believe most of the major analysts have completely missed the structure of price in relation to the upside potential within the US markets. As you are likely aware, our advanced predictive modeling systems have been warning of a price bottom and much higher price predictions over the past 30+ days. This prediction does not settle well with many traditional analysts because they seem fixated on the Wave 5 ultimate top analysis. We believe they are wrong and we will show you why – keep reading.
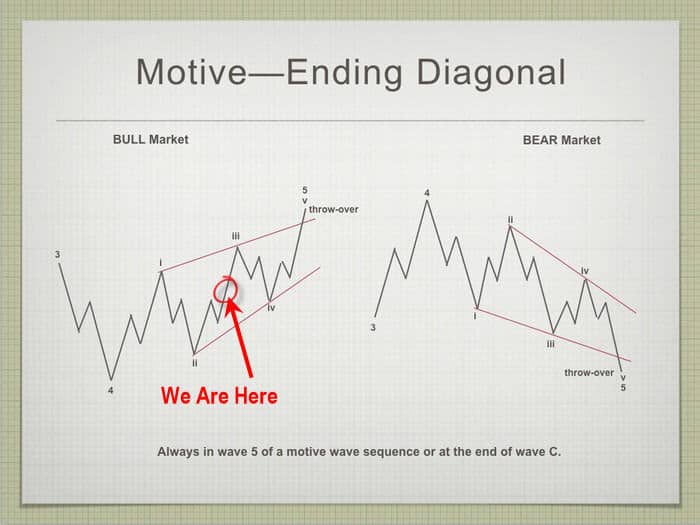
This type of Ending Diagonal is very common near the end point of a larger Wave 3 formation – often setting up a Wave 5. This type of Ending Diagonal is rarely seen as a wave C. (source : http://elliottwavepredictions.com/wave-notes/).
Remember, we believe most of the best analysts on the planet have missed this setup and believe the early February price top is the “ultimate wave 5 peak” setting up a much broader downside price move. Here is why we believe these analysis are wrong.
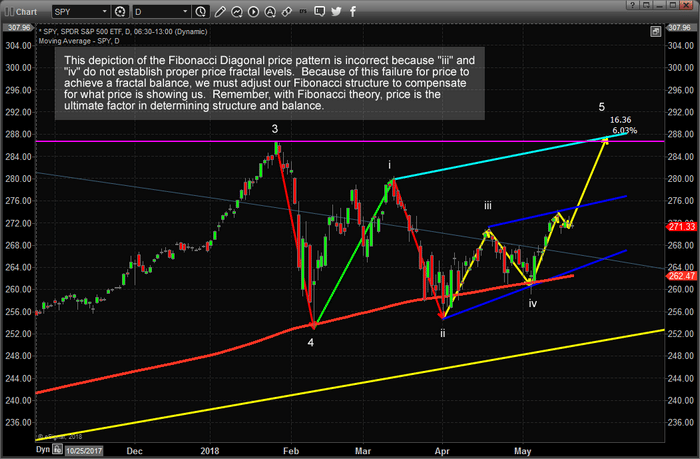
INCORRECT SPY DAILY CHART ANALYSIS EVERYONE IS USING
This SPY Daily chart shows what most analysts would identify as a proper Elliot Wave count if they understood the Ending Diagonal pattern that was setting up. This is incorrect because the lower price rotation (iii and iv) are structurally invalid based on Fibonacci time/price structure. We believe this is one reason why so many analysts have misinterpreted this current price pattern.
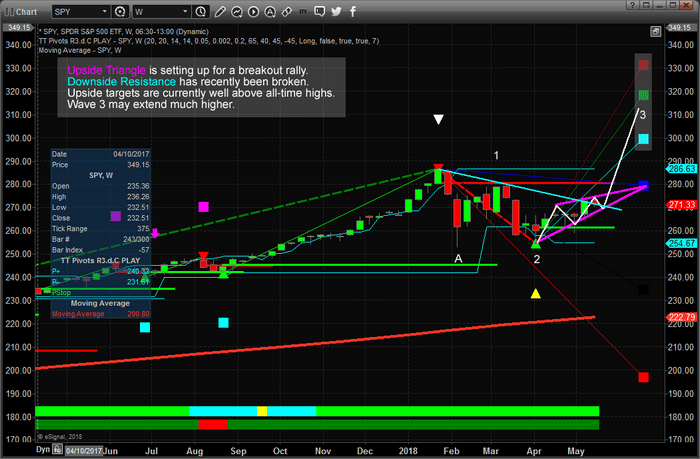
CORRECT SPY DAILY CHART ANALYSIS
The correct analysis of this pattern is shown below. The difference, in our opinion, is that wave “iii” is still in the process of forming and will ultimately breakout to new highs before forming a short retracement and rocketing much higher to complete the ultimate wave 5.
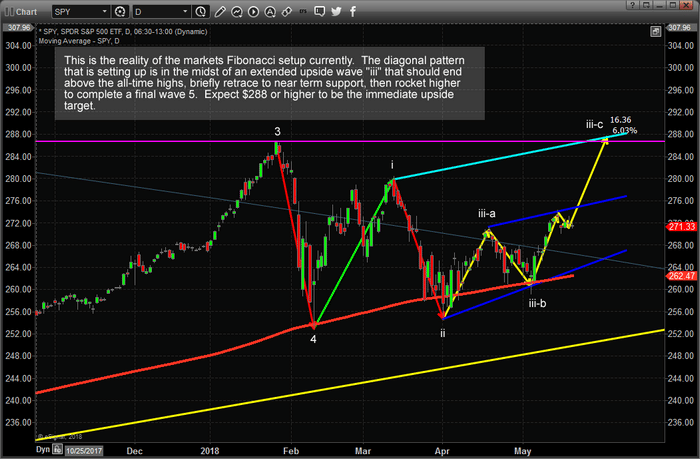
Please take notice of the CYAN price line drawn by our researchers. Structurally, this price level must be reached in order to complete a wave “iii”. We believe once this “new price high” level is reached and the market price retraces, the retracement level will likely be about 3% and stall near the upper BLUE wedge resistance line (near $278). The current price consolidation, over the past 4+ days, is nothing more than temporary resistance before the upside breakout to complete the “iii-c” price peak.
Ultimately, as we suggested in our earlier research post Elliott Wave Prediction for US Stocks, the final Elliot wave analysis of this rotation may take many more months to conclude with any degree of accuracy.
The point of this article is that this Ending Diagonal pattern is common near the end of wave 3 and near the beginning of wave 5 – yes, we understand this point. Yet, our question remains “is this the end of a 5-leg sub wave 3” or “the end of a major 5 leg (ultimate peak)” formation? Our belief is that the answer is this is the end of an “extended wave C” that will likely result in much higher price activity over the next few months/years.

There is one key to understanding our analysis and our future expectations – recent price lows in the SPY must not be breached for our analysis to remain valid. These recent low-price levels are $254.67 & $252.92. If our analysis is incorrect, these low-price levels will be the first levels to be breached on a market price reversal. If our analysis is correct, price will never come near these levels and will continue to accelerate higher as a new wave 5 is created. If we are correct, there will be a lot of short sellers that get caught in this failed analysis and this move could be explosive and trigger that signature blow off/capitulation topping spike in price that ends most bull markets.
If you like our work, want our trade alerts, and want to support our efforts, please visit www.TheTechnicalTraders.com to learn how we can help you stay ahead of the markets. We live for this type of work, research and helping our members find profits in the markets. We believe our research is top-tier and we know we provide value to our loyal members.


