EURUSD is moving upwards. Possibly, today the price may reach 1.1708. After that, the instrument may fall towards 1.1616 and then grow to reach 1.1662, thus forming another consolidation range. If later the pair breaks this range to the downside, the market may resume falling inside the downtrend with the target at 1.1500; if to the upside (an alternative scenario) – continue the correction towards 1.1750.
GBPUSD, “Great Britain Pound vs US Dollar”
GBPUSD is also moving upwards. Possibly, the price may reach 1.3399. Later, the market may fall towards 1.3189 and then grow to reach 1.3290, thus forming another consolidation range. If later the pair breaks this range to the upside, the market may start another correction towards 1.3535; if to the downside – resume falling inside the downtrend with the target at 1.3077.
USDCHF, “US Dollar vs Swiss Franc”
USDCHF is moving downwards. Today, the price may reach 0.9815. After that, the instrument may form a new ascending structure towards 0.9960 and then continue trading to the downside with the target at.0.9890.
USDJPY, “US Dollar vs Japanese Yen”
USDJPY is consolidating. If later the pair breaks this range to the upside, the market may reach 100.45; if to the downside – resume falling with the target at 106.25.
AUDUSD, “Australian Dollar vs US Dollar”
AUDUSD is moving upwards. Possibly, today the price may reach the short-term target at 0.7645 and then fall towards 0.7550. Later, the market may form a new ascending structure to reach 0.7676 and then continue trading to the downside towards 0.7400.
USDRUB, “US Dollar vs Russian Ruble”
USDRUB is still falling towards 61.82. After that, the instrument may start another growth towards 62.37 and then continue trading to the downside with the target at 60.40.
XAUUSD, “Gold vs US Dollar”
Gold is moving downwards. Today, the price may reach 1288.00 and then start another growth towards 1298.00. Later, the market may resume trading to the downside with the target at 1280.00.
BRENT
Brent is moving downwards as well. Possibly, today the price may reach 75.90 and then start another growth towards 76.90. After that, the instrument may form a new descending wave with the target at 74.60.
Attention! Forecasts presented in this section only reflect the author’s private opinion and should not be considered as guidance for trading. RoboForex LP bears no responsibility for trading results based on trading recommendations described in these analytical reviews.
On Friday the 1st of June, trading on the EURUSD pair closed down. Volatility was high during the US session after the publication of statistics from the US jobs market. This resulted in a decline for the euro to 1.1617.
The US labour market exceeded market expectations in May. New jobs added and average hourly earnings came out higher than predicted, while unemployment was lower than expected. This strengthened expectations among traders of the US Fed raising interest rates this June. The dollar gained some ground on this news along with US10Y bond yields.
The nonfarm payrolls report has a strong but short-lived effect on the USD exchange rate. From its low of 1.1617, the euro recovered to 1.1680.
Day’s news (GMT+3):
11:30 UK: PMI construction (May).
11:30 Eurozone: Sentix investor confidence (Jun).
12:00 Eurozone: PPI (Apr).
17:00 USA: factory orders (Apr).
Fig 1. EURUSD hourly chart. Source: TradingView
Today (Monday the 4th of June), the euro has strengthened its position against the greenback. The rate has risen by 0.34% to reach 1.1696. On the technical side, there’s nothing to stop the euro from breaking the support zone of 1.1706 – 1.1716. Given that the stochastic is in the sell zone; before it rises, I expect to see the rate drop to the trend line at 1.1600 before rebounding to around 1.1700.
Today is Monday and the economic calendar is pretty much empty. Since leaving a long shadow on the 17:00 candlestick on the hourly timeframe, the scales have tipped in favour of the bulls. I’d like for trading this Monday to be relatively calm and for the rate to remain within a range of 1.1645 – 1.1725 up until trading opens in Europe on Tuesday. If everything goes as planned today, then tomorrow I’ll consider a session rally to 1.1795 for the euro.
After imposing tariffs on steel and aluminum imports on its closest allies, the U.S. will be facing enormous criticism at the G7 summit on Friday in Quebec or, as the French Finance Minister Bruno Le Maire likes to call it, “G6 plus one.”
“When you’re almost 800 Billion Dollars a year down on Trade, you can’t lose a Trade War! The U.S. has been ripped off by other countries for years on Trade, time to get smart!” Donald Trump
Whether President Trump is playing a smart strategic game or is seriously considering getting into a trade war remains unknown, but the probability of a full-blown trade war has undoubtedly increased significantly.
The summit is due to take place after the U.S. and China trade negotiations ended on Sunday without any significant progress made. In fact, China warned the U.S. that any move to implement tariffs on Chinese products would ruin the negotiations.
Although markets in Asia are rallying after the U.S employment report released on Friday showed a robust surge in numbers and new elections were avoided in Italy, this optimism will soon disappear if the Trump administration pulls the trigger on the threatened tariffs on $50bn worth of Chinese exports. So, keep a close eye on Trump’s Twitter account for updates.
Europe’s Politics and data to be in focus
The Euro struggled last week, with Italian and Spanish political turmoil sending the single currency to its lowest level since July 2017. The compromise reached between the Italian President and the populist coalition prevented further losses as a new election seems to be off the cards for now. This relief was reflected in Italian bonds where 2-year yields fell 200 basis points from Tuesday’s high. However, the Euro’s recovery may be short-lived if the new Italian government moves ahead with its proposed massive spending agenda and tax reductions. These actions will not only create conflict with Brussels but will also invite credit rating agencies to cut their debt ratings.
On the data front, the Eurozone Services PMI is likely to confirm that the economy continued to slow down as it entered Q2. Another round of negative economic releases will lead the ECB to postpone ending QE and thus drag the Euro further. The UK services PMI, Germany’s industrial production and factory orders will also be in focus this week.
Disclaimer: The content in this article comprises personal opinions and should not be construed as containing personal and/or other investment advice and/or an offer of and/or solicitation for any transactions in financial instruments and/or a guarantee and/or prediction of future performance. ForexTime (FXTM), its affiliates, agents, directors, officers or employees do not guarantee the accuracy, validity, timeliness or completeness, of any information or data made available and assume no liability as to any loss arising from any investment based on the same.
The U.S. dollar was seen easing back towards Friday’s close after a solid performance during the week. The monthly payroll figures showed that the U.S. economy added 223,000 jobs during the month of May, beating estimates by a strong margin.
The U.S. unemployment rate also fell to an 18 year low to 3.8% while the median forecasts expected to see the unemployment rate staying unchanged at 3.9%. Wage growth also increased 2.7% on an annual basis for the year ending May.
Elsewhere, the monthly manufacturing PMI in the UK showed an increase to 54.4. This was higher than the estimates of 53.5 and up from the previous month’s 53.9 but below April’s 55.1.
Looking ahead, the economic calendar for the day will see the release of the UK’s construction PMI. Forecasts show that construction PMI might have eased to 52.0 from 52.5 in April.
In the U.S. the factory orders data will be coming out. Forecasts point to a 0.4% decline.
Looking to develop your own Technical Analysis skills? Register now for our free Top MT4 Indicators webinar to enhance your strategy!
EURUSD intra-day analysis
EURUSD (1.1693): The euro currency was seen easing back on Friday after two days of gains earlier in the week. The common currency managed to hold its ground against a stronger U.S. dollar. The minor decline on Friday coincides with the falling price channel which is currently serving as dynamic resistance. In the near term, we expect the EURUSD to retest the support level at 1.1610 – 1.1577 level. A rebound off this level could signal the EURUSD to maintain the sideways range with the upper resistance at 1.1730. A breakout from this range could potentially set the stage for the next leg in the currency pair’s direction.
USDJPY intra-day analysis
USDJPY (109.60): The USDJPY posted strong gains on Friday but price action was seen easing back towards the close. The USDJPY managed to post the rally and hit the resistance zone of 109.57 – 109.43 level. We expect to see the USDJPY currency pair pulling back lower and could settle into the range with the lower support at 108.90. However, in the event of a breakout, then USDJPY could be seen extending the gains to the upside, targeting the next main resistance level at 110.85.
XAUUSD intra-day analysis
XAUUSD (1293.58): Gold prices slipped after failing to break out above the resistance level of 1304 – 1301 level. The decline in gold prices is likely to see the precious metal continuing to maintain the downside bias with the gains capped at the 1304 – 1301 level of resistance. To the downside, the support at 1282 is the most likely target as gold prices are likely to test this support level more firmly. Although gold prices look fairly bearish for the moment, we expect to see a bottom taking shape and could signal a near term change in the trend to the upside.
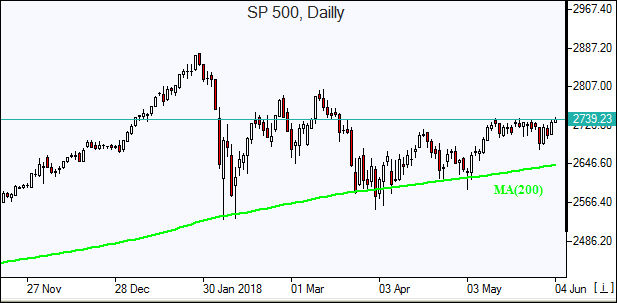
US markets recovered Friday on upbeat May jobs report and economic data. S&P 500 rose 1.1% to 2734.62, ending 0.5% up for the week. Dow Jones industrial average added 0.9% to 24635.21. The Nasdaq jumped 1.5% to 7554.33. The dollar strengthened as the US created 223,000 new jobs in May, above an expected 190,000: the live dollar index data show the ICE US Dollar index, a measure of the dollar’s strength against a basket of six rival currencies, rose 0.3% to 94.196 but is lower currently. Stock index futures indicate higher openings today.
European stocks extend weekly losses
European stock indices ended higher Friday led by Italian and Spanish stocks following ebbing political uncertainty. Theeuro fell against the dollar while the British Pound climbed, and both currencies are rising currently. The Stoxx Europe 600 Index rose 1%, however ending 1.1% lower for the week. The DAX 30 gained 1% to 12724.27. France’s CAC 40 rose 1.2% and UK’s FTSE 100 edged 0.3% higher to 7701.77. Markets opened 0.3% – 0.9% higher today.
Asian markets rising
Asian stock indices are gaining today as strong US nonfarm payroll report bolstered global growth perspectives. Nikkeiended 1.4% higher at 22475.94 helped by continued yen weakness against the dollar. Chinese stocks are gaining against the backgrowud of China’s warning trade agreements are off if tariffs are imposed: the Shanghai Composite Index is up 0.5% while Hong Kong’s Hang Seng Index is 1.5% higher. Australia’s All Ordinaries Index is up 0.6% despite accelerated rise in Australian dollar against the greenback.
Brent futures prices are moving higher today. Prices fell Friday on rising US crude oil output as Baker Hughes reported the number of active US rigs drilling for oil was up 2 at 861 last week. Brent for August settlement lost 1% to close at $76.79 a barrel Friday.
Note: This overview has an informative and tutorial character and is published for free. All the data, included in the overview, are received from public sources, recognized as more or less reliable. Moreover, there is no guarantee that the indicated information is full and precise. Overviews are not updated. The whole information in each overview, including opinion, indicators, charts and anything else, is provided only for familiarization purposes and is not financial advice or а recommendation. The whole text and its any part, as well as the charts cannot be considered as an offer to make a deal with any asset. IFC Markets and its employees under any circumstances are not liable for any action taken by someone else during or after reading the overview.
The USD/CAD has formed a bullish swing but the price is still below the breakout level. We see a retracement at this point and next zone for a potential bounce is 1.2875-1.2890. There is a lot of confluence within the zone including 61.8 fib of the last swing. However, for a bullish continuation a clear break of 1.3028 is needed (or 4h close above) and the doors to 1.3078 will be open. The USD/CAD needs to stay above 1.2825 for bulls to dominate.
W L3 – Weekly Camarilla Pivot (Weekly Interim Support)
W H3 – Weekly Camarilla Pivot (Weekly Interim Resistance)
W H4 – Weekly Camarilla Pivot (Strong Weekly Resistance)
D H4 – Daily Camarilla Pivot (Very Strong Daily Resistance)
D L3 – Daily Camarilla Pivot (Daily Support)
D L4 – Daily H4 Camarilla (Very Strong Daily Support)
POC – Point Of Confluence (The zone where we expect price to react aka entry zone)
This material does not contain and should not be construed as containing investment advice, investment recommendations, an offer of or solicitation for any transactions in financial instruments. Please note that such trading analysis is not a reliable indicator for any current or future performance, as circumstances may change over time. Before making any investment decisions, you should seek advice from independent financial advisors to ensure you understand the risks.
Matthew Gili, CEO of Western Copper, speaks to Maurice Jackson of Proven and Probable about the company’s plans to go into production.
Maurice Jackson: Today we will highlight the next mid-tier production company. I’m speaking of Nevada Copper Corp. (NCU:TSX; NEVDF:OTC.MKTS), North America’s next copper producer. Joining us for a conversation is Matthew Gili, the president and CEO of Nevada Copper.
Matthew, who is Nevada Copper and what is the value proposition you present for investors?
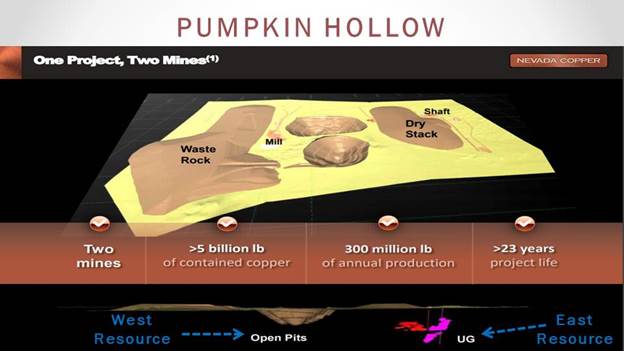
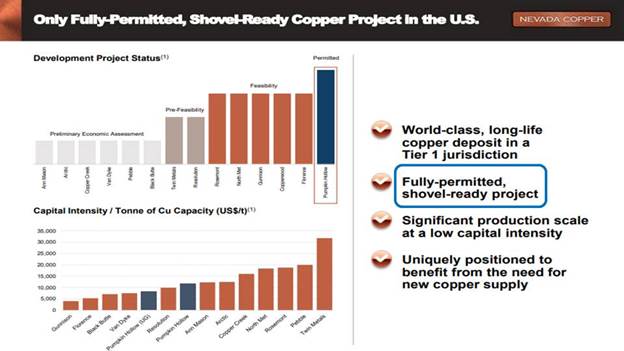
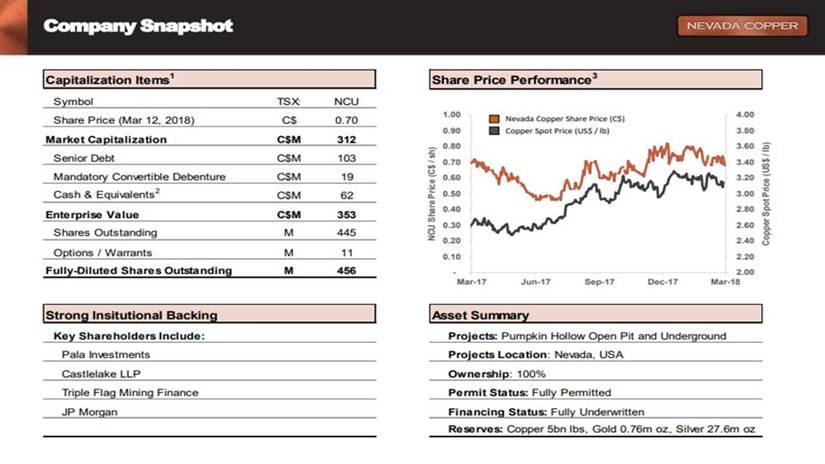
Matthew Gili: Nevada Copper is the owner of Pumpkin Hollow, a 5 billion pound resource of copper in Yerington, Nevada, about 80 miles outside of Reno. There are two projects there, an open pit and and an underground. We are the only major shovel-ready, fully permitted copper project in the U.S. We’re in a tier one mining jurisdiction in a prolific copper district. Yerington historically has been a very large copper producer. We have a lot of blue sky in terms of drilling and potential M & A with the areas around us, and we’ve got strong financial partners to make this project fully financed.
Maurice Jackson: Please provide us with a brief narrative on the background of Nevada Copper.
Matthew Gili: Nevada Copper has been around since about 1999 is when it first was incorporated. It really gained some traction in 2006 and it was focused developing Pumpkin Hollow. That was a time of rising copper prices. It was a time of a lot of excitement for copper and a time when mines were big and projects were big, and the team there did a fantastic job of permitting Pumpkin Hollow. They established a land package of private land. Pumpkin Hollow is entirely on private land, and that required cooperation with the federal government, and the state of Nevada, and the city of Yerington.
They secured that as private land and secured that land package, and were ready to develop this into a major asset. About that time, it got difficult in the copper industry, around 2012 to 2015, and, quite frankly, the team ran out of money. What we’ve done since then is refinance the project. You will see that on press releases, the $375 million refinancing package, and we’re now ready and poised to finish the construction of the underground that was started by the previous team, and then bring on and complete the feasibility studies on the open pit to turn that into a real value making entity.
Maurice Jackson: You alluded to the copper sector here. Why should the market be excited about the copper sector and how does Nevada Copper’s Pumpkin Hollow fit into the narrative?
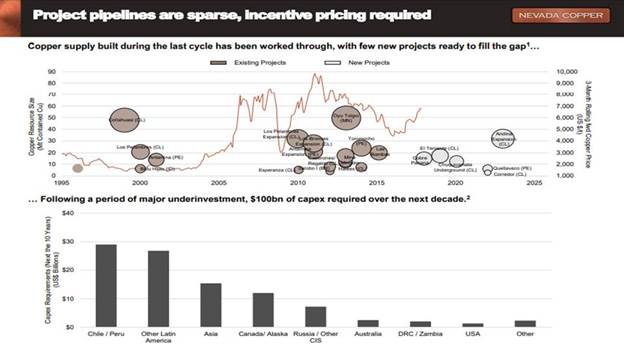
Matthew Gili: Where we see the real growth in copper is in the electrification of the world. Not just electric vehicles, but electricity is a much more efficient way to transfer energy, and you’re seeing that across the world. So if you’ll think about a vehicle, the electrification of a car takes the steel engine block, and transforms that into a copper electric motor, and the transmission of this energy now is not through a pipeline like petroleum, but through electrical conductors, some of which use copper. So that’s really that value proposition we see for copper from the demand side. On the supply side, I just want to stress that there’s been a limited, reduced amount of investment in expanding the copper supply. You’re seeing a lot of permitting issues. You’re seeing a lot of tough jurisdictions to get licenses to operate, and you’re also seeing a lot of existing open pit producers as they wind down, converting over to underground resources that require more capitalization and have a higher operating cost. So, these are the things that we’re seeing that are affecting the supply side of copper, and that’s why we’re so excited as Nevada Copper. We are the only fully permitted property. It takes a lot of time and energy and resources to get permits and to get that license to operate. Nevada Copper has secured that with the stakeholders involved and we are constructing right now.
Maurice Jackson: Walk us through you flagship project, the Pumpkin Hollow. Tell us about the location, metallurgy and scale.
Matthew Gili: Pumpkin Hollow is about 80 miles outside of Reno, Nevada, in a town called Yerington. Historically, Yerington has been a copper producer with a company called Anaconda in the 1950s to the 1970s. Pumpkin Hollow has two mines, an underground we call the East Resource, and an open pit, which we call the West Resource. They’re about four kilometers from each other and so they seem like they’re the same property, but they’re not. They actually are two discrete mines that can be run independently, and we will run them independently. From the standpoint of production, of course, we’ll share infrastructure and those sort of things.
We’re building a 5,000 ton a day underground with its own processing facility on site and the open pit. Right now, we’re in the process of re-engineering. Historically, it had been established a 70,000 ton a day producer and processor of ore. We’re going to re-engineer that and we’re aiming for about half that production rate. But it’s an increase in comparative copper production by increasing the grade. For metallurgy, it’s a very straightforward float copper concentrate with some precious metal credits. It’s exported to a smelter, and so that describes to you the size of Pumpkin Hollow. The underground, we would anticipate producing about 27,000 tons of copper per year in copper concentrate, and the open pit is a number around 100,000 tons per year of copper concentrate.
Maurice Jackson: What are the economics of Pumpkin Hollow?
Matthew Gili: So far $220 million of capital spend has been invested in Pumpkin Hollow by the previous teams that have managed it. We’re looking at a number between $180 to $200 million of initial capital investment between now and the end of 2019 in order to get the Pumpkin Hollow underground up into its full production. Full production will be reached in mid-year 2020, so that’s the capital investment required there.
When we’re in full production, we’ll be generating about $70 million a year of free cash flow from the operation and it’s got about a 13-year mine life. The economics of the open pit are a little different. We’re targeting an open pit of about half the size of the feasibility study originally published in 2015, so that would put it at about 35,000 tons a day with its own processing facility. It’s got about a 16-year mine life, and again, that would produce about 100,000 tons a year of copper in concentrate.
Maurice Jackson: What can you share with us about the production profile and cash generation?
Matthew Gili: The production profile and cash generation of the underground deposit is well defined, and as we’re constructing it now, the production profile will be about 27,000 tons per annum of copper in concentrate, generating a free cash flow of around $70 million a year at our consensus pricing. The open pit, we’re still in the process of re-engineering. We’re targeting an annual production of around 100,000 tons per year of copper in concentrate and still working through the feasibility study on just how does that translate into cash generation.
Maurice Jackson: How big of a concern should it be for speculators regarding infrastructure in capital expenditures?
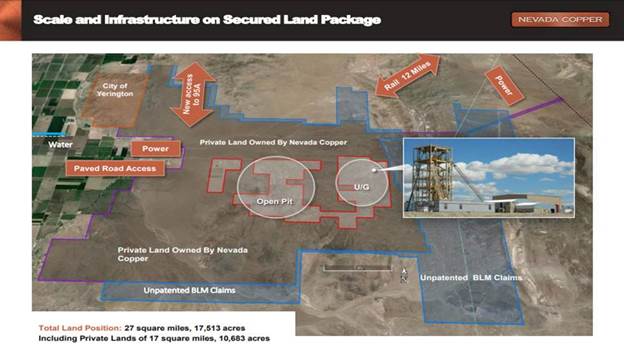
Matthew Gili: From the standpoint of infrastructure, Nevada lends itself to good, efficient infrastructure. There’s a rail spur just outside of the project. We’re on good, high quality paved roads. We were within 10 kilometers of an existing high tension power line and we’ve got our water secured, so from the infrastructure standpoint, we’re in good shape. From the capital standpoint, that’s why our team is in place, a team of proven mine builders that understands how to manage projects and deliver projects on budget and on time, and that’s really our focus of the management team at this point.
Maurice Jackson: Is drilling currently being conducted at Pumpkin Hollow, and if yes, how would you rate the results?
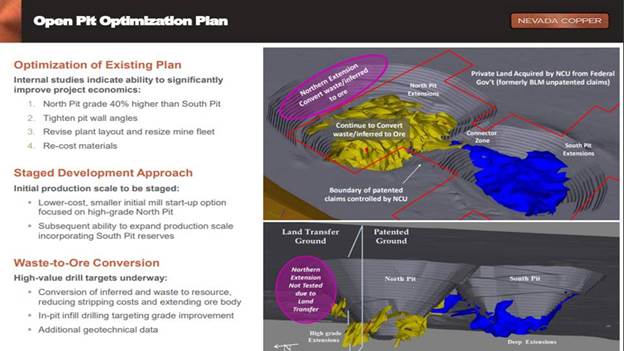
Matthew Gili: We’re very proud of the drilling that’s going on right now at Pumpkin Hollow. If you’re paying attention to our press releases, you’ll see we’ve started to release the results of the drilling on the north pit open pit area, what we call the west area, so we just started to drill that area out. What’s exciting about that for us is that previously, before the land swap, before we tied up all this land as Pumpkin Hollow’s land, that was government land, and so we purposely didn’t drill. We’d always suspect it and our models always showed that there was mineralization of copper to the north of that and now that we own that land, and we’re able to drill on that land, our drilling is showing that indeed there is good quality copper mineralization on the north edge of that pit. What that does is it just adds to the copper production profile for Pumpkin Hollow’s open pit operations.
Maurice Jackson: Is there expansion potential on the Pumpkin Hollow?
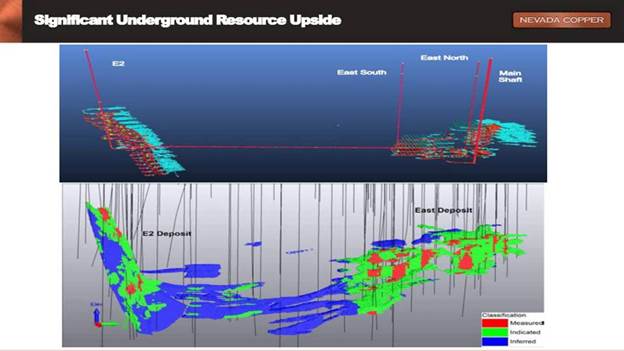
Matthew Gili: There’s absolutely expansion potential on Pumpkin Hollow, both in the underground and the open pit, and again, it is one of the things that has excited me the most about Pumpkin Hollow. We know that there are mineral occurrences underground. We know that there are some resources underground. It’s really inefficient to drill them as deep as they are from the surface, so that’s really going to be one of our first focuses as we finish out the underground, to establish the drill platforms so that we can expand that underground resource model, and convert some of that resource to reserves. So a lot of potential lies between the two sides of the underground, and from the open pit as we talked about previously. There’s that north extension that we know is a high potential area, and our initial drill holes from there are showing that same potential. There’s also some areas that are deeper in the open pit and in between the north and south open pit that also show that same potential, and we’ll continue to pursue those as we go through our exploration program.
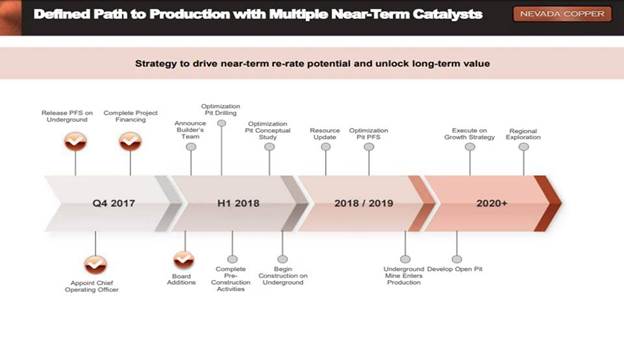
Maurice Jackson: Let’s discuss the defined path to production.
Matthew Gili: Absolutely. So the defined path production for the underground is very clear. We’ve started pre-work construction now. We will be commissioning the underground hoisting system and plant facility in the fourth quarter of 2019 and we’ll be up to a full ramp up at 5,000 tons a day of hoisting and processing about mid-year 2020.
Maurice Jackson: Before we leave Pumpkin Hollow, are there any reversionary interests?
Matthew Gili: Pumpkin Hollow is 100% owned by Nevada Copper. There’s a small royalty holding, but other than that, Nevada Copper completely controls the Pumpkin Hollow deposit.
Maurice Jackson: Are there any redundant assets, such as patent mining claims?
Matthew Gili: No. The land package is completely private ownership and it’s completely under Nevada Copper.
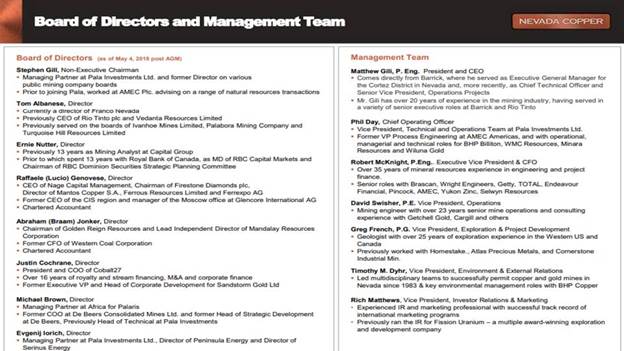
Maurice Jackson: We’ve covered the latent material in the ground. Let’s discuss what I consider the most important aspect, which are the people. Who is on your board of directors, and what makes them qualified for the task at hand?
Matthew Gili: I’m really excited about the board of directors. This is a group of people who have been brought together that really understand how to construct and operate mines. The two newest board members are Tom Albanese and Ernie Nutter. Tom Albanese has had a long, distinguished career with Rio Tinto and certainly is somebody that I have had the privilege of working with for many years in my prior careers. Ernie Nutter brings this huge amount of experience with RBC, and then on the capital markets, is just an icon of the copper and mining industry in Canada. We are very fortunate to have these high quality people on the board of directors.
Maurice Jackson: Tell us about Matthew Gili; what unique skillset does he bring to the table?
Matthew Gili: Matt Gili is a miner and a mine builder. That is how I define myself. I’m a mining engineer and I’ve had the great fortune and opportunity to build and operate mines all across the world, all across North America and Alaska, South Africa, Mongolia and now in Nevada.
Maurice Jackson: Now, share with us, what attracted you to Nevada Copper?
Matthew Gili: Nevada Copper is the right mine in the right place at the right time. It is really a chance for Nevada Copper to show what it’s capable of. It’s fantastic to me to be part of that team that brings this asset on in a time when the industry wants more copper producers, where customers want more copper, and where what they really want is a mine that has been very well thought through, to be an efficient use of capital and a fantastic generation of cash flow and wealth, so it’s a very exciting time for me. I really welcome the chance to be able to shape the very beginning of Pumpkin Hollow.
Maurice Jackson: Should something happen in your absence, who would lead the company?
Matthew Gili: What we do have is a fantastic group of directors who are experienced, as we discussed, and we have a very strong management team from diverse backgrounds, all of whom could step in in my absence. That’s really one of our focuses as we’re bringing together this new team and we’re developing Pumpkin Hollow, and Nevada Copper is to put together those strong succession plans so we are confident in our ability to execute it.
Maurice Jackson: We haven’t addressed the technical team. What can you share with us?
Matthew Gili: Our technical team is led by Phil Day, who’s our chief operating officer, and just a fantastic asset at all kinds of experience across the world in building mines and really brings that whole team together. What he has done is really gelled the rest of the technical team into a very cohesive unit. We’re very pleased with the addition of David Swisher, somebody who has built a lot of mines, but that doesn’t take away from the strong background of people who have been experienced with Nevada Copper for a long time, like Greg French, who is our vice president of exploration and Tim Dyer, who’s our vice president of environmental and external relations. So we’re really fortunate to have a mix of people who have been with the property for a long time and have that institutional knowledge and great experience, and a few new people who bring the new approach, and a new energy into the property.
Maurice Jackson: Let’s get into some numbers here. How much cash and cash equivalence do you have?
Matthew Gili: If you go through the press releases, you’ll hear and see a lot about the refinancing. We completed it right at the beginning of this year. That has really set us up for going forward with the construction of Pumpkin Hollow’s underground. Today, our cash and cash equivalence in the bank, on the balance sheet is about $45 million.
Maurice Jackson: Talk to us about cash flow distribution. Where is this cash being spent?
Matthew Gili: Right now, all of our cash is focused on the construction of the Pumpkin Hollow underground with minor amounts going into the drilling we talked about of the open pit, as well as completing the feasibility study of the open pit. So my mandate is first, construct the underground, but equally importantly commence and bring forward the feasibility study for the open pit.
Maurice Jackson: How much debt do you have?
Matthew Gili: There’s $80 million of debt on the balance sheet today.
Maurice Jackson: What is your burn rate?
Matthew Gili: At full construction, we’ll burn about $12 million per month. If you look at it another way, we have about another $180 to $200 million of project capital to spend between now and the end of 2019 to bring the underground into full production.
Maurice Jackson: Tell us about your share structure.
Matthew Gili: Right now we have 450 million shares outstanding. About 70% of those shares are held by our two major institutional investors.
Maurice Jackson: How did Nevada Copper get into this position?
Matthew Gili: We had the original IPO, and this has really been part of the whole refinancing that occurred at the end of last year. There was the conversion of a lot of debt into additional shares, and so this is really the formation of the new Nevada Copper.
Maurice Jackson: What is the float again?
Matthew Gili: It’d be 30% of our shares are the float if 70% are controlled by institutional investors.
Maurice Jackson: Speaking of your institutional investors, who are they and what is their level of commitment?
Matthew Gili: The largest institutional investor is Pala Investments out of Zug. Our non-executive chairman, Stephen Gill, is a managing partner of Pala Investments, and they take quite an active role right now in managing this asset. Many of our key management team people are from the Pala organization. I have been working with them now for about a month and am extremely pleased and fortunate to be working with such a high caliber group of people. The 20% of the rest of the institutional investment is done through a group called Castle Lake. They’re treating this much differently, more as an investment, less direct impact, less direct involvement, but still very supportive of the project, as you would expect from somebody that owns so many shares.
Maurice Jackson: What are the change of control fees?
Matthew Gili: There are no change of control fees. There’s small change of control fees associated with some of the key staff, but other than that, there’s no change of control fees.
Maurice Jackson: What is the next unanswered question for Nevada Copper? When should we expect results and what determines success?
Matthew Gili: On the underground, it’s not an unanswered question. We know the direction. We know the path and it’s clear, and it’s public. The real next unanswered question at Nevada Copper is going to be the results of the re-engineering of the feasibility study for the open pit. Though we have a fantastic resource there, we know that the previous approach was well thought out for the context of the time, but those times are changed and the industry is looking for more capital efficient ways of producing copper. So we’re going through that study right now. I could tell you that the initial results are very exciting. Through the course of this year, we’re going to be able to produce and publish that feasibility study and then by the end of this year be able to update the reserve statement to reflect that, so that’s really the next exciting unanswered question for Nevada Copper. What does that open pit look like and how does it add shareholder value?
Maurice Jackson: Now, if plan A doesn’t work, what is plan B?
Matthew Gili: So plan A is that we develop the underground and then we transition into the open pit starting probably around the end of 2020. If that doesn’t work, what we’ll do is we can always put the open pit on hold. As I said before, the two mines are mutually exclusive and we purposely have done that so we are able to either bring the open pit forward if the economics were to indicate that it would be advantageous to bring that forward, or we could also delay that if necessary in order to best meet the needs of the shareholders.
Maurice Jackson: In closing, what keeps you up at night that we don’t know about?
Matthew Gili: Okay, so the one thing that keeps me up at night more than anything is the cost escalation that we’re concerned about in the mining industry. You’re seeing a rejuvenation of mining. You’re seeing a rejuvenation of people excited about mining projects, so I get a little worried about cost escalation. The team is managing that very well but I always worry about that. I always say what keeps you up at night is the safety and well-being of the employees of Nevada Copper. Just always knowing that it is our responsibility to ensure everyone goes home safe and healthy every night.
Maurice Jackson: Last question. What did I forget to ask?
Matthew Gili: I would want to stress the regional capacity of Nevada Copper, that Yerington district. So that would be something I would really want to focus on. Yerington historically had been a major copper producer. Where’s the source of that porphyry? Where is the source of all this copper? Can Nevada Copper find that and can Nevada Copper capitalize on that? What really excites me is finding and unlocking the riddle of Yerington and finding that big copper play that really transforms that United States copper industry.
Maurice Jackson: For readers who want to get more information about Nevada Copper, please share the contact details.
Matthew Gili: Please come to our website, nevadacopper.com. It’ll be able to take you through there and show you what we’re doing, introduce you to the management team, the board of directors, and the history of Nevada Copper.
Maurice Jackson: Nevada Copper trades on the TSX symbol NCU, and the OTC symbol, NEVDF. For additional inquiries, contact Richard Matthews. His phone number is 604-683-8992, or you may email [email protected].
And last but not least, please visit our website www.provenandprobable.com where we interview the most respected names in the natural resource space. You may reach us at [email protected].
Matthew Gili of Nevada Copper, thank you for joining us today on Proven and Probable.
Thank you for joining us today on Proven and Probable. Remember to like and subscribe for more conversations with the most respected names in the natural resource space. Check out our website at www.provenandprobable.com. The information presented on Proven and Probable is provided for educational and information purposes only, without any expressed or implied warranty of any kind, including warranties of accuracy, completeness, or fitness for any particular purpose. The information is not intended to be and does not constitute financial, investment, or trading advice, or any other advice. You should not make any financial, investment, or trading decision based on any of the information presented without first undertaking independent due diligence and consultation with a professional broker, or competent financial advisor.
Maurice Jackson is the founder of Proven and Probable, a site that aims to enrich its subscribers through education in precious metals and junior mining companies that will enrich the world.
Want to read more Streetwise Reports articles like this? Sign up for our free e-newsletter, and you’ll learn when new articles have been published. To see a list of recent articles and interviews with industry analysts and commentators, visit our Streetwise Interviews page.
Disclosure: 1) Matthew Gili: I, or members of my immediate household or family, own shares of the following companies mentioned in this article: Western Copper. I personally am, or members of my immediate household or family are, paid by the following companies mentioned in this article: Western Copper. 2) Maurice Jackson: I, or members of my immediate household or family, own shares of the following companies mentioned in this article: Western Copper. I personally am, or members of my immediate household or family are, paid by the following companies mentioned in this article: None. My company has a financial relationship with the following companies mentioned in this article: Western Copper is a sponsor of Proven and Probable. Proven and Probable disclosures are listed below. 3) The following companies mentioned in this article are billboard sponsors of Streetwise Reports: None. Click here for important disclosures about sponsor fees. 4) Statements and opinions expressed are the opinions of the author and not of Streetwise Reports or its officers. The author is wholly responsible for the validity of the statements. The author was not paid by Streetwise Reports for this article. Streetwise Reports was not paid by the author to publish or syndicate this article. The information provided above is for informational purposes only and is not a recommendation to buy or sell any security. Streetwise Reports requires contributing authors to disclose any shareholdings in, or economic relationships with, companies that they write about. Streetwise Reports relies upon the authors to accurately provide this information and Streetwise Reports has no means of verifying its accuracy. 5) This article does not constitute investment advice. Each reader is encouraged to consult with his or her individual financial professional and any action a reader takes as a result of information presented here is his or her own responsibility. By opening this page, each reader accepts and agrees to Streetwise Reports’ terms of use and full legal disclaimer. This article is not a solicitation for investment. Streetwise Reports does not render general or specific investment advice and the information on Streetwise Reports should not be considered a recommendation to buy or sell any security. Streetwise Reports does not endorse or recommend the business, products, services or securities of any company mentioned on Streetwise Reports. 6) From time to time, Streetwise Reports LLC and its directors, officers, employees or members of their families, as well as persons interviewed for articles and interviews on the site, may have a long or short position in securities mentioned. Directors, officers, employees or members of their immediate families are prohibited from making purchases and/or sales of those securities in the open market or otherwise from the time of the interview or the decision to write an article, until one week after the publication of the interview or article.
Images provided by the author.
Proven and Probable LLC receives financial compensation from its sponsors. The compensation is used is to fund both sponsor-specific activities and general report activities, website, and general and administrative costs. Sponsor-specific activities may include aggregating content and publishing that content on the Proven and Probable website, creating and maintaining company landing pages, interviewing key management, posting a banner/billboard, and/or issuing press releases. The fees also cover the costs for Proven and Probable to publish sector-specific information on our site, and also to create content by interviewing experts in the sector. Monthly sponsorship fees range from $1,000 to $4,000 per month. Proven and Probable LLC does accept stock for payment of sponsorship fees. Sponsor pages may be considered advertising for the purposes of 18 U.S.C. 1734.
The Information presented in Proven and Probable is provided for educational and informational purposes only, without any express or implied warranty of any kind, including warranties of accuracy, completeness, or fitness for any particular purpose. The Information contained in or provided from or through this forum is not intended to be and does not constitute financial advice, investment advice, trading advice or any other advice. The Information on this forum and provided from or through this forum is general in nature and is not specific to you the User or anyone else. You should not make any decision, financial, investments, trading or otherwise, based on any of the information presented on this forum without undertaking independent due diligence and consultation with a professional broker or competent financial advisor. You understand that you are using any and all Information available on or through this forum at your own risk.
This week – June 3 through June 9 – central banks from 8 countries or jurisdictions are scheduled to decide on monetary policy: Kazakhstan, Australia, Moldova, India, Poland, Serbia, Turkey and Peru.
Following table includes the name of the country, the date of the next policy decision, the current policy rate, the result of the last policy decision, the change in the policy rate year to date, the rate one year ago, and the country’s MSCI classification.
The table is updated when the latest decisions are announced and can always accessed by clicking on This Week.
After months of trade war with China, US subjected its EU and NAFTA partners to steel and aluminum tariffs. EU leaders missed a year seeking appeasement with Trump’s protectionism. It’s time to defend the multilateral trading regime.
Unsurprisingly, the European Union (EU), Canada and Mexico have lambasted the US steel and aluminum tariffs. European Commission (EC) President Jean-Claude Juncker criticized Trump’s tariffs and pledged retaliation in due time. French President Emmanuel Macron and German government spokesman called the move unlawful. In Britain, the Brexit proponents and opposition quickly blamed each other for the tariffs. Canadian Prime Minister Justin Trudeau said the tariffs would “harm industries and workers on both sides of the Canada-US border.”
However, when President Trump initiated steel and aluminum tariffs against China months ago, the EU leaders and the NAFTA partners struggled separately for temporary or permanent bilateral exemptions leaving Beijing alone to defend the international multilateral rules they now say have been violated.
It is time to walk the talk and defend the multilateral international trading regime.
The rise and erosion of NAFTA
For months, Canada and Mexico have been hedging their bets against a potential collapse of the North American Free Trade Agreement by pushing for deals with new partners, particularly with China and other Asian countries.
NAFTA is America’s post-Cold War blueprint for other free traded agreements (FTAs). It came into force amid the globalization boom in 1994. While it was initially promoted as a receipt for regional success in the US, Canada, and Mexico, its record has proved mixed. The agreement has benefited consumers in the three countries, but also contributed to investment outflows, unemployment and offshoring.
In relative terms, US is more important to Canada and Mexico as an export destination and source of foreign investment than vice versa. So the outcome of the NAFTA talks is far more important to Canada and Mexico than to the US.
If the US withdraws from NAFTA, that would start a six-month legal process before official termination. While the Trump administration has seen this as a negotiating tool to force Canada and Mexico to accept its demands, the latter have used the time to complete trade talks with Brazil and the EU.
Canada and Mexico are hedging their bets against a potential NAFTA collapse by pushing for deals with new partners, particularly with China and some other Asian countries. Ironically, Trump’s tariff war against its EU and NAFTA partners is solidifying European, Mexican and Canadian trade ties with China.
Trump’s tariffs continue to pour oil on the simmering fire. In Mexico, US protectionism has further solidified the impressive lead of the popular center-left presidential candidate Andres Manuel Lopez Obrador, who is now supported by more than 53 percent of voters. In Canada, Trump’s aggressive tariffs could undermine Trudeau’s fragile lead in the impending 2019 elections.
The rise and demise of TTIP
Not so long ago, optimists still saw the Transatlantic Trade and Investment Partnership (TTIP) as a “done deal.” The US-EU free trade agreement (FTA) talks were announced in February 2013. The two account for nearly half of world gross domestic product and 30 percent of global trade, and have investments of more than $3.7 trillion in each other’s economies.
The TTIP aimed to enhance market access through the elimination of barriers to trade and investment in goods, services, and agriculture. But it was also expected to serve a number of strategic, including geopolitical US policy goals. Yet, potential controversial issues soon surfaced, including differing views to regulations and standards, financial services, labor and the environment, and digital trade. Moreover, differing approaches to data privacy and the diplomatic fallout from the Snowden case complicated the talks.
For all practical purposes, the steel and aluminum the tariff debacle was ignited already in April 2017, when President Trump issued a presidential memorandum directing US Commerce Secretary Wilbur Ross to investigate the effects of steel imports on national security on the basis of the Trade Expansion Act of 1962. It was a shrewd way to exploit an old Kennedy-era Act, which initially was created to expand trade and not for trade shrinkage.
If Ross would determine – as he did in early 2018 – that steel “is being imported into the US in such quantities or under such circumstances as to threaten to impair national security”, Trump would be authorized to take action – as he did in early 2018 – “to adjust the imports of the article and its derivatives so that such imports will not threaten to impair national security”.
As steel imports were termed an issue of “national security”, even US Defense Secretary James Mattis was dragged into the debacle. By mid-June 2017, Europe’s NATO leaders joined in as well. They launched an extraordinary lobbying campaign against the anticipated US crackdown on steel imports, which, they argued, would hit US allies more than China.
Last March, Trump signaled he was willing to reopen negotiations with the EU over the TTIP agreement. As Commerce Secretary Wilbur Ross put it, Trump “terminated the trans-Pacific deal; he didn’t terminate TTIP.” So the EU, in exchange for the permanent exemption, offered to talk about improving reciprocal market access for the US for industrial products, cars, public procurement, and energy. But Trump wanted far more – an America-First deal.
Time to defend the multilateral trading regime
“We will now trigger a dispute settlement case at the WTO, since these US measures clearly go against agreed international rules,” EU trade commissioner Cecilia Malmstroem said recently. However, Washington’s purposeful blocking of appointments to fill the empty seats in the WTO’s appellate body, tasked with managing disagreements between trading nations, could slow settlement talks.
Furthermore, precious time has been lost. The values and interests that once united the transatlantic partners are diverging. Consequently, efforts to simply buy time and appease trade aggression are a dead end.
What is really needed is a broad front of major advanced economies and large emerging economies against illicit tariff wars.
The multilateral international trading regime was not born automatically. It was preceded by two world wars, Great Depression and a series of genocides.
Nor can a multilateral trading regime be sustained without decisive international cooperation.
About the Author:
Dr Dan Steinbock is an internationally recognized strategist of the multipolar world.and the founder of Difference Group. He has served at the India, China and America Institute (USA) , the Shanghai Institutes for International Studies (China) and the EU Center (Singapore). For more, see http://www.differencegroup.net/
The commentary is based on Dr Steinbock’s recent keynote on the global trading regime and the new tariff wars.
Last week was a roller-coaster ride for traders and investors. After a long holiday weekend, traders were greeted with concerns originating in Italy regarding political stability and the potential that any further issues could result in a collapse of the EU. Even though the risk of this happening was somewhat minor, the US markets tanked near 2% as fear seemed to override common sense. The rest of this week has been a wild ride of price rotation within a range. We’ve been reading all types of news and comments regarding all types of “what if” scenarios from analysts and researchers while scratching our heads at some of the comments.
As we stated in our earlier article regarding the Italy political crisis, the one important aspect to trading and investing is to not lose focus on the true perspective and true market fundamentals. Yes, if you are an intraday trader, these wild price swings can either be great profits or wild losses as you try to swing with these rotational moves. As a swing traders/investor, though, we care about the overall stability and direction of the markets. We are willing to ride out some rotation as long as our core analysis is sound and the technical and fundamental basis of our trades is still in place.
In our opinion, there are three things that are core elements of our analysis at the moment and these three things are likely driving the economic future of the US equity markets.
The US Dollar continues to strengthen as the US economy shows solid signs of a broad-based economic increase.
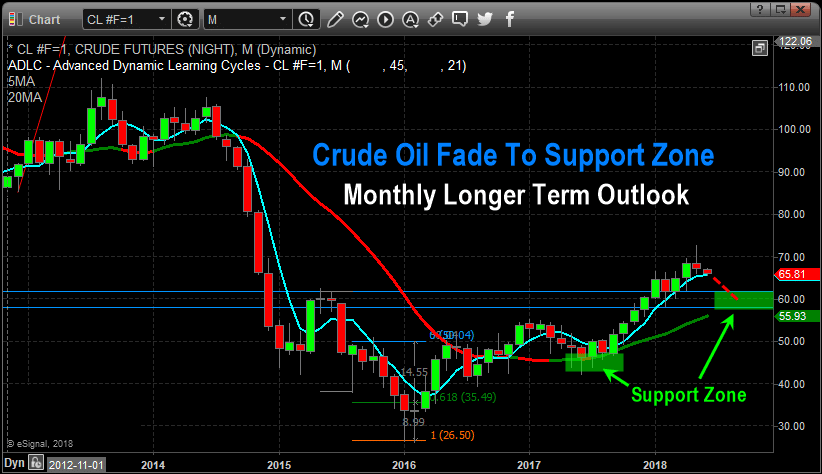
Oil/Energy prices have continued to decline recently, now down nearly 10% from the recent peak, and this decrease relates to supply and demand expectations throughout the end of this year (roughly 4~6 months into the future).
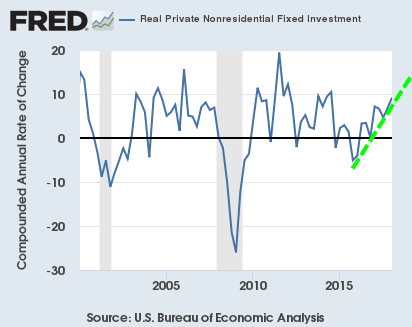
The Transportation Index is pushing higher as stronger economic activity is expected throughout the rest of 2018 and into 2019.
THESE THREE KEY ELEMENTS CROSS-POPULATE AS FOLLOWS:
The strong US dollar is acting like a magnet for foreign capital investment as the strength of the US dollar in combination with the strength of the US economy/equities markets creates a triple-whammy for foreign capital investments. Not only are foreign investors trying to avoid capital devaluation (currency price devaluation) and debt risks in their own local markets, they are trying to find ways to achieve ROI and stability for their capital investments. With almost nowhere else to go, the US equities markets and debt markets are pretty much the only place on the planet for this triple-whammy opportunity.
The strong US jobs numbers and robust economic activity, in combination with the past capital market stimulus and lowered interest rates, are creating a fuel heavy economic environment in the US not that President Trump’s deregulation and policies have injected the Oxygen needed to create the “economic combustion” that is driving this current growth. Energy prices are moderate and dropping as a result of the shift in technologies attributed to electric and hybrid transportation enterprises. All of this, jobs growth, earning growth, economic growth, moderately low interest rates and a true combusting economy, provides for much greater opportunities for an advancing US equities market.
The US equities markets are rotating higher throughout the global weakness and debt concerns while the Transportation index pushes higher as a sign that US investors expect the US economy to continue to grow. Transportations lead the us equities markets by about 4 to 6 months (on average). Lower oil prices, strong jobs numbers, dynamic opportunities in the US economy and a stronger US dollar drive continued US and foreign investments into the US equities markets and debt markets.
As we have stated in earlier research posts regarding “capital migration”, capital (cash) is always seeking the best environments for stability, growth and opportunity in a continual effort to balance risk vs. reward. Capital is capable of moving across the planet relatively quickly in most cases and is always seeking the best opportunity for ROI and stability while trying to balance unknown risks and devaluation. Right now, the only games in town are the established economies, the US, Canadian and UK markets.
As you can see in the graph below US investments continue to grow as the best risk/reward for capital.
Our opinion is that until something dramatic changes this current global economic environment and risk unknown, capital will continue to rush into the US markets even if the US dollar continues to climb or oil continues to fall. The only thing that can change this equation is the one key factor in understanding risk vs. reward – when does the opportunity for reward outweigh the risk of complete failure by applying capital into any other foreign or non-established market environment? When investors believe the reward of moving capital out of the US equity markets in search of new opportunities or advantageous risk/reward setups in foreign markets exists, that is when we’ll see a change in investment dynamics resulting in more downside pricing pressure in the US markets – and we don’t believe that will happen within the immediate 4~6+ month span.
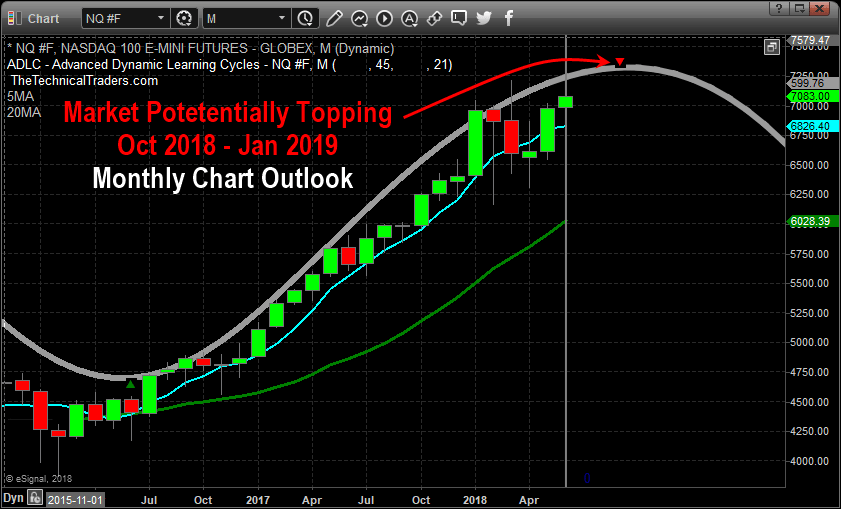
Pay attention to our most recent research as we have been dead-on in terms of calling these market swings. The NQ chart, below, shows how the tech heavy NASDAQ is leading the breakout while the YM and ES markets lag a bit. We believe all of these US majors are in the process of breaking to new all-time price highs and as the foreign market turmoil slowly unfolds, we may see some moderate price rotation. Yet we believe the global economic dynamics that are currently in place create a very opportunistic, rich, green opportunity for continued capital infusion into the US equity markets and a continued moderate advance of the US Dollar.
Remember, there is now over $12 trillion in capital that has been created and introduced into the global markets over the past 10+ years. All of this capital is searching for projects and investments to develop suitable ROI and gains. Where do you think this capital is going to go for the most stable, most capable and most successful ROI available on the planet? Think about that for a minute – where else would you consider putting capital to invest for safe and consistent returns right now?
This weekend could prompt a massive upside price breakout early next week on continued positive economic news or lack of any foreign market concerns. The bias of the US equity market is, and has been, bullish – just as we have been telling our members. If you have been fooled by this recent price rotation or other research posts, please consider TechnicalTraders Ltd. services to learn how we can help you profit from these moves.
We know you value our research and hard work trying to keep you ahead of these market turns and swings. Please consider joining our other loyal members where you’ll receive exclusive updates, video content, trading signals and access to our proprietary price modeling systems and proprietary research reports. Our proprietary research is already showing us where this market should be trading well into July 2019. If you value our research, analysis and detailed reporting like this article, then please visit www.TheTechnicalTraders.com to learn how you can join our other members and begin receiving our exclusive research and more.