An explorer just released a PEA for its project in Peru.
Great Panther Silver Limited (GPR:TSX; GPL:NYSE.MKT) has reported positive results for a Preliminary Economic Assessment (PEA) at the Coricancha gold-silver-lead-zinc-copper underground mine and mill complex. This site is located about 90 kilometers east of Lima, Peru.
“We are very pleased with the results of the Coricancha PEA as it confirms the potential for average annual production of three million silver-equivalent ounces and estimates an after-tax internal rate of return in excess of 80%, with low capital costs, explained James Bannantine, president and CEO.
The PEA entailed an in-depth review of a number of development facets like ore and waste handling, environmental and social aspects, underground development and mining methodologies, and so forth.
Infrastructure already in place at this site is a crushing and grinding plant, flotation and bio-oxidation plant, electrical and water supply, and existing mine access.
In order to de-risk the project, Great Panther will begin a trial stope and bulk sample program. By early 2019, the company expects to be able to make a decision about re-starting Coricancha.
A restart could be funded entirely from the companys cash reserves with a fairly small initial capital investment. The company can leverage its experience and expertise in working with underground, narrow vein mines on Coricancha.
Want to read more Gold Report articles like this? Sign up for our free e-newsletter, and you’ll learn when new articles have been published. To see a list of recent articles and interviews with industry analysts and commentators, visit our Streetwise Interviews page.
Disclosure: 1) Jake Richardson compiled this article for Streetwise Reports LLC and provides services to Streetwise reports as an independent contractor. He or members of his household own securities of the following companies mentioned in the article: None. He or members of his household are paid by the following companies mentioned in this article: None. 2) The following companies mentioned in this article are billboard sponsors of Streetwise Reports: Great Panther Silver Ltd. Streetwise Reports does not accept stock in exchange for its services. Click here for important disclosures about sponsor fees. 3) Comments and opinions expressed are those of the specific experts and not of Streetwise Reports or its officers. The information provided above is for informational purposes only and is not a recommendation to buy or sell any security. 4) The article does not constitute investment advice. Each reader is encouraged to consult with his or her individual financial professional and any action a reader takes as a result of information presented here is his or her own responsibility. By opening this page, each reader accepts and agrees to Streetwise Reports’ terms of use and full legal disclaimer. This article is not a solicitation for investment. Streetwise Reports does not render general or specific investment advice and the information on Streetwise Reports should not be considered a recommendation to buy or sell any security. Streetwise Reports does not endorse or recommend the business, products, services or securities of any company mentioned on Streetwise Reports. 5) From time to time, Streetwise Reports LLC and its directors, officers, employees or members of their families, as well as persons interviewed for articles and interviews on the site, may have a long or short position in securities mentioned. Directors, officers, employees or members of their immediate families are prohibited from making purchases and/or sales of those securities in the open market or otherwise from the time of the interview or the decision to write an article, until one week after the publication of the interview or article.
It’s both alarming and somewhat frightening how global equity markets have powered higher despite the simmering trade tensions between the United States and its allies.
While an incredible rally in technology shares has supported global stocks, there is a suspicion that investor complacency towards the renewed trade tensions continues to play a key role. Although stock markets have scope to venture higher amid the apparent appetite for risk, the question is – for how long? It must be kept in mind that President Trump’s trade wars remain a major threat to financial markets and this is likely to continue weighing on sentiment. With Trump’s unpredictability fostering a sense of uncertainty over trade developments, stock markets remain vulnerable to losses.
Sterling boosted by positive services data
The British Pound appreciated against the Dollar after UK services accelerated in May, easing some concerns over the health of the UK economy.
The Purchasing Manager’s Index for UK services exceeded expectations in May by rising to 54.0 from April’s 52.8. While the recovery in services is encouraging and may stimulate expectations of a BoE rate hike later this year, Brexit-related uncertainties continue to weigh on sentiment.
Taking a look at the technical picture, the GBPUSD remains bearish on the daily charts despite the recent rebound. The upside momentum could send prices towards 1.3450 before the bearish trend resumes. Alternatively, a breakdown below 1.3300 could encourage a decline towards 1.3210.
Dollar waits for ISM Non-Manufacturing PMI
The Dollar held steady during Tuesday’s trading session as investors awaited the US ISM Non-Manufacturing PMI figures for May which could provide fresh insight into the health of the US economy.
Markets expect the ISM Non-Manufacturing PMI index to rise 58.00 in May, which could boost optimism over the US economy being on a track for a solid second quarter. The Dollar is likely to receive a boost if the data exceeds market expectations.
Focusing on the technical picture, the Dollar Index remains bullish on the daily charts. Prices have scope to attack 95.00 as long as bulls can defend 94.00. Alternatively, sustained weakness below 94.00 could invite a decline towards 93.40.
Rand tumbles on disappointing GDP data
Buying sentiment towards the South African Rand sharply deteriorated following reports of the South African economy suffering its worst quarterly growth in almost a decade.
The economy shocked markets by shrinking 2.2% on an annualized basis during the first quarter of 2018. This was a complete turnaround to the positive end of 2017 where final quarter growth rose 3.1%. With the GDP report heavily disappointing, sentiment towards the South African economy is likely to receive a heavy blow with the Rand on the receiving end.
Could the abysmal GDP reading be attributed to the weakening of the “Ramaphosa effect” that was noticed when Cyril Ramaphosa became the President of South Africa? This is the question everyone is asking.
Focusing on foreign exchange, the USDZAR has jumped towards 12.700 as of writing and has scope to challenge 12.750 if the Rand continues to depreciate.
Disclaimer: The content in this article comprises personal opinions and should not be construed as containing personal and/or other investment advice and/or an offer of and/or solicitation for any transactions in financial instruments and/or a guarantee and/or prediction of future performance. ForexTime (FXTM), its affiliates, agents, directors, officers or employees do not guarantee the accuracy, validity, timeliness or completeness, of any information or data made available and assume no liability as to any loss arising from any investment based on the same.
By CentralBankNews.info Residential property prices in advanced economies have recovered the pummeling they took in the Global Financial Crises (GFC) while property prices in emerging market economies are 16 percent above the levels seen before 2008, the Bank for International Settlements (BIS) said. Overall, global residential property prices – adjusted for inflation and based on national averages – rose by 2 percent from the end of 2016 to end-2017 to be 7 percent over the the level achieved before the GFC, BIS said in its latest, abbreviated quarterly review. In advanced economies property in 2017 prices grew 3 percent in real terms, with the rise particularly marked in Canada, Germany, Ireland and Spain while they fell slightly in Italy. In emerging markets property prices only rose 1 percent in real terms last year, and decelerated significantly in China and India while they fell markedly in Brazil and Russia. But taking a longer-term perspective, BIS said property prices had continued to recover slowly after the global financial crises and in advanced economies they had risen continuously since 2012. In some countries real prices are still significantly below 2007 levels, including those in the euro area, the United Kingdom and the United States. Mainly due to a sharp expansion in the early 2010s, real residential property prices in emerging economies are 16 percent up from 2007, with prices almost doubling in India, close to 50 percent higher in Brazil and above pre-crises levels in China, Mexico and Turkey. But prices in Russia have fallen by more than 50 percent compared with 2007 and are below pre-crises levels in Indonesia and South Africa. During the GFC policy makers discovered a serious lack of timely data on the build-up of risk in the financial sector and thus the ability to understand and prevent financial crises. The Group of 20 leading economies launched a major initiative to erase this glaring gap in the understanding of how the financial sector affects the real economy, including its cross-border linkages, the role of complex off-balance sheet entities along with its exposure to real estate. Since 2015 BIS has been publishing residential and commercial property prices for 60 countries to deepen the understanding of household debt as a potential source of vulnerability that can lead to banking crises. The June issue of BIS’ respected quarterly review only includes information linked to its vast array of statistics of international banking and financial markets, with commentary and other articles to be included in its Annual Economic Report that will be published on June 24. In addition to its short article on global property prices, the review also includes a feature on the change in the size and structure of the global credit default swap market over the last decade. The feature shows how outstanding amounts have fallen as central clearing has risen and thus reduced counterpart risks, but also that underlying credit risks have shifted toward sovereigns and portfolios of reference securities with better credit ratings.
G7 countries are concerned about the possible restriction of imports of their goods to the US
The G7 summit will be held on June 8 and 9, 2018 in Canada. Earlier, 6 countries from the “Big Seven” expressed concern about the increase in import duties in the US. Is there a possibility for the котировок euro to rise?
If the G7 countries act as a united front against recent US initiatives to raise import duties on goods from the EU and other countries, as well as anti-Iran sanctions, this could weaken the dollar. The EU authorities announced that they are going to take legal measures within the framework of the WTO regarding the restriction of the supply of European goods to the United States. In addition, European countries do not want to refuse to purchase oil from Iran despite US sanctions. Theoretically, disagreements between the “Big Seven” can have impact even on the Fed and slow the rate of the tightening of its monetary policy. An additional positive for the euro is the normalization of the political situation in Italy after the formation of a new government. According to preliminary data, inflation in the Eurozone in May rose to 1.9% in annual terms from 1.2% in April. This is more than expected. The growth in consumer prices increases the likelihood of the ECB rate hike. Now, most market participants believe that this can happen not earlier than next summer. Nevertheless, any assumptions about the tightening of the monetary policy can support the euro.
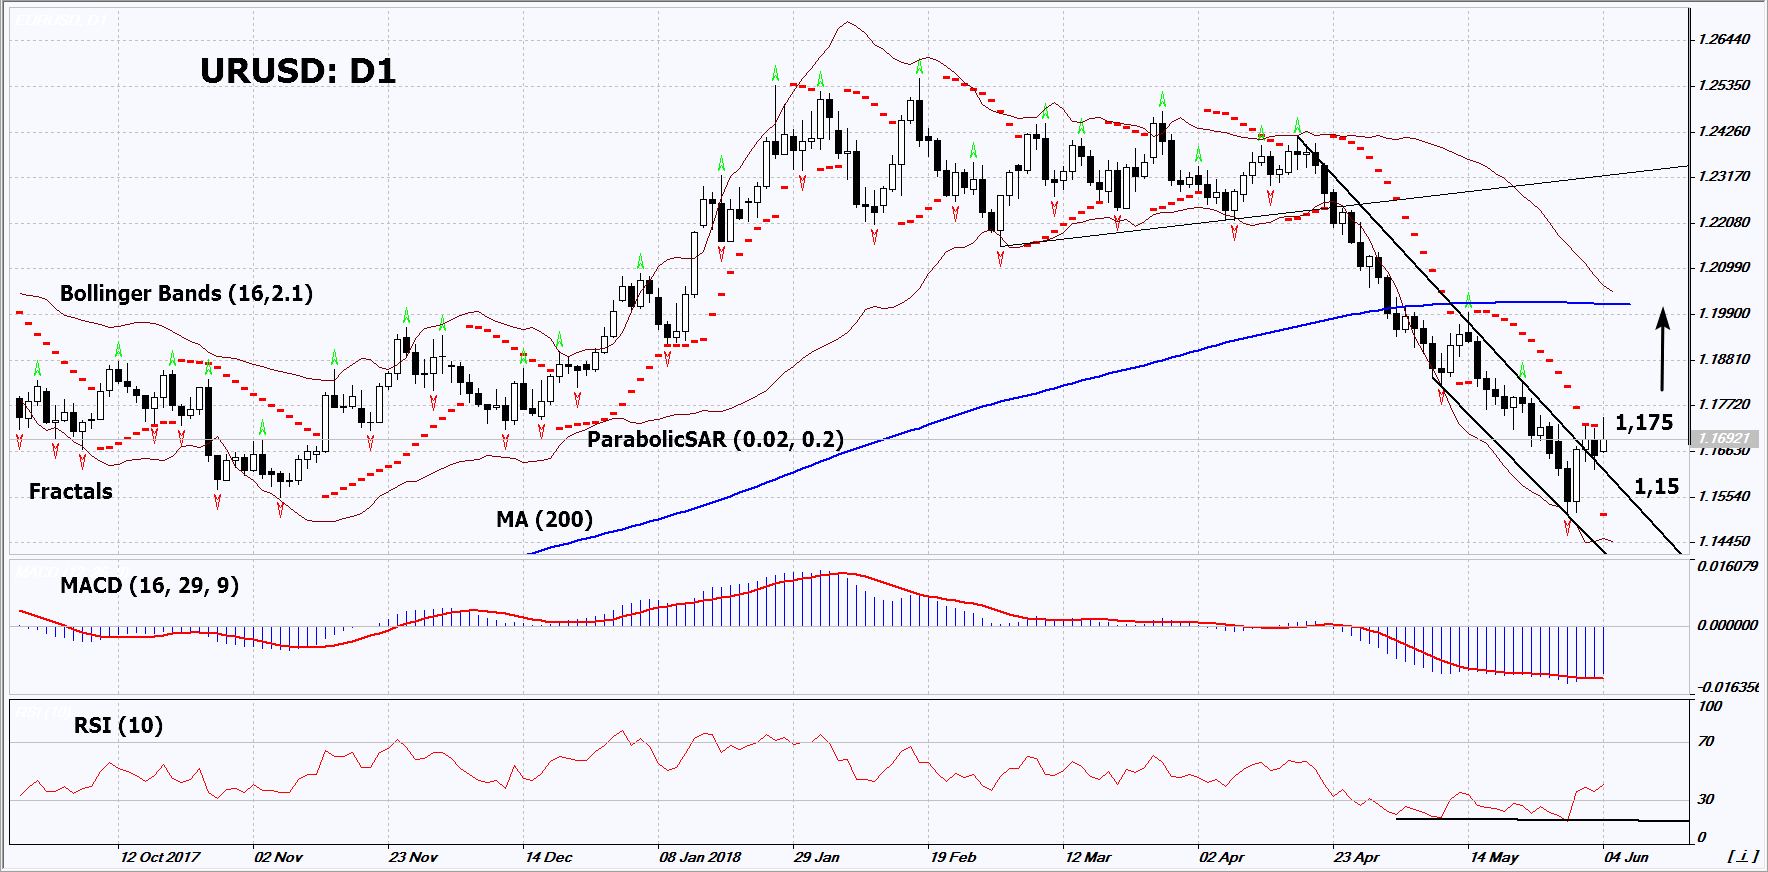
On the daily timeframe, EURUSD: D1 has exited the downtrend. The general downward direction is still preserved, but within its framework, an upward correction is quite possible. A price increase is possible in case of the negative reaction of the G7 countries to US plans to attach them to sanctions against Iran, as well as to limit the import of their goods to the United States. .
The Parabolic indicator gives a bullish signal.
The Bollinger bands have widened, which indicates high volatility.
The RSI indicator is below 50. It has formed a weak, positive divergence.
The bullish momentum may develop in case EURUSD exceeds its last high at 1.175. This level may serve as an entry point. The initial stop loss may be placed below the last fractal low, the 11-month low and the Parabolic signal at 1.15. After opening the pending order, we shall move the stop to the next fractal low following the Bollinger and Parabolic signals. Thus, we are changing the potential profit/loss to the breakeven point. More risk-averse traders may switch to the 4-hour chart after the trade and place there a stop loss moving it in the direction of the trade. If the price meets the stop level at 1.15 without reaching the order at 1.175, we recommend to close the position: the market sustains internal changes that were not taken into account.
For many years, the Isles of Man, Jersey, and Guernsey were popular holiday destinations for Brits looking a bit of sand and sunshine without traveling too far afield from the UK. Those territories were also popular locations for the deposit of offshore funds, which many people kept hidden, out of the watchful eye of the British exchequer. However, all that could be about to change.
In 1789, Benjamin Franklin penned in a letter to Jean-Baptiste Leroy, “Our new Constitution is now established, and has an appearance that promises permanency; but in this world nothing can be said to be certain, except death and taxes.” Nobody has yet come up with a solution to dying, but, in the past, inventive minds have created many a solution to the persistent demands of the tax man.
For decades, the isles of Guernsey and Jersey, located just off the coast of France, and the Isle of Man, situated in the center of the Irish Sea, became tax havens for the rich and famous who would rather not bring their wealth to the English mainland. This tax-haven status was maintained until quite recently when pressure from the UK government resulted in offshore banks on those territories becoming more transparent in their financial reporting. However, as these islands were never actual colonies of the UK, the British government has found it difficult to impose further legislation demanding full disclosure. The territories themselves preferred to maintain a policy of “complicit confidentiality”.
Following legislation proposed by former British Prime Minister, David Cameron, the United Kingdom has built up a campaign against tax avoidance and money laundering. Cameron wanted to close down what he called the financial “getaway cars” for tax dodgers, terrorists, and drug dealers.
In promoting this initiative, the UK became one of the first G20 countries to push for a public registry of company owners. Cameron then set his target on the former dependent territories that Great Britain had colonized in the Caribbean and South Atlantic. However, following Cameron’s rapid exit from British politics following the Brexit vote, this process of financial transparency was put on hold.
Taking up the mantle, Labour MP Margaret Hodge, and Conservative MP Andrew Mitchell proposed an amendment to the UK anti-money-laundering bill to force UK residents with holdings in the Caribbean and Atlantic to fully disclose their assets. These territories included the British Virgin Islands (BVI), Bermuda, and the Cayman Islands, which would have to agree to establish public company records by the end of 202o. The British government supported the bill, largely for technical reasons, but it was turned down in the House of Lords, Britain’s second chamber. However, the bill is likely to pass the vote in a subsequent reading.
The change of sentiment among British legislators follows the negative press surrounding the attempted assassination of a former Russian spy and his daughter in the British city of Salisbury. The harmful media coverage received by Russia and the Russian oligarchs, many of whom made Britain their second home and invested in the country, made financial disclosure a hot topic.
The move to impose financial regulation on former British protectorates has not been popular among the residents of those territories. Dr. Daniel Orland Smith, the premier of the BVI has accused the British government of a “breach of trust”. Smith’s wife, who just happens to run the agency that promotes financial activity on the islands, went further, saying that the British regulatory moves “smacked of colonialism”.
Regulatory liberalization went even further in 2009, when the UK imposed direct rule over former colony, the Turks and Caicos Islands, one of the British Overseas Territories in the Caribbean. Following the disclosure of government corruption, the UK government stepped in and generated a new constitution for the territory that clamped down on overly liberal tax and investment policies that had existed previously.
In spite of recent moves by the UK government to impose financial regulatory transparency on its former colonies, most regulations in those territories are actually better than those in most OECD countries, including the United States. However, with anti-corruption campaigners pushing for even tighter regulation, then further transparency moves are likely.
While anyone who was able to hide their wealth in these former UK province hideaways may have been inconvenienced by these financial transparency moves, there is no question that the general British population supports further regulation. After many years as tax havens for the rich and famous, these territories will now have to rely on their attraction as tourist holiday destinations.
About the Author:
AmramMargalit is a professional writer who has worked in a wide range of settings, including technology companies, nonprofits, and the entertainment industry. Within these positions, Amram has provided quality content and advertising services and is currently the Content Manager at Leverate.
As we can see in the H4 chart, USDCAD is trading between support and resistance levels and forming Hammer and Inverted Hammer reversal patterns. At the moment, it may be assumed that the instrument may resume trading to the downside.
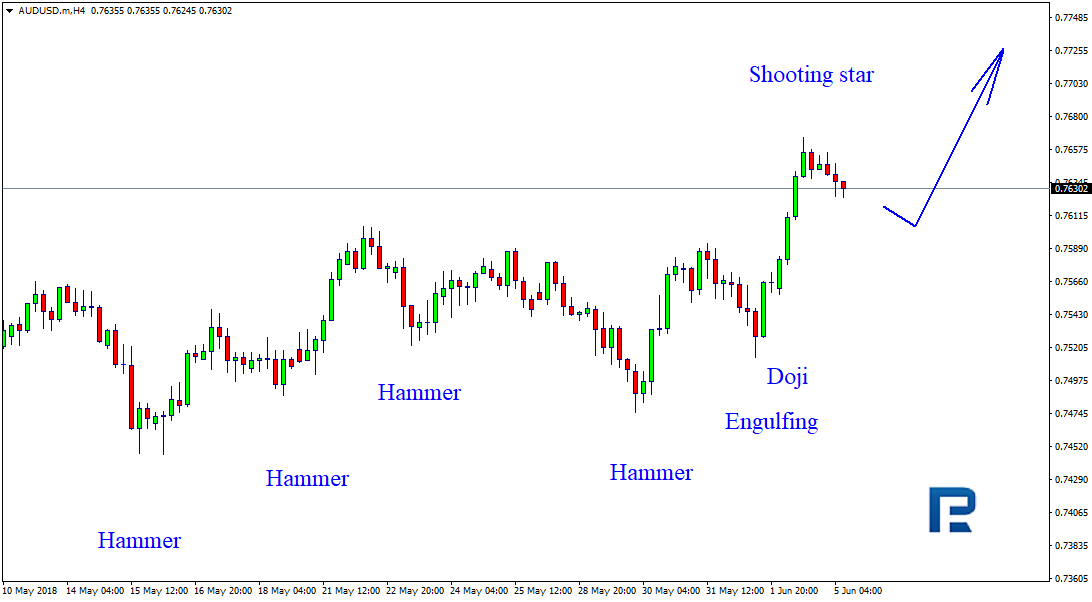
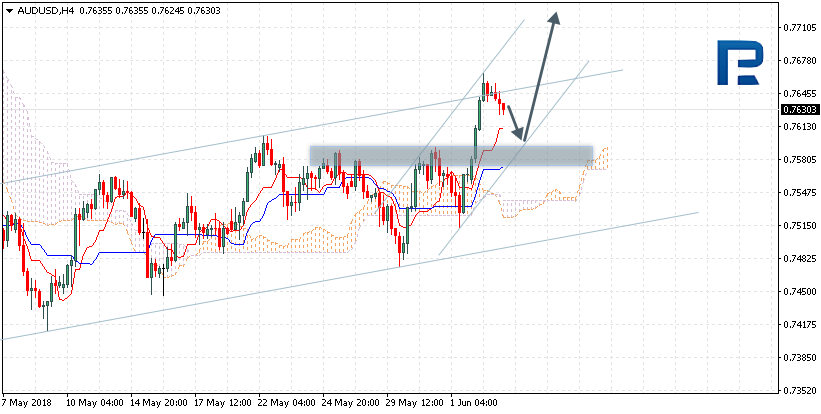
AUDUSD, “Australian Dollar vs US Dollar”
As we can see in the H4 chart, AUDUSD is still moving upwards and forming Doji, Hammer, and Inverted Hammer reversal patterns during corrections. By now, it has reached the resistance level and formed several Shooting Star reversal patterns below it. Judging by the previous movements, it may be assumed that the instrument is being corrected and later may resume trading upwards.
Attention! Forecasts presented in this section only reflect the author’s private opinion and should not be considered as guidance for trading. RoboForex LP bears no responsibility for trading results based on trading recommendations described in these analytical reviews.
James Kwantes, editor of Resource Opportunities, speaks with Ken Armstrong, the CEO of one of the more active diamond companies globally.
Vancouver-based North Arrow Minerals Inc. (NAR:TSX.V) is one of the more active diamond exploration companies globally, with a portfolio of projects focused on Canada. Its most advanced-stage project is the large Naujaat deposit in Nunavut, which has a resource and hosts a population of valuable fancy orange yellow diamonds.
But this season’s focus is on exploration drilling at the Mel and Loki projects in Nunavut and the Northwest Territories, respectively. Mel was a grassroots diamond discovery that North Arrow announced late last year. The company traced kimberlite indicator mineral (KIM) trains up-ice and made a prospecting discovery of kimberlite, from which 23 microdiamonds were recovered from a 62.1-kg sample. The first drilling program on the property is planned for this summer.
The Loki project is in the Lac de Gras diamond field that hosts the Diavik and Ekati mines. The focus there is EG05, a kimberlite that Rio Tinto discovered, and 465, a kimberlite discovered by North Arrow in the spring. The latter was the first kimberlite discovery in Lac de Gras in the past five years. It’s familiar terrain for the North Arrow team, including chairman Gren Thomas whose Aber Resources discovered the Diavik diamond mine.
Rough diamond prices are now at a 52-week high and demand for polished diamonds is strong in China, India and the U.S., according to New York-based diamond analyst Paul Zimnisky. On the production side, pending mine closures including Argyle and Victor will put pressure on supply, with few new operations coming online.
Ken Armstrong
The improving picture follows a choppy 2017 that saw high inventory levels at De Beers and Alrosa and flat rough diamond prices. North Arrow shares have been under pressure along with shares of new Canadian producers Stornoway Diamonds and Mountain Province Diamonds, which declined 41% and 18% respectively over the past year as startup problems weighed.
On Monday North Arrow announced a $3-million private placement consisting of flow-through shares at 20 cents and non-flow-through units (one share, one 2-year 30-cent warrant) at 17 cents. We caught up with CEO Ken Armstrong, who was in Calgary for the TakeStock! investor forum, to find out more about plans and how the money will be used.
Q: What is the breakdown on how the $3-million financing will be spent?
A: We’ve allocated $2 million for Mel drillingtesting the 2017 kimberlite discovery and new targets. That number includes microdiamond processing costs. We will also complete microdiamond processing of the EG05 and 465 kimberlites at the Loki project that were drilled in March, as well as some final microdiamond processing from the 2017 drilling of Naujaat. That’ll be a couple hundred grand. We are also looking at getting a remaining top target drilled at Loki, target 853. Ideally we’d tie that onto ongoing drilling at our LDG JV property, which is operated and funded by partner Dominion Diamond. We’d retain a half million or so for G&A.
Q: Any big names buying into the financing? How much will insiders and management participate for?
A: Insiders are committed to taking at least $1.5 million, so half, with most of that being directors/management. Gren Thomas, our chairman, and Eira Thomas, a North Arrow advisor, will both participate. I will also participate.
Q: How did you determine the pricing of the financing?
A: We tried to price it to make the non flow-through unit and flow-through share components equally attractive. On the Unit we put a fairly quick threshold on the accelerator, at 40 cents, however we felt it was justified by pricing it a discount to market with a full warrant, rather than a half-warrant. The flow through is essentially priced at market with the intent to fill the orderbook efficiently. We are looking at immediate use of funds with Mel drilling in July, Loki drilling in July or August and with more diamond results from Loki, Naujaat, and in September or October, from Mel. This is all news flow that will occur before the four-month hold comes off the financing shares which is, we think, a positive feature of the placement. We have been the most active Canadian junior in terms of new kimberlite discoveries in Canada and are poised for more discovery, potentially on up to three projects, over the four months.
Mel esker location where NAR’s camp is being set up.
Q: Which of the three active projects that you’re raising money for is the most likely catalyst: Loki, Mel or Naujaat?
A: All three have potential catalysts. Folks seem to be most interested in new discoveries and Mel certainly fits that billit’s a brand new kimberlite discovery made by prospecting last fall. The kimberlite contains some very coarse mantle minerals and we see hints of that coarseness in the initial diamond results, which is positive. Having already found kimberlite and diamonds actually de-risks the initial drilling significantly. We know we will hit kimberlite with diamonds, it’s more a question of how many and how big they are.
Based on the spread of indicator minerals there are certainly multiple sources with some nice, sizable magnetic targets. This is a brand new kimberlite field and the first kimberlite discovered is significantly diamondiferous. It doesn’t happen too often, so we are keen to get drilling. We’re currently mobilizing a camp and drill to the property now with drilling planned for July.
At Loki we also have a new discovery and are waiting on microdiamond results. In early April we announced the discovery of the 465 kimberlitethe first kimberlite discovery made in the Lac de Gras area in over five years. There are also pending microdiamond results from the EG05 kimberlite which was also drilled during the spring 2018 program. We also have a number of targets that we’d like to drill test, including target 853, which we’d like to see drilled this summer.
Q: It’s been almost three years since the disappointing Naujaat diamond valuation. Does Naujaat remain North Arrow’s flagship project and what is happening with the project?
A: Naujaat remains North Arrow’s most advanced project. We’re still interested because it’s a significant diamond inventory in a large tonnage deposit (as far as Canadian diamond deposits go) sitting on tidewater near a community. Our work on the Q1-4 diamonds has clearly shown the deposit contains high-value fancy orange yellow diamonds and, overall, is under evaluated. Last summer we completed more drilling to confirm the size potential of the kimberlite down to 300 metres below surface and we had three different holes extend over 100 meters beyond the geological model, with two of those holes ending in kimberlite. It’s a big body. We also collected a 210-tonne sample that confirmed the presence of the colored diamond population in the A88 phase of the kimberlite. This is a totally different unit than was sampled in 2014the 2017 sample pit was over 400 metres away for the 2014 pitsand the proportion of colored stones is very similar to the 2014 result. The work we’ve done with the diamonds themselves has shown that the colored stones are a distinct population from the non-colored stones. The two populations are completely different ages and the yellow population has a markedly coarser distribution than the non-colored stones.
The photos of the diamonds we had polished and certified at the GIA show how beautiful this color is and highlight the potential value upside in these diamonds. But it is actually the potential for a coarse size distribution that may be even more important in terms of potential upside to the value contribution of the colored diamonds. And the only way to confirm or disprove the potential value upside is a larger bulk sample.
To that end we have hired consultants and been working closely with the community of Naujaat to look at developing a road to the deposit. We’ve also started looking at processing options for a larger sample and how that might look, all with an eye to better pinning down the budget options for collecting a sample of sufficient size to get that answer. Being so close to the community really presents opportunities for reduced costswe’ve seen that with our exploration programs and we need to make sure we take full advantage of all potential cost savings.
Of course all this takes time, but that is why we have North Arrow evaluating a number of quality projects, not just one. It allows the team to focus on well-informed, cost-effective exploration even if that might mean slower news flow from a particular project. There will be steady news flow from other projects as each cycles through the process.
Q: Along the lines of quiet projects, what is the status of the Lac de Gras joint venture with operator Dominion Diamond Corp.?
A: The LDG JV is having an active year. It has definitely been one of our quieter projects as our partner Dominion spent a lot of effort defining targets through a series of overburden drilling and geophysics programs. Late last year, Dominion also went through a well-documented takeover by the Washington Group of Companies, with the resulting transitions that often accompany such changes. However, a very positive outcome for the LDG joint venture has been Dominion’s renewed commitment to exploration, and, as I understand it, the 2018 LDG JV budget was one of the first budgets approved by the new ownership. The focus of the 2018 program is exploration and discovery-type drilling and we expect that work to pick up again during the summer. North Arrow elected not to finance its share of the current program so we could focus our resources drilling our 100% owned projects at Mel and Loki. However, although we are taking dilution of our joint venture interest, if a Lac de Gras-type discovery is made North Arrow will still maintain a significant interest, north of 25%, in the joint venture.
Q: With Eira recently taking over as CEO of Lucara Diamond Corp., how involved does she remain with North Arrow?
A: Eira’s involvement with North Arrow has been key since we began our focus on the Canadian diamond space. She remains an important advisor and sounding board for managementand the boardas we strategize on how best to move the project portfolio forward.
James Kwantes is the editor of Resource Opportunities, a subscriber supported junior mining investment publication. Kwantes has two decades of journalism experience and was the mining reporter at Vancouver Sun, the city’s paper of record.
Want to read more Gold Report articles like this? Sign up for our free e-newsletter, and you’ll learn when new articles have been published. To see a list of recent articles and interviews with industry analysts and commentators, visit our Streetwise Interviews page.
Disclosure: North Arrow Minerals is one of three Resource Opportunities sponsor companies and James Kwantes owns North Arrow shares. Readers are advised that this article is solely for information purposes. Readers are encouraged to conduct their own research and due diligence, and/or obtain professional advice. The information is based on sources which the publisher believes to be reliable, but is not guaranteed to be accurate, and does not purport to be a complete statement or summary of the available data.
Copyright: This publication may not be reproduced in whole or in part, in any form, without the express permission of the publisher. Permission is given to extract parts of the report for inclusion or review in other publications only if credit is given, including the name and address of the publisher.
Disclosure: 1) James Kwantes’ disclosures are listed above. 2) The following companies mentioned are billboard sponsors of Streetwise Reports: None. Click here for important disclosures about sponsor fees. The information provided above is for informational purposes only and is not a recommendation to buy or sell any security. 3) Statements and opinions expressed are the opinions of the author and not of Streetwise Reports or its officers. The author is wholly responsible for the validity of the statements. The author was not paid by Streetwise Reports for this article. Streetwise Reports was not paid by the author to publish or syndicate this article. Streetwise Reports requires contributing authors to disclose any shareholdings in, or economic relationships with, companies that they write about. Streetwise Reports relies upon the authors to accurately provide this information and Streetwise Reports has no means of verifying its accuracy. 4) The article does not constitute investment advice. Each reader is encouraged to consult with his or her individual financial professional and any action a reader takes as a result of information presented here is his or her own responsibility. By opening this page, each reader accepts and agrees to Streetwise Reports’ terms of use and full legal disclaimer. This article is not a solicitation for investment. Streetwise Reports does not render general or specific investment advice and the information on Streetwise Reports should not be considered a recommendation to buy or sell any security. Streetwise Reports does not endorse or recommend the business, products, services or securities of any company mentioned on Streetwise Reports. 5) From time to time, Streetwise Reports LLC and its directors, officers, employees or members of their families, as well as persons interviewed for articles and interviews on the site, may have a long or short position in securities mentioned. Directors, officers, employees or members of their immediate families are prohibited from making purchases and/or sales of those securities in the open market or otherwise from the time of the interview or the decision to write an article, until one week after the publication of the interview or article. As of the date of this article, officers and/or employees of Streetwise Reports LLC (including members of their household) own securities of Lucara Diamond Corp., a company mentioned in this article.
AUDUSD is trading at 0.7630; the instrument is moving above Ichimoku Cloud, which means that it may continue growing. The markets could indicate that the price may test Tenkan-Sen and Kijun-Sen at 0.7605 and then continue moving upwards to reach 0.7715. Another signal to confirm further ascending movement is the price’s rebounding from the support level. However, the scenario that Implies further growth may be cancelled if the price breaks the downside border of the cloud and fixes below 0.7520. In this case, the pair may continue falling towards 0.7440. After breaking the channel’s upside border and fixing above 0.7670, the price may continue moving upwards.
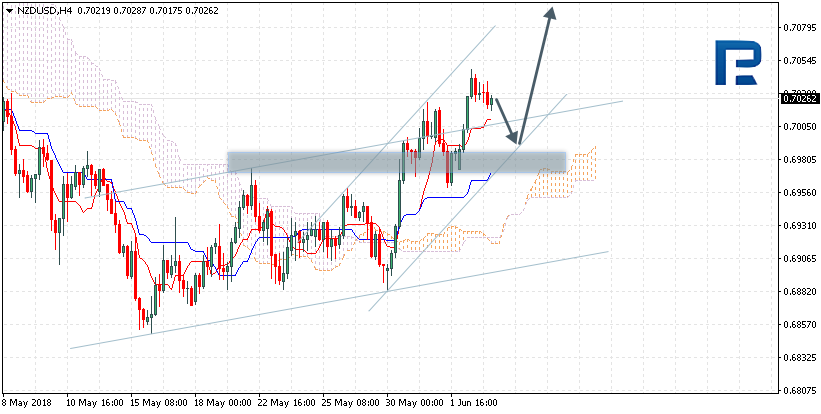
NZDUSD, “New Zealand Dollar vs US Dollar”
NZDUSD is trading at 0.7026; the instrument is moving above Ichimoku Cloud, which means that it may continue growing. The markets could indicate that the price may test Tenkan-Sen and Kijun-Sen at 0.7000 and then continue moving upwards to reach 0.7095. Another signal to confirm further ascending movement is the price’s rebounding from the support level. However, the scenario that implies further growth may be cancelled if the price breaks the downside border of the cloud and fixes below 0.6935.
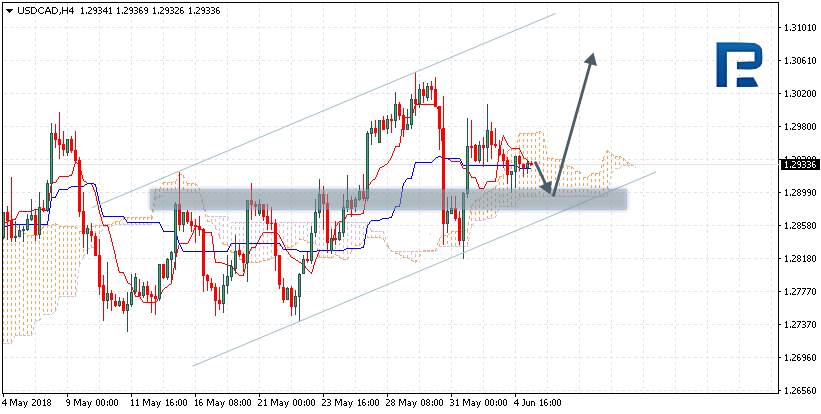
USDCAD, “US Dollar vs Canadian Dollar”
USDCAD is trading at 1.2933; the instrument is moving inside Ichimoku Cloud, which means that it is moving sideways. The markets could indicate that the price may test the downside border of the cloud at 1.2900 and then continue moving upwards to reach 1.3065. Another signal to confirm further ascending movement is the price’s rebounding from the support level. However, the scenario that implies further growth may be cancelled if the price breaks the downside border of the cloud and fixes below 1.2860. In this case, the pair may continue falling towards 1.2745. After breaking the upside border of the cloud and fixing above 1.2965, the price may continue moving upwards.
Attention! Forecasts presented in this section only reflect the author’s private opinion and should not be considered as guidance for trading. RoboForex LP bears no responsibility for trading results based on trading recommendations described in these analytical reviews.
U.S. equities kicked off the trading week with two indices, the Nasdaq Composite and the Russell 2000, hitting new record highs. This impressive performance is a continuation of Friday’s rally following the U.S. jobs report showing that the economy is firing on all cylinders. Easing fears from Italy’s political situation after the formation of a coalition government also revived appetite for risk. However, Europe’s problems are not over yet; although the U.S. jobs report beat forecasts it shouldn’t have been a big surprise given the improvement seen previously in the labor market. What surprises me the most is investor complacency towards President Trump’s decision on imposing steep tariffs on metals imported from the U.S.’s closest allies.
Trade wars cannot be ignored, and you don’t need a Ph.D. degree in economics to know that they will severely hurt the world’s economy. The only explanation for the lack of negative reaction from such headlines is that investors believe Trump will back away after extracting better deals from his trading partners. However, nothing is guaranteed here, and the risk of a tit-for-tat tariff spat converting to a full-blown trade war has increased significantly. Unless there are some positive announcements, I think investors will likely shift to a more cautious mode.
Currency markets were trading in tight ranges during Asian trade. The Euro fell slightly below 1.17, while the Pound and the Yen barely moved. The Aussie was the best performing currency yesterday, rising 1% against the Dollar. It was also unmoved by the RBA’s decision to keep policy unchanged.
On the data front, the Eurozone Services PMI is likely to confirm that the economy continued to slow down as it entered Q2. Meanwhile, the U.S. ISM Non-Manufacturing PMI is expected to show sustained expansion in the economy’s largest sector. This should be Dollar-positive overall, especially given that the Fed may start to consider accelerating the pace of interest rate hikes.
Oil prices recovered slightly from yesterday’s fall, but expectations of higher supplies from OPEC may continue to weigh on prices. WTI fell from a high of $72.83 recorded on 22 May to a low of $64.57 yesterday. Whether the fall in prices is just profit-taking or a change in trend will be determined on 22 and 23 June when OPEC members meet in Vienna.
Disclaimer: The content in this article comprises personal opinions and should not be construed as containing personal and/or other investment advice and/or an offer of and/or solicitation for any transactions in financial instruments and/or a guarantee and/or prediction of future performance. ForexTime (FXTM), its affiliates, agents, directors, officers or employees do not guarantee the accuracy, validity, timeliness or completeness, of any information or data made available and assume no liability as to any loss arising from any investment based on the same.
Our proprietary predictive modeling systems are showing us a core market dynamic that many people are completely unaware of right now. We are going to show you something in this post that is so valuable that you won’t believe we are sharing it with you. Why are we doing this you might ask? Because we want you to think about how different your daily trading routine would be like as a member of Technical Traders Ltd. and how our specialized research and proprietary modeling systems can assist you in staying ahead of the markets.
If you’ve followed any of our previous analysis posts, you already know we called this market bottom as it happened, over 60 days ago. You also know we’ve been predicting the markets to rally in an attempt to breach the all-time market highs for the past 40+ days. Now, you are going to learn what the markets are going to do over the next 3~5+ weeks as a dynamic price valuation shift is starting to unfold. If you want to see what the markets are going to do all the way into early 2019, then join www.TheTechnicalTraders.com and learn how we can help to keep you ahead of these market moves and learn how we can help you find profits every week.
Here we go..
Right now, as we understand it, a number of institutions and professional traders are watching the global markets for any immediate signs this market will rotate lower and potentially crash. Many institutions are betting that the foreign markets and the US market is overextended and may collapse. Yet, our proprietary analysis and price modeling systems are showing a completely different picture for the next 6~9+ months. You are about to learn how and why you want to focus your trading on specific sectors over the next 4~6 months.
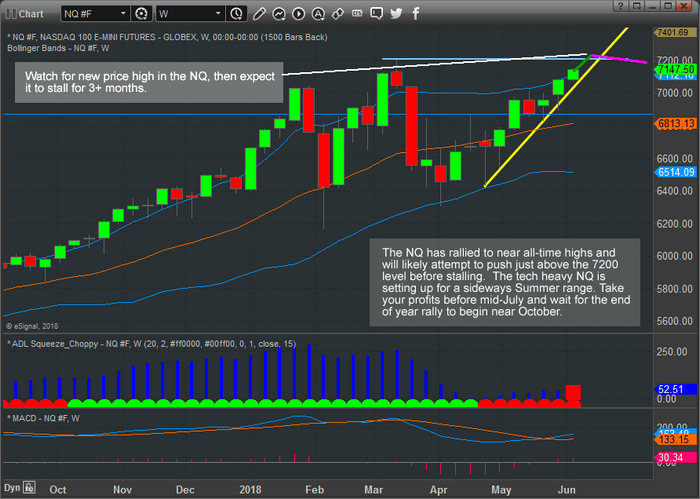
Recent price action in the US majors has been a bit lopsided into the tech-heavy NASDAQ. Because of this, the other US majors have now seen the types of price advances that our predictive modeling systems have predicted. The NQ has advanced substantially as we believe a unique capital flight is taking place where foreign capital is rushing into the US markets chasing profits and earnings. The general consensus is that investing in technology firms will provide the best returns. Well, this may not be the case over the next few months and we believe the real opportunity lies in the Blue Chips and S&P sectors.
This NQ Weekly chart shows that the NASDAQ has nearly rallied to above all-time price high levels and has little more than +1% to go before testing/breaching these levels. Granted, the move in the NQ has been impressive and we believe the primary factor in this move is the rush of capital entering into the technology and biotech markets that make up the NQ sectors driving this rally. Our price modeling systems suggest this move is nearly over and the NQ will likely consolidate and rotate over the next 3 months.
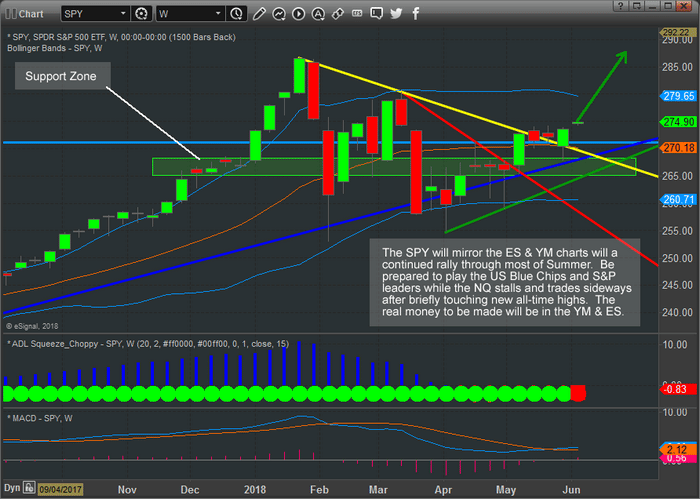
This leads us to believe that capital will shift from the technology and biotech-heavy NASDAQ to the other US sectors that have underperformed recently.
This SPY weekly chart shows what we believe is the underlying shift that is taking place. While the NQ has rallied to near all-time highs, the SPY has just recently begun to advance above recent rotational highs. With a strong support zone near $255 and all-time highs near $268.60, the SPY has a potential for a +4.5% price rally to reach these recent all-time highs.
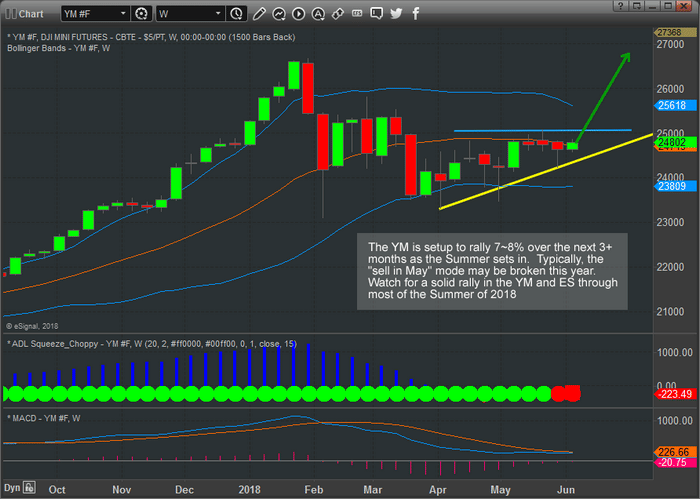
This YM chart shows a similar setup to the SPY. With support near 24,450 and a clear upside sloping price channel, the YM chart shows a potential for a +7~8% upside price move before reaching near all-time highs.
We believe a pricing valuation shift will begin to occur in the US majors over the month of June where the NQ rallies to just above the all-time high levels, stalls and rotates over the Summer months while the S&P and DOW Blue Chips and leaders rally +4~10% over the same time span. We believe this shift in pricing dynamics will be the result of price valuations/expectation levels in the NQ having outrun true earnings potentials. Foreign capital has been pouring into the US technology stocks for well over 16 months now. Much like the 2000 Dot Com bust, this run may be overextended and a pricing shift is likely already started. The real profits over the next few months will be in the S&P and DOW leaders.
Isn’t it about time you made an investment into your trading future that really generated returns for your subscription costs? Take a look at some of our recent research posts to see how accurate our research really is and understand that we are providing you with valuable insight in this article that you will probably start to hear about in 30+ days from all the other researchers. If you want to stay ahead of the markets like we do, then visit www.TheTechncialTraders.com and become a valued subscriber. We know you will be satisfied with our efforts to help you become more successful.