By CountingPips.com – Receive our weekly COT Reports by Email
Here are this week’s links to the latest Commitment of Traders data changes that were released on Friday.
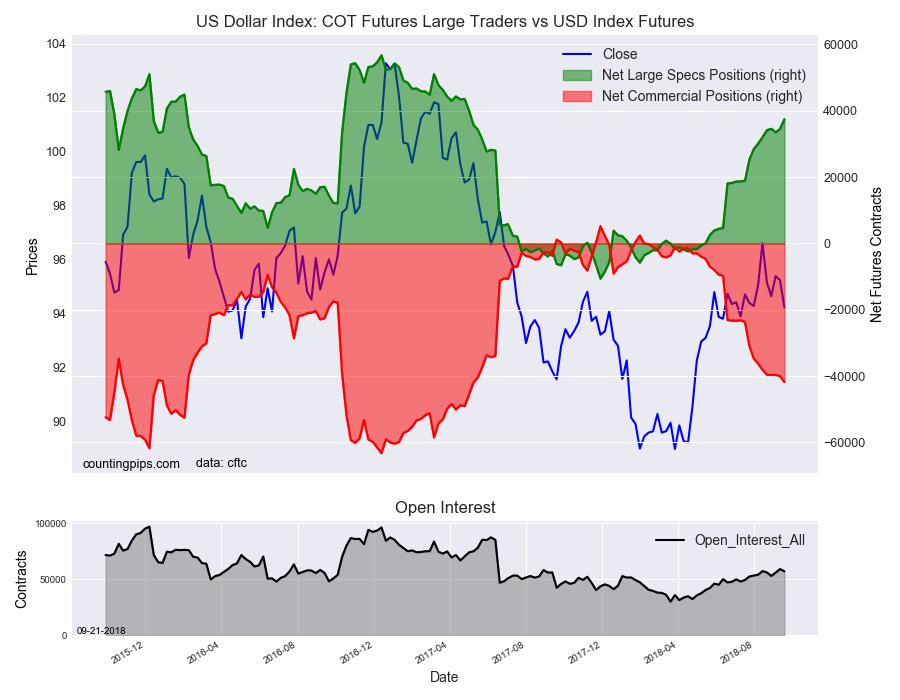
- Forex Speculators raised US Dollar Index bets higher. AUD, GBP bets fall sharply
- WTI Crude Oil Speculators pull back on bullish bets again
- 10-Year Note Speculators slightly edged their bearish bets higher
- Bitcoin Speculators raised their bearish net positions higher
- Gold Speculators added to their bearish bets, now bearish for 6 straight weeks
- S&P500 Mini Speculators advanced their bullish net positions
- VIX Speculators edged their bearish net positions lower for 2nd week
- Silver Speculators pulled back on their bearish bets for 2nd week
- Copper Speculators cut back on their bearish net positions
Forex Speculators raised US Dollar Index bets higher. AUD, GBP bets fall sharply

The latest data for the weekly Commitment of Traders (COT) report, released by the Commodity Futures Trading Commission (CFTC) on Friday, showed that large currency speculators continued to boost their bullish net positions in favor the US Dollar Index futures markets this week. See full article
WTI Crude Oil Speculators pull back on bullish bets again this week

The non-commercial contracts of WTI crude futures totaled a net position of 530,366 contracts, according to data from this week. This was a slide of -13,479 contracts from the previous weekly total. See full article
Gold Speculators added to their bearish bets, now bearish for 6 straight weeks

The large speculator contracts of gold futures totaled a net position of -10,844 contracts. This was a weekly decline of -3,254 contracts from the previous week. See full article
10-Year Note Speculators slightly edged their bearish bets higher

The large speculator contracts of 10-year treasury note futures totaled a net position of -684,712 contracts. This was a weekly reduction of -2,028 contracts from the previous week. See full article
S&P500 Mini Speculators advanced their bullish net positions

The large speculator contracts of S&P500 Mini futures totaled a net position of 149,962 contracts. This was a rise of 27,742 contracts from the reported data of the previous week. See full article
Silver Speculators pulled back on their bearish bets for 2nd week

The non-commercial contracts of silver futures totaled a net position of -25,516 contracts, according to data from this week. This was a weekly gain of 1,887 contracts from the previous totals. See full article
Copper Speculators cut back on their bearish net positions

The large speculator contracts of copper futures totaled a net position of -191 contracts. This was a weekly boost of 8,703 contracts from the data of the previous week. See full article
Article by CountingPips.com – Receive our weekly COT Reports by Email
The Commitment of Traders report data is published in raw form every Friday by the Commodity Futures Trading Commission (CFTC) and shows the futures positions of market participants as of the previous Tuesday (data is reported 3 days behind).
To learn more about this data please visit the CFTC website at http://www.cftc.gov/MarketReports/CommitmentsofTraders/index.htm