Article By RoboForex.com
EURUSD, “Euro vs US Dollar”
EURUSD is still consolidating; it has finished another ascending structure towards the upside border and right now is trading downwards. Possibly, today the price may fall to reach 1.1260 and then resume growing towards 1.1305. After that, the instrument may continue trading inside the downtrend with the target at 1.1155.


GBPUSD, “Great Britain Pound vs US Dollar”
GBPUSD has broken 1.2890 downwards; in fact, it is forming the third descending wave with the target at 1.2710. Today, the pair may return to 1.2890 to test it from below and then resume falling to reach the above-mentioned target. The main target of this descending wave is at 1.2655, at least.

USDCHF, “US Dollar vs Swiss Franc”
USDCHF is still consolidating around 1.0072. Possibly, the pair may choose an alternative scenario and extend this correction towards 1.0018. According to the main scenario, the price may break the range upwards and then resume trading inside the uptrend with the target at 1.0148.

USDJPY, “US Dollar vs Japanese Yen”
USDJPY is trading below 113.57. Today, the pair may continue falling with the first target at 112.94. Later, the market may be corrected return to 113.57 and then resume trading inside the downtrend to reach 111.00.

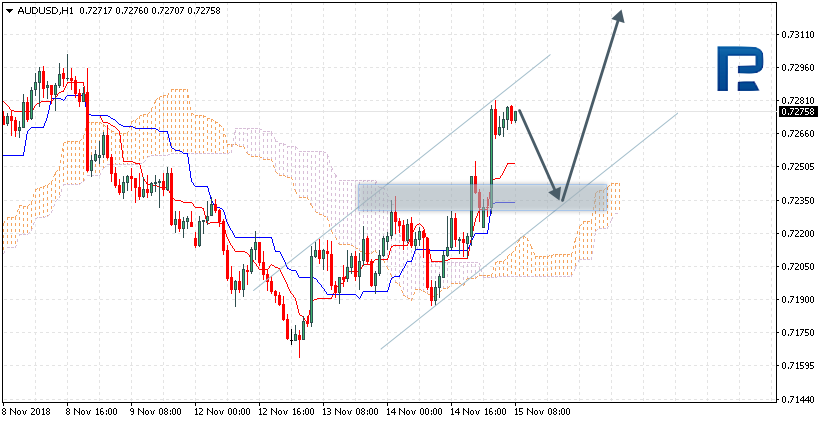
AUDUSD, “Australian Dollar vs US Dollar”
AUDUSD is consolidating around 0.7272. Possibly, today the price may break the range downwards and resume trading inside the downtrend with the first target at 0.7160.

USDRUB, “US Dollar vs Russian Ruble”
USDRUB is trading downwards; it has broken the rising channel and is moving to reach the target at 65.62. Today, the pair may reach this level and then form one more ascending structure towards 66.48. After that, the instrument may continue forming the third descending wave with the target at 63.10.

XAUUSD, “Gold vs US Dollar”
Gold is forming the fifth structure. Possibly, today the price may reach 1217.75 and then form a new descending wave towards 1190.00. Later, the market may start another growth with the first target at 1220.00.

BRENT
Brent is forming the second ascending impulse with the target at 68.88. Today, the pair may reach this target and then resume falling towards 67.20. After that, the instrument may form one more ascending impulse, the third one, to reach the first target at 69.69.

Article By RoboForex.com
Attention!
Forecasts presented in this section only reflect the author’s private opinion and should not be considered as guidance for trading. RoboForex LP bears no responsibility for trading results based on trading recommendations described in these analytical reviews.