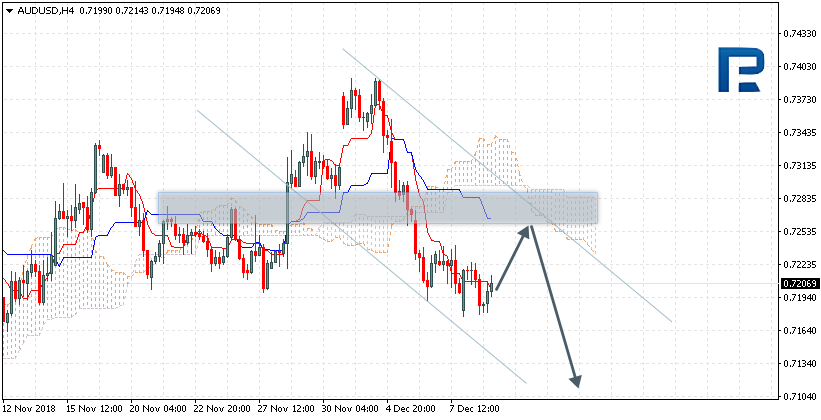
AUDUSD is trading at 0.7206; the instrument is moving below Ichimoku Cloud, thus indicating a descending tendency. The markets could indicate that the price may test Tenkan-Sen and Kijun-Sen at 0.7255 and then resume moving downwards to reach 0.7105. Another signal to confirm further descending movement is the price’s rebounding from the channel’s upside border. However, the scenario that Implies further decline may be cancelled if the price breaks the upside border of the cloud and fixes above 0.7295. In this case, the pair may continue growing towards 0.7385.
NZDUSD, “New Zealand Dollar vs US Dollar”
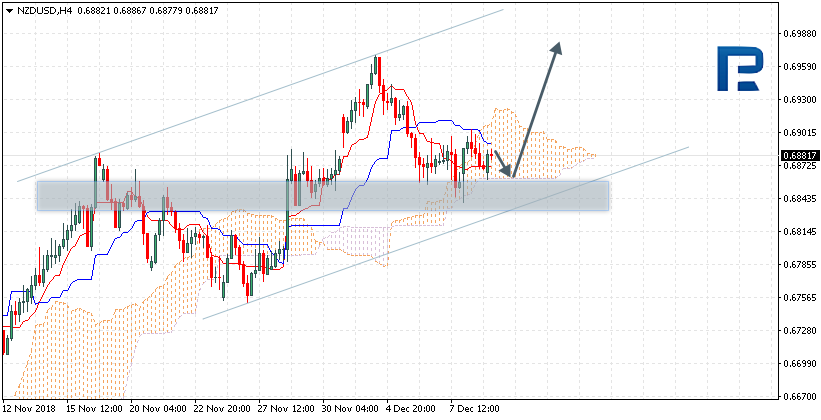
NZDUSD is trading at 0.6881; the instrument is moving inside Ichimoku Cloud, thus indicating a sideways tendency. The markets could indicate that the price may test the downside border of the cloud at 0.6865 and then resume moving upwards to reach 0.6985. Another signal to confirm further ascending movement is the price’s rebounding from the support level. However, the scenario that Implies further growth may be cancelled if the price breaks the downside border of the cloud and fixes below 0.6835. In this case, the pair may continue falling towards 0.6735.
USDCAD, “US Dollar vs Canadian Dollar”
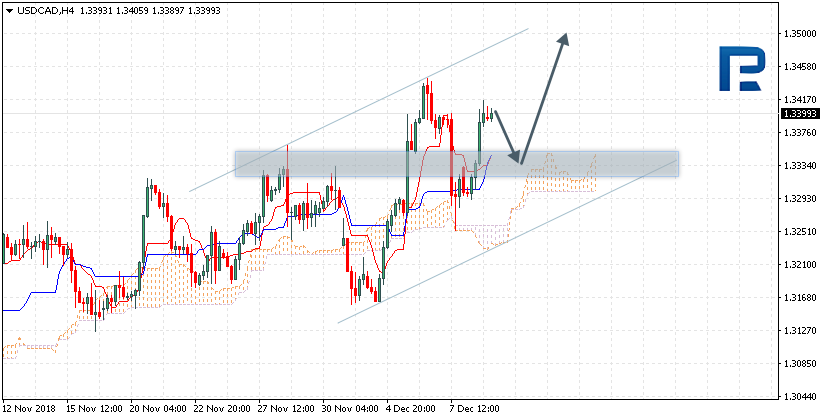
USDCAD is trading at 1.3399; the instrument is moving above Ichimoku Cloud, thus indicating an ascending tendency. The markets could indicate that the price may test the upside border of the cloud at 1.3335 and then resume moving upwards to reach 1.3500. Another signal to confirm further ascending movement is the price’s rebounding from the support level. However, the scenario that implies further growth may be cancelled if the price breaks the downside border of the cloud and fixes below 1.3280. In this case, the pair may continue falling towards 1.3165.
Attention! Forecasts presented in this section only reflect the author’s private opinion and should not be considered as guidance for trading. RoboForex LP bears no responsibility for trading results based on trading recommendations described in these analytical reviews.
Time to deal with bitcoin again. I last mentioned this instrument on the 19th of November, when the price was slightly above 5,200 USD. We had a fresh sell signal after the breakout of the 6,000 USD support. Our analysis was spot on, the price fell like a rock! It has now been almost a month. Has anything changed here?
I think that the current low prices have created a situation where the casuals have already lost interest in this instrument, but fans of the technology and professional traders are starting to look for buying opportunities. In my opinion, we are not there yet and we should experience a further decline. The most recent development since the support at 6,000 surrendered is the descending triangle pattern (orange). In a downtrend, this kind of a formation is a very strong bearish factor. No surprise then that BTC broke the lower line of this pattern and continued downwards.
The new week started with a test of the broken support as the closest resistance, so a very clean price action movement. So far, the test is positive for sellers, which increases the chances of a further slide towards 2,900 USD (blue). That is our mid-term target for this instrument. In my opinion, the chances that we will get there are very high.
Yesterday the EUR/USD had a bearish mood. The EUR updated the local minimums. The EUR/USD quotes are consolidating. The local support and resistance levels are 1.13500 and 1.13750. Positions should be opened from these levels. Investors expect reports from Germany and the USA.
The Economic News Feed for 11.12.2018:
– Economic Mood index ZEW (GER) – 12:00 (GMT+2:00);
– Manufacturer Price Index (US) – 15:30 (GMT+2:00).
Indicators do not provide precise signals, the price fixed between 50 MA and 200 MA.
MACD is in the negative zone but above the signal line, which gives a weak signal to sell EUR/USD.
The Stochastic Oscillator is in the neutral zone but above the signal line, which indicates a bearish mood.
Trading recommendations
Support levels: 1.13500, 1.13200, 1.13000
Resistance levels: 1.13750, 1.14000, 1.14400
If the price fixes below the support 1.13500, expect further descend towards 1.13200-1.13000.
Alternatively, the quotes can recover toward 1.14000-1.14200.
The GBP/USD currency pair
Technical indicators of the currency pair:
Prev Open: 1.27022
Open: 1.25557
% chg. over the last day: -1.25
Day’s range: 1.25446 – 1.25907
52 wk range: 1.2510 – 1.4378
Yesterday the GBP/USD saw an aggressive sell-off. The quotes fell by 150 pips and updated the annual minimums. The Brexit conundrum remains in the spotlight. Theresa May announced the cancellation of the vote in the House of Commons regarding the UK leaving the European Union. An additional pressure on the GBP is cause by the array of weak economic reports regarding GDP and manufacturing industry. The quotes are being traded around 1.25600-1.26000. Positions should be opened from these levels.
At 11:30 (GMT+2:00) the UK will publish the Labour Market report.
Indicators show the power of the sellers. The price is below 50 MA and 200 MA.
The MACD histogram is in the negative zone but above the signal line, which indicates a weak bearish sentiment.
Stochastic Oscillator is in the neutral zone, the %K line started to cross %D line. There are no signals at the moment.
Trading recommendations
Support levels: 1.25600, 1.25100
Resistance levels: 1.26000, 1.26400, 1.26700
If the price fixes below 1.25600, the GBP/USD quotes are expected to fall. The movement is tending to 1.25200-1.25000.
An alternative could be a growth in the GBP/USD currency pair to 1.26400-1.26700.
The USD/CAD currency pair
Technical indicators of the currency pair:
Prev Open: 1.33328
Open: 1.33986
% chg. over the last day: +0.52
Day’s range: 1.33914 – 1.34215
52 wk range: 1.2248 – 1.3445
USD/CAD started to grow again. Yesterday CAD weakened against the USD by 75 pips. The quotes are testing 1.34200-1.34450 with the local support being 1.33800. The pressure on CAD is caused by the negative dynamic of the oil quotes. The trading instrument has prospects for growth. You should open positions from the key levels.
The News Feed for Canada is calm.
The indicators point toward the power of the buyers: the price has fixed above the 50 MA and 200 MA.
The MACD histogram is in the positive zone and keeps rising which points towards the growth of the USD/CAD quotes.
The Stochastic Oscillator is in the neutral zone, the %K line is above the %D line, which points towards the growth of the USD/CAD quotes.
Trading recommendations
Support levels: 1.33800, 1.33300, 1.32900
Resistance levels: 1.34200, 1.34450
If the price fixes below the local resistance of 1.34200, further growth of the USD/CAD quotes is expected. The movement is tending to 1.34500-1.34750.
Alternative option. If the price fixes above 1.33800, we recommend looking for market entry points to open short positions. The movement is tending to 1.33500-1.33300.
The USD/JPY currency pair
Technical indicators of the currency pair:
Prev Open: 112.613
Open: 113.317
% chg. over the last day: +0.60
Day’s range: 113.007 – 113.325
52 wk range: 104.56 – 114.56
USD/JPY started to grow. During yesterday`s trades, the yen is weakened against the USA by more than 70 pips. The USD/JPY quotes are consolidating. The local support and resistance are 112.900 and 113.200. We expect important reports from the US. You should also keep an eye on the US Government bonds yield.
Indicators do not provide precise data, the price has crossed the 200 MA.
The MACD histogram is in the positive zone but below the signal line, which gives a weak signal to buy USD/JPY.
The Stochastic Oscillator is in the neutral zone, the %K line is above the %D line, which points towards a bullish mood.
Trading recommendations
Support levels: 112.900, 112.600, 112.250
Resistance levels: 113.200, 113.600
If the price fixes above the support level of 113.200,, it is necessary to consider buying USD/JPY. The movement is tending to 113.500-113.700.
An alternative could be the descend of the USD/JPY quotes to 112.600-112.400.
We’re experiencing a very negative week for US stocks. The DJIA closed on Friday at 24389 points, and that is a staggering -4.44% over the previous week’s close. The same story for the S&P500: – 4.55% at 2633, and for the NASDAQ, which closed on Friday at 6969 points, or -4.9%.
This drop pushed the YTD returns back to almost parity level, with only the NASDAQ still showing a YTD performance around +1.9%. It was a pretty volatile week that opened with a gap up for all indexes in the US and around the world, following the G20 meeting, during which the Trump administration agreed to a 3-month suspension of new tariffs on Chinese goods, so as to give time to work out an agreement. This news was welcomed by stock investors which resumed their buying activity producing the mentioned gap up.
As we wrote last week, we were not very convinced that such movement was based on consistent reasons and, besides the market’s technical tendency towards close gaps, we thought that such a suspension would be a step forward towards a “yes”, but it does not necessarily mean that an agreement is close.
The Trump administration has heavily bet on the tactic of putting pressure on China and it is quite unlikely that they will back away significantly from their actual position. President Trump was quick to remind everybody that he is the “tariff guy”, and therefore China should not expect any fundamental change in the US’ attitude.
We also mentioned the inversion of the short term part of the yield curve, which is seen as a serious warning sign in terms of expectations concerning the future path of the US economy.
While an inversion involving 10-year bonds would be more meaningful, even considering that the bond market (as the stock market) has been significantly distorted by the quantitative easing (which is being phased out) put in place by the Fed for over 9 years, I still do not think that such a signal from the bond market should be underestimated.
We therefore decide to protect our profits by raising the stop profit of our long positions on the S&P500 and the NASDAQ below the opened gap. Both were taken out as the enthusiasm surrounding the G20 news faded and investors started looking at the situation more objectively. And coming back to reality brought an almost 800-point drop on the DJIA on Tuesday!
There is another sign that should be taken into consideration and that is often overlooked: the performance of the Russel 2000 index, which with last week’s drop of -5.53%, posts a quarterly to date performance of -14.45%, sending the YTD performance of this index below -4.5%. In my humble opinion, such a performance by this index, which includes the bottom 2000 small cap / high-growth-potential stocks of the larger Russell 3000 index, signals that investor confidence in the performance of the economy and therefore the stock market, is starting to decrease, and investors are slowly pulling out from the riskier part of their stock portfolio.
To add insult to injury, the news regarding Huawei’s Chief Financial Officer being arrested in Canada and possibly extradited to the US showed without any shade of a doubt that the US administration is nowhere near easing its pressure on China and actually seeking to add more of it.
Given this situation, it was no surprise that the US stock indexes were pushed back to test the lows touched in the second part of October and again two weeks ago:
Here is the situation on the S&P500:
The sharp drop after the gap up is clearly visible and took out our stop profits. In all honesty, that triple top was itching to be traded short reversing the long position with a very good risk-to-reward ratio, as the stop would have been not far above the 2820. Add to this our bearish view as explained above and.. we made a mistake by not trading this set up. No excuses here.
Now we are on the opposite side of the wide range, in which the index has been moving since mid-October and we have the MACD continuing to form a bullish divergence. An impulse to the upside could be given by the tendency of institutional investors towards some “window dressing” to embellish their quarterly and, most importantly, yearly reports to their clients, especially when all the gains since the beginning of the year have vanished.
The US economy is still showing strength and besides slightly lower-than-expected NFP numbers, unemployment still sits at 3.7%, a 49-year-low, and wages are starting to pick up significantly. The effect of the corporate tax cuts is still there and the economy is performing fairly well, besides the fact that some warnings have popped up lately.
If investors’ attention shifts to the fundamentals, which aligns with the urge to present positive results at yearend, the support of the triple bottom could hold, confirming the bullish set up of the MACD which is continuing to draw higher lows.
At the moment, futures are signalling a slightly negative open in the US, but recovering from the daily lows, and we will wait to check on Monday close to take a decision on a possible tactical long, which again could have a good risk/reward ratio given the stop to be eventually positioned not far from the actual price below 2590 with a possible new test of the upper band of the range.
The situation on NASDAQ is not that different from a technical point of view:
Here again a possible bounce off a support, with the MACD showing an even more bullish tendency.
It is also true though that prices are considerably off the 200-period moving average and the rally that brought the prices up until Monday last week and the subsequent drop seem to have formed a false break out. Therefore, though the temptation to go long here is strong, we have to resist and exercise patience. I do not see any definitive set up here so we will wait to see how the situation unfolds the first two days of the week before eventually take a trade decision.
Talking about false breakouts, which often lead to a strong reaction to the opposite side, here is the situation on the DAXA30 index:
During the week we have been monitoring our long time short, and we are trailing the stop profit on half the original position.
Over the week we tweeted our updates and signalled a possible false breakout of the dynamic resistance (marked in orange in the chart):
The index continued its drop, weighted down by the news regarding banking giant Deutsche Bank’s possible misconduct and involvement in money laundering schemes, which led to the German authorities raiding the bank’s headquarters on the 29th of November, as well as the questioning of officials and seizure of documents. Add to this the derivative time bomb the bank holds, the size of which is difficult to determine, and there is more than enough to curb investors’ enthusiasm.
We will continue to monitor the situation and should the index continue its drop to successfully test the closet ex-support at 10800, we will lower our stop profit to secure more profits. We will keep you posted on our social media pages.
As far as Brent Oil is concerned, as you might remember, we closed off our short trade last week, after an amazing run and lots of profits.
This week OPEC met to address the sharp drop in oil prices. A production cut of 1.2 bpd (barrel per day) was agreed, as widely anticipated, and many expected a sharp rise. We were not of that opinion and remained flat. Here is the situation after the meeting:
As you can see not much has happened here. The gap opened on Monday was closed before the meeting and then we had a bullish reaction on the test of the dynamic ex-resistance. Again, not much to be seen here and prices seem to be going back to the downside again.
Why is this happening despite the production cut? As far as we are concerned, if our analysis on the economic slowdown as described earlier makes sense, then the problem could be in the forecast of the demand side. A slower economy might lead to a lower demand of energy especially in energy intensive activities, which has already been impacted by some of the tariffs imposed by the US. This week will probably give us some hints on possible future moves, but so far we are not taking positions and remain flat.
We are approaching an interesting set up on EURUSD:
The cross tested the support at 1.13 area and bounced back to test the resistance at 1.1430. We are again on the verge of completing an inverse head and shoulder. The MACD seems to be following suit, so if the cross breaks above the resistance band (in blue) we can consider a long here.
Should this trade materialise, there are chances that the stock market would also be experiencing a relief rally.
Last week we opened a trade on JPYUSD, following the breakout of one of my favourite patterns: a triangle!
We announced this trade live on the 6th of December.
At the moment, the cross is still hovering around the entry point. It tried to break down below the support zone, but was rejected a few times. Highs continue to decline, and this is a positive sign for our trade. We need the cross to go below 112 to enhance our probabilities of another successful trade. Our risk is set, and consequently our stop loss is in place. Should the log on EURUSD materialize, we should see USDJPY go lower amid the usual inverse correlation between the two crosses.
On the macro-news front this week, we need to signal the vote on Brexit to be held in the UK. It will be tomorrow 11th. The latest news is that the vote could be announced around 8:30 PM, but the time may change. Be very careful in managing your risk on the British pound. Also the euro might be severely impacted by the decision of the UK Parliament. We do not speculate on the direction and we will just stay away from the market or reduce our exposure.
Other news to keep an eye on are US CPI on Wednesday, the monetary policy announcement and press conference in Switzerland, and the interest rate decision, statement, and press conference for the Eurozone on Thursday, retail sales in the US and China (which will also announce the industrial production), and the PMI data in the Eurozone on Friday. Next Monday, the Eurozone CPI data will be announced.
On Monday the 10th of December, the euro dropped to 1.1352 against the dollar. This movement was facilitated by both technical and fundamental factors. The euro dragged the pound down with it, which plummeted against the dollar by 250 pips. The pound’s collapse was brought about by UK Prime Minister Theresa May’s decision to delay the parliamentary vote on her Brexit deal, which was scheduled for the 11th of December. The Prime Minister’s opponents have labelled her decision as cowardly.
Following the pound, investors intensified the euro selloff. The single currency came under added pressure from French President Emmanuel Macron’s decision to declare a national state of emergency in response to the protests sweeping the country.
The EURUSD pair’s decline gathered pace after the breakout of the trend line. The balance line didn’t even provide any support to the bulls. The drop came to an end beneath the 67th degree around the D1 line. The indicators on the H1 and H4 timeframes contradict each other: the H1 indicates a drop, while the H4 indicates a rise. Because of this, I’m predicting a drop to the 90th degree (1.1336) with a subsequent rebound to the balance line (1.1388). The rebound may happen sooner; from d1 (1.1345).
As 2018 draws to a close and the global equities markets continue to find pricing and valuation pressures driving prices lower, a few questions come to mind for all investors/traders – Is a deleveraging event about to unfold? What will it look like if it does happen and how can I protect my investments from such an event? This research article is going to help you answer those questions and should help to resolve any lingering questions you may have regarding the true nature of this market rotation and volatility.
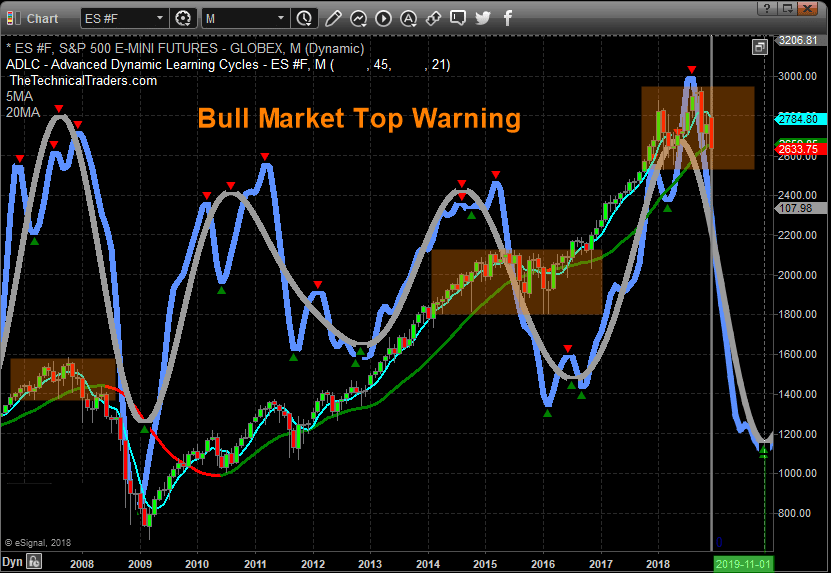
Our research team at TheTechnicalTraders.com has been digging through the data and charts in an attempt to identify key elements of this recent price move. We are starting with our Monthly Adaptive Dynamic Learning Cycles chart of the ES (E-mini S&P). As you can see from this chart, our ADL Cycles modeling system is showing a deep downside price rotation is likely to unfold over the next 8~12 months. One thing to remember about this chart is that these cycles and the width of the future cycle peaks and troughs are NOT indicative of price target levels. Therefore, this downside move is NOT suspected of reaching price lows near 1000 or 1200. These cycles are representative of a magnitude of cycle events. In other words, this current cycle, downward, is expected to be a major cycle event that establishes a major price bottom somewhere near the end of 2019 or early 2020.
We urge traders to understand the scope of this cycle event. Look at the previous cycle events on this chart. Numerous downside cycle events have taken place over the past 10+ years that represent somewhat similar down-cycle price moves. The most recent was in 2015~2016. This event represented a moderately deep down-cycle even that equated to a 300~400 point price rotation in the ES. If the current cycle event is relative in scope to the last, then this current down-cycle event will likely result in a 600~800 point price rotation, and we have already experienced a nearly 300 point rotation in the ES. This would suggest a potential price bottom near 2100~2300 on the ES if the scale and scope of the current cycle event are relative to the previous down-cycle event.
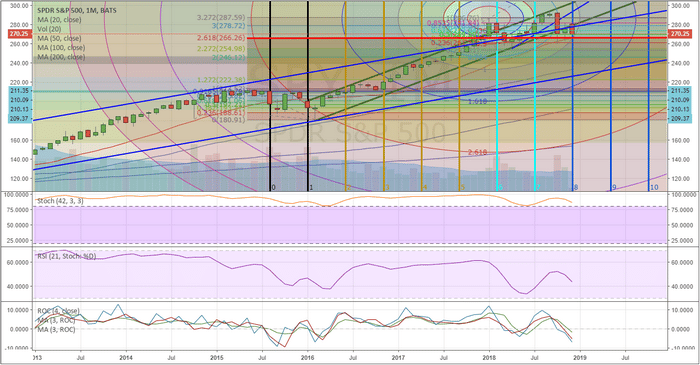
This next chart highlights key time/price cycles on the SPY Monthly chart to help us keep the timing of these events in perspective. As we have suggested, above, a major down-cycle even may be unfolding that results in a deleveraging even across the global markets. If this does, in fact, take place, there are a number of elements that will likely play out. First, currencies will fluctuate dramatically as deleveraging takes root. Capital will seek out and identify the safest and most suitable returns by rushing away from risky markets and into safer markets. Additionally, a prolonged deleveraging of global equities may take place where valuations are reduced as capital attempts to establish a balance between expectations and true market value. Overall, this is a very healthy event for the markets as long as it does not result in a total collapse of price, as we saw in 2008-09.
This SPY chart highlights three key components of the markets current setup. First, the RED LINE (a 2.618 Fibonacci extension from the 2015-2016 price rotation at $266.50) is acting like a strong support level in the markets. This level, along with the 2018 lows near $254.78, are important levels that we are watching to determine if any further downside price activity is unfolding. As long as these two levels are not breached to the downside, we can confidently say that the upside trend is still intact. Second, the two BLUE price channels, which originate from the 2009 market bottom, establish a powerful upside price channel that will act as critical support should price reach near the lower level of this channel. This means that any downside price rotation will likely find solid support near $232.00 or higher. Lastly, the vertical time/price series cycles are suggesting that May and Oct of 2019 are likely to prompt significant price reversal patterns/setups. This helps us to understand that any potential breakout moves (up or down) will likely reach some critical inflection point, or reversal points, near May and October of 2019.
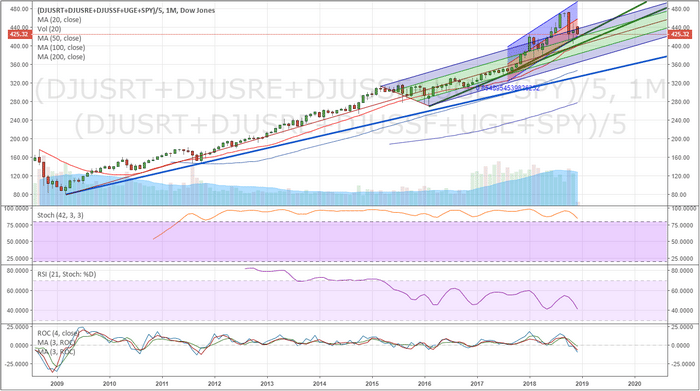
Next, we fall back to our Custom US Market Index chart on a Monthly basis. This chart, again, shows the support level originating from the lows of 2009 in a heavy BLUE line as well as two price channel levels that represent current price ranges. The first thing we want you to focus on is the breadth of the current rotation within the regression channel on this chart (the red/blue shorter price channel). Currently, the price is within this standard regression channel and has yet to break the longer-term, more aggressive, upward price channel. Additionally, we can see from this chart that the recent price activity is still measurably above the 2018 price lows near 374.12. Secondly, the Pitchfork channel, originating from the 2009 lows and spanning the range of the 2015~2016 price rotation, provides additional confirmation that we are still well above the middle and lower areas of this price channel. Even if the current price did fall by another 4~8%, the price would still be within the normal channel levels of this extended upside price channel.
So, when we consider the scale and scope of this current downside price rotation, we have to be very aware of the real expectations of the market. Yes, it looks frightening when we see it on a Daily or Weekly chart. But when we consider the real reality of the long-term perspective, we can begin to understand how the price is reacting to the recent upside acceleration since 2017.
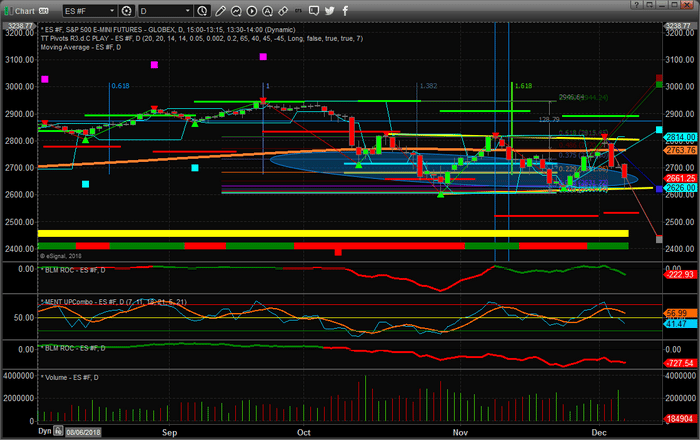
Lastly, this Daily ES chart is showing what we believe is the most important data of all and why all traders need to understand the risks involved in this rotating market. First, this chart shows our Adaptive Dynamic Learning Fibonacci price modeling system and the results of this chart are clear to our team or researchers – although it might be a bit cluttered to you. So we’ll try to explain the basic components of this chart for you.
The heavy RED and GREEN levels that are drawn above and below the price action are the Fibonacci Price Trigger levels. These indicate where and when we would consider a new price trend to be “confirmed” As you can see, the most recent “confirmed” trigger happened on Oct 10 with a huge breakdown of price confirming a bearish price trend. Since then, these Fibonacci Price Trigger Levels have expanded outside price as volatility and price rotation has also expanded. This indicates that price will have to make a bigger push, higher or lower, to establish any new confirmed price trend based on this modeling system.
There are two heavy YELLO lines bordering recent price rotation on this chart that help us to understand a rather wide flag/pennant formation appears to be forming within these rotation/channel levels. For example, the absolute low of the current bar touched this lower YELLOW level and rebounded to the upside very sharply. It is very likely that a washout-low price pattern executed today that may provide further price support near 2626 in the ES in the immediate future. Either way, the price will have to exit this YELLOW price channel if it is going to attempt any new upside or downside price trends. As long as it stays within this channel, we have a defined range that is currently between 2626 and 2800.
Lastly, the LIGHT BLUE oblique has been our estimated critical support level in the ES since our September 17 market call that a 5~8% downside price rotation was about to hit the markets. This level was predicted by our ADL predictive price modeling system and has been confirmed, multiple times, by price over the past few months. It is very likely that this level will continue to act as major support going forward and will be the last level of defense if price attempts a downside price move. In other words, as we stated above, 2600~2680 is a very strong support range in the markets right now. Any breakdown below this level could push the markets toward the 2018 price lows (or lower). As long as this level holds, we could see continued deleveraging in the markets as US Dollar, Energy, Commodity, Currency or global market price weakness while the US markets attempt to hold above the 2018 lows.
Pay very close attention to our Fibonacci price modeling and US Custom Index charts, above, because we believe these charts paint a very clear picture. Yes, a deleveraging event is likely already unfolding in the global markets. It has been taking root in various forms over the past 12+ months in all reality. The US markets are continuing to shake off the downside pricing pressures that we’ve seen in other global markets, and this is likely due to the “capital shift” event that is also unfolding throughout the globe.
Our advice for active traders would be to consider drastically reducing your trading sizes as well as pare back your open long positions if you are concerned about a market breakdown. Our modeling systems are suggesting we have many months of rotation within the market to reposition and evaluate our plans for future success. Unless the 2018 lows and the multiple critical support levels we’ve highlighted are threatened, we believe this rotation is nothing more than standard price rotation with acceptable ranges (see the charts above again if you have questions). Yes, there is still concern that a price breakdown may unfold and we are certainly seeing a deleveraging event taking place. We are not calling for a price collapse at the moment, and we have explained the reasons why we believe our research is accurate.
Use the best tools you can to assist you, just as we do for our members. The only thing you can do in a situation like this is taking factual data, evaluate the true price data and make an educated and logical conclusion about the markets. If you want to learn how we help our clients find and execute better trades and how we are preparing to make 2019 an incredibly successful year with our members, then visit TheTechnicalTraders.com and see what we offer our members.
The USD strengthened against the major currencies despite the weak economic stats and overall weakened expectations regarding the increase of the key interest rate. The USD index (#DX) closed in the green (+0.73%).
The pound is under pressure due to the ambiguousness regarding Brexit. Today the House of Commons should have had a vote regarding the Brexit agreement. However, Theresa May canceled the vote. The experts are thinking that the Prime Minister is afraid that the Parliament will decline her offer and hopes to convince them otherwise in the mean time.
The prices on oil are consolidating after a recent descent. The WTI futures are testing the 51 USD/barrel mark. At 23:30 (GMT+2) the API will publish a report regarding the reserves of the crude oil.
Market indicators
Yesterday the US stock market had a bullish mood: #SPY (+0,19%), #DIA (+0,16%), #QQQ (+1,05%).
The US Treasury bonds 10-year yield is 2,86-2,87%.
The News Feed for 11.12.2018:
– Labour Market reports (UK) – 11:30 (GMT+2:00);
– Economic Mood Index ZEW (GER) – 12:00 (GMT+2:00);
– Manufacturers’ Price Index (US) – 15:30 (GMT+2:00).
One of the best-performing currencies among the G10 in the last few weeks is NZD. I am going to use the example of the NZDUSD to show you how well the Kiwi is doing. The pair was rising even amid global turmoil, and it should be quite the opposite given that NZD tends to make most of its gains in risk OFF mode. Not anymore.
A proper upswing started here at the beginning of October. The pair managed to form a healthy uptrend supported by the black line. The trend is very technical as it has already paused two times with very clean correction patterns: a flag and a wedge (blue). At the end of November, buyers broke a crucial long-term resistance around 0.682 (green), which had been respected since May 2017. The new week started with a breakout of the upper line of the wedge and the horizontal resistance at 0.6888 (orange). This is a positive factor and puts the bulls on top.
In this case, the buy signal is ON as long as we stay above the green line. The chances that we will end 2018 close to yearly highs are very high. My view on this pair is 100% bullish.
President Duterte’s recalibration of Philippine foreign policy has the potential for greater stability in the region. But it has unleashed the wrath of media pundits and economic hitmen.
During President Xi Jinping’s visit to Manila, some 30 bilateral agreements were signed. A memorandum of understanding (MOU) on cooperation on oil and gas development in the South China Sea topped the list of deals in trade and investment, infrastructure, and cooperation on the Belt and Road Initiative.
Duterte’s recalibration seeks to couple longstanding relations with the U.S. with Sino-Philippine economic cooperation. It is a balancing act, not an act of exclusion. In contrast, there was an element of exclusion in the foreign policy in the Aquino era when good relations with Washington were seen to require distance from China.
Today, some critics of the Duterte policies push similar exclusionary ideas seeking to misrepresent or undermine the Sino-Philippine rapprochement. Ostensibly, this occurs in the name of Philippine national interest, yet these pundits and hitmen are affiliated by external economic and geopolitical interests.
Let’s take a closer look at just two such examples. Neither is an isolated case. More recent examples abound. And still more are likely to occur in the future.
Media pundits and geopolitical interests
A year ago, the Asia Maritime Transparency Initiative (AMTI), a U.S. think-tank, published a release about “A Constructive Year for Chinese Base Building.” What made the long report intriguing were the many satellite photos and aerial imagery. Yet, the pre-Christmas release did not generate much chatter.
A month later, Richard Heydarian, portrayed as an independent academic and policy adviser, released an AMTI update, “ASEAN Under Duterte: Lost Opportunities on the South China Sea” (Jan 12, 2018). Heydarian complained that “under Duterte’s watch, ASEAN has lost a crucial opportunity to hold China to account.” Thereafter, GMA News headlined his “take on PHL allowing China to do maritime research in Benham Rise” (January 23, 2018). He was portrayed as “GMA News resident analyst.” No mention was made about his author affiliation with AMTI.
To foster debate, the Inquirer’s Frances Mangosing released another “exclusive” entitled “New photos show China done with its militarization of South China Sea” (Feb 4, 2018). The “source” of aerial photos was not identified, but the photos were reminiscent of those published previously by the AMTI. That led to a new – this time anonymous – AMTI release based on Inquirer’s story, which noted that most images “were taken in late 2017 by an unspecified patrol aircraft from an altitude of 1,500 meters” (Feb 16, 2018). It was followed by Mangosing’s new piece, “Kagitingan Reef may be China’s ‘intelligence hub’ in Spratlys – US think-tank” (Feb 18, 2018), based on the AMTI release.
In reality, AMTI is a subsidiary of the Center of Strategic and International Studies (CSIS), a multimillion-dollar U.S. think-tank led by members of U.S. government, State Department, Congress and Pentagon. Heydarian is a member contributor of the AMTI, the CSIS, and Council for Foreign Relations. His Twitter account is visualized by the UK-based International Institute for Strategic Studies (IISS), which is pushing an “Indo-Pacific Age” in Asia – which just happens to be the name of Heydarian’s forthcoming book.
That leaves the mystery of the source of the satellite photos. In addition to CSIS/AMTI, they belong to DigitalGlobe, which is a U.S. multibillion-dollar vendor of space imagery and geospatial content. In 2016, DigitalGlobe teamed up with Amazon, which has a $600 million 10-year cloud deal with the CIA, and CIA’s venture arm In-Q-Tel which has been active in Silicon Valley since 1999.
There is nothing illegitimate about such affiliations or the content they produce. But they are beholden mainly to U.S. geopolitical interests. Truthful journalism should acknowledge such linkages, not suppress them.
Hitmen and economic interests
Since 2016, President Duterte has pushed an infrastructure investment program which relies on sustained growth at close to 7% per year. The strategy is to become an upper middle-income economy by early 2020s. Yet, the effort has been almost systemically misreported internationally.
In May 2017, Philippine Department of Budget and Management (DBM) estimated that $167 billion would be spent on infrastructure during Duterte’s six-year term. A day later, Forbes released a widely-distributed commentary, which alleged that this debt “Could Balloon to $452 Billion: China Will Benefit.” The author, Anders Corr, expected the Philippine government debt of $123 billion to soar to $290 billion. Assuming that most monies would come from China and with excessive mafia-type interest rates, Corr argued that with accrued interest Philippines would end up in debt bondage as debt-to-GDP ratio would balloon to a world-record of 296%.
Like Heydarian, Corr was framed as an independent observer. Yet, according to his own testimony and that of U.S. Naval Institute, he has done “field research” in Vietnam, the Philippines, and Taiwan. He has had “deals” with Pentagon on Russia and Ukraine. In Afghanistan he has served US Pacific Command and U.S. Special Operations Command Pacific for U.S. national security in Asia.
After the 2017 Forbes debacle, Corr seemed to disappear from public debates. Now he’s back, particularly in Australia. He has urged Trump to get tougher in South China Sea, bullied Pakistan with sanctions, advocated US nuclear weapons against North Korea and blamed China for being the ringleader of global terrorism. Despite grossly failed projections, he continues to be used an “expert” by major media.
Corr also has his media trolls. In August 2017, Singaporean-based ASEAN Today, which has many references to Corr’s pieces, published his Forbes piece with the new title: “Is the Philippines heading into a debt crisis?” Maybe the idea was to divide the ASEAN Summit, which Duterte would host weeks later. Yet, the piece was signed by ASEAN Today’s editor Oliver Ward. Interestingly, Ward does not reside in Singapore, but in Boston, U.S. where he also contributes to The Hill Reporter and OpenDemocracy sites, which are funded by Soros foundations and National Endowment for Democracy (NED). Around the same time, the NED also hosted the launch of Heydarian’s critical book on Duterte in the U.S.
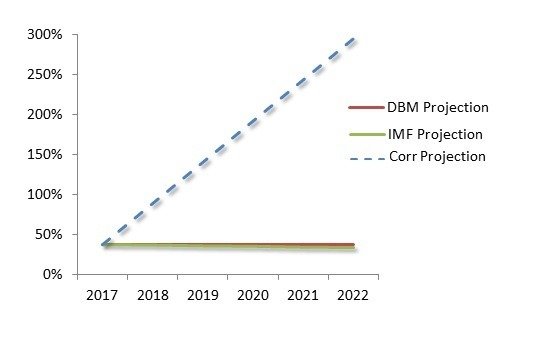
So what’s the truth about the alleged “debt bondage”? Let’s compare these forecasts with IMF projections. Between 2017 and 2022, the DBM estimated the debt would mildly decline. My estimate was slightly more conservative because I expect trade wars to have some adverse impact toward 2019-2020. In contrast, Corr claimed Philippine debt-to-GDP ratio would soar to 300% of GDP by 2022. In reality, IMF’s forecast is closely aligned with my projection and that of DBM. In contrast, Corr’s “projections” have nothing to do with reality (Figure).
Figure Philippines Government Debt, 2017-22E (% of GDP)
The lessons
The moral of the story is that, in the Philippines debate about China and the U.S., independent analysts may sometimes be not that independent. Transparent initiatives may at times prove very opaque. Democracy organizations may promote anti-democratic goals. And even reputable reporters, observers and economic analysts may occasionally serve as assets for external interests – knowingly or not.
In such circumstances, mainstream news may be less about actual news than about carefully choreographed exercises of soft power.
About the Author:
Dan Steinbock is the founder of Difference Group and internationally recognized expert of the multipolar world economy. He has served at the India, China and America Institute (US), Shanghai Institute for International Studies (China) and the EU Center (Singapore). For more, see http://www.differencegroup.net/
The original commentary was released by The Manila Times on December 11, 2018
This week will surely be the most emotional time for the United Kingdom and its currency. On Tuesday December 11th, the British Parliament will vote on approving the Brexit agreement with the European Union. Earlier, the European Commission agreed principle terms of the document and now comes the most difficult part – to make British policymakers approve it. There are many opposition-minded members in the British Parliament, who have been criticizing the Prime Minister Theresa May’s plan from the very beginning. Nevertheless, her plan is considered as a “soft” exiting strategy, others are reported to be much worse.
Investors have a lot of doubts that policymakers will approve the agreement on the first try. There is a chance that no decisions will be made on Tuesday: it has been well rumored on the market that the voting might be postponed. However, the delay will hardly change anything: the United Kingdom will either exit the European Union with minimal losses or have to follow the “tough” scenario and damage the country’s economic and financial system.
There will be many reports from the United Kingdom in the economic calendar this week; however, investors might not pay a lot of attention to them due to the Brexit-related news.
The most interesting numbers will be the Industrial Production and the GDP in October, along with the CB Leading Index and several reports on the British Labor market.
In case of GBPUSD, the descending tendency continues, but not very quickly. The downside target may be the support line of the major channel at 1.2525. At the same time, there is a convergence on MACD, which may indicate a new impulse to the upside as a correction of the mid-term downtrend. However, such correction may start only after the price breaks the current short-term resistance at 1.2780. The target of this ascending correction may be the resistance level of major channel at 1.3040.
Disclaimer
Any predictions contained herein are based on the authors’ particular opinion. This analysis shall not be treated as trading advice. RoboForex shall not be held liable for the results of the trades arising from relying upon trading recommendations and reviews contained herein.