USD is weakened against the major currencies after the ambiguous economic reports. The Consumer Price Index in November did not grow while the experts expected 0.1%. The basic Consumer Price Index remained at 0.2%. The pressure on the USD is put by the Federal Reserve deciding to increase the key interest rate next year. The investors are waiting for the final decision from Federal Reserve which should be released next week. The USD index (#DX) closed in the red (-0.35%).
GBP is rising due to the voting on confidence in Theresa May. May was supported by 200 out of 317 conservatives and overcame the Votum of No Confidence. She also claimed that will leave the post of the Prime Minister in 2022 and will spend the remaining time trying to convince the Parliament to accept the terms of the Brexit agreement.
The prices on oil are consolidating. At the moment the WTI futures are testing the 51.25 USD/barrel mark.
Market Indicators
The prices on oil indicate the bullish mood: #SPY (+0,50%), #DIA (+0,68%), #QQQ (+0,88%).
The 10-year yield of the US Treasury bonds keeps recovering. At the moment it is at 2.90-2.91%.
The Economic News Feed for 13.12.2018:
– Bank of Switzerland’s vote on the key interest rate – 10:30 (GMT+2:00);
– ECB vote on the key interest rate – 14:45 (GMT+2:00).
On Wednesday the 12th of December, trading on the euro closed up. Its rise was brought about by news from Italy as well as the strengthening of the pound. The Italian government is willing to agree to a budget deficit target of 2%, while Theresa May won a vote of no confidence among Conservative MPs. The euro rose to 1.1387 and is currently undergoing a correction.
Day’s news (GMT+3):
10:00 Germany: CPI (Nov).
10:45 France: CPI (Nov).
11:30 Switzerland: SNB interest rate decision.
12:00 Switzerland: SNB press conference.
12:15 Switzerland: producer and import prices (Nov).
15:45 Eurozone: ECB interest rate decision.
16:30 Eurozone: ECB monetary policy statement and press conference.
My expectations of a rise on the EURUSD pair yesterday were proven correct. On the back of a weaker dollar and stronger euro crosses, the bulls managed to break through the trend line at 1.1443. I’ve decided not to make a forecast today because Mario Draghi has a press conference at 16:30 (GMT+3). This will have a profound effect on currency pairs involving the euro, so there’s no point making any predictions. Draghi may strengthen the euro at the beginning of the press conference, thereby triggering the bears’ stop levels, only to bring it down later. On the other hand, he could set up his speech to initially sink the euro to trigger pending long orders, and then send the euro skyrocketing. The range for potential fluctuations is 1.1315 – 1.1440.
EURUSD has completed another descending impulse, which may be considered as the third wave inside the downtrend with the target at 1.1310. Possibly, today the pair may be corrected to reach 1.1344 and then form the fifth structure towards 1.1266.
GBPUSD, “Great Britain Pound vs US Dollar”
GBPUSD has completed another ascending structure towards 1.2638; right now, it is still trading downwards with the target at 1.2470. Today, the pair may form one more ascending structure to reach 1.2550 and then start a new decline towards the above-mentioned target. Later, the market may start another growth to return to 1.2550.
USDCHF, “US Dollar vs Swiss Franc”
USDCHF has broken 0.9900 upwards and reached its short-term target. Possibly, today the pair may return to 0.9900 and then form one more ascending structure with the first target at 0.9947. Later, the market may be corrected to return to 0.9900 one more time and then continue trading inside the uptrend with the target at 1.0000.
USDJPY, “US Dollar vs Japanese Yen”
USDJPY has reached its upside target. Today, the pair may form a new descending structure with the first target at 112.70 and then grow to reach 113.10. After that, the instrument may start a new decline to break 112.42 and then continue trading inside the downtrend with the short-term target at 111.40.
AUDUSD, “Australian Dollar vs US Dollar”
AUDUSD is still consolidating around 0.7200. Possibly, today the pair may grow towards 0.7245 and then fall to return to 0.7200. If later the instrument breaks this range to the upside, the price may be corrected to reach 0.7277; if to the downside – resume trading inside the downtrend with the short-term target at 0.7077.
USDRUB, “US Dollar vs Russian Ruble”
USDRUB is consolidating in the center of the range around 66.47. Today, the pair may expand the range towards 65.73. In case the price breaks the range to the downside, the instrument may continue trading inside the downtrend with the short-term target at 64.00.
XAUUSD, “Gold vs US Dollar”
Gold is consolidating around 1243.38. Possibly, the pair may be corrected downwards to reach 1235.90 and then start another growth towards 1252.30.
BRENT
Brent is still consolidating around 60.10. Possibly, the pair may form a new descending structure to reach 58.30. If later the instrument breaks this range to the upside, the price may resume trading inside the uptrend with the short-term target at 67.77.
Attention! Forecasts presented in this section only reflect the author’s private opinion and should not be considered as guidance for trading. RoboForex LP bears no responsibility for trading results based on trading recommendations described in these analytical reviews.
As we can see in the H4 chart, after breaking the low at 1.2661, GBPUSD started a new descending impulse, which is heading towards the post-correctional extension area between the retracements of 138.2% and 161.8% at 1.2420 and 1.2270 respectively. At the same time, there is a convergence on MACD, which may indicate a new pullback after the instrument reaches its short-term downside targets. The key resistance is at 1.2813.
The H1 chart shows more detailed structure. There is a convergence on MACD. Possibly, after reachi9ng 1.2420, the pair may start a new short-term correction to reach the retracement of 50.0% at 1.2616.
EURJPY, “Euro vs. Japanese Yen”
In the H4 chart, EURJPY was trying to test the local support at 127.50 while forming the current descending impulse. If the price breaks the above-mentioned level, the pair may fall to reach the post-correctional extension area between the retracements of 138.2% and 161.8% at 126.82 and 126.40 respectively. The current rising impulse is intended to expand the correctional channel after reaching the local high at 129.28. After breaking this level, the instrument may continue growing towards the key resistance at 130.15.
As we can see in the H1 chart, after finishing the correction, the pair has started a new impulse to the upside. The short-term target is the high at 128.98. If the price breaks it, the instrument may continue growing towards the post-correctional extension area between the retracements of 138.2% and 161.8% at 129.28 and 129.48 respectively. The support is the low at 128.17.
Attention! Forecasts presented in this section only reflect the author’s private opinion and should not be considered as guidance for trading. RoboForex LP bears no responsibility for trading results based on trading recommendations described in these analytical reviews.
The EUR/USD keep having a negative dynamic. The demand on the USD remains due to recovery of the US Treasury bonds yield and positive reports. The EUR is consolidating. The local support and resistance are 1.13100 and 1.13350. The trading instrument can descend further. Investors expect important stats from the US.
The Economic News Feed for 12.12.2018:
– Inflation Report (US) – 12:00 (GMT+2:00);
The price fixed below 50 MA and 200 MA which indicates the power of the buyers.
MACD is in the negative zone but above the signal line, which gives a weak signal to sell EUR/USD.
The Stochastic Oscillator is in the neutral zone, the %K line is below the %D line, which indicates a bearish mood.
Trading recommendations
Support levels: 1.13100, 1.12800, 1.12500
Resistance levels: 1.13350, 1.13700, 1.14000
If the price fixes below the support 1.13100, expect further descend towards 1.12800-1.12500.
Alternatively, the quotes can recover toward 1.13500-1.13750.
The GBP/USD currency pair
Technical indicators of the currency pair:
Prev Open: 1.25557
Open: 1.24846
% chg. over the last day: -0.55
Day’s range: 1.24763 – 1.25497
52 wk range: 1.2510 – 1.4378
GBP/USD keeps falling. The trading instrument updated the local minimums. GBP remains under pressure due to the Brexit conundrum after Theresa May cancelled the vote regarding the country leaving the EU. We recommend you keep an eye on the issue. The quotes are consolidating around 1.24850-1.25400.
The News Feed is calm for today.
Indicators show the power of the sellers. The price is below 50 MA and 200 MA.
The MACD histogram is in the negative zone but above the signal line, which indicates a weak bearish sentiment.
Stochastic Oscillator is in the overbought zone, the %K line crosses %D line. There are no signals at the moment.
Trading recommendations
Support levels: 1.24850, 1.24500
Resistance levels: 1.25400, 1.25800, 1.26300
If the price fixes below 1.24850, the GBP/USD quotes are expected to fall. The movement is tending to 1.24500-1.24250.
An alternative could be a growth in the GBP/USD currency pair to 1.25800-1.26000.
The USD/CAD currency pair
Technical indicators of the currency pair:
Prev Open: 1.33986
Open: 1.33892
% chg. over the last day: -0.12
Day’s range: 1.33703 – 1.33958
52 wk range: 1.2248 – 1.3445
USD/CAD has an ambigous technical picture. CAD is being traded in flat with local support and resistance being 1.33700 and 1.34000. The USD/CAD quotes have prospects for growth. The US inflation report is in the spotlight. You should open positions from the key levels.
The News Feed for Canada is calm.
The indicators do not provide singals: the price has crossed 50 MA.
The MACD histogram is around 0.
The Stochastic Oscillator is in the neutral zone, the %K line is below the %D line, which points towards the decline of the USD/CAD quotes.
Trading recommendations
Support levels: 1.33700, 1.33300, 1.32900
Resistance levels: 1.34000, 1.34200, 1.34450
If the price fixes above 1.34000, further growth of the USD/CAD quotes is expected. The movement is tending to 1.34300-1.34500.
Alternative option. If the price fixes below 1.33700, we recommend looking for market entry points to open short positions. The movement is tending to 1.33300-1.33000.
The USD/JPY currency pair
Technical indicators of the currency pair:
Prev Open: 113.317
Open: 113.364
% chg. over the last day: +0.04
Day’s range: 113.309 – 113.516
52 wk range: 104.56 – 114.56
USD/JPY is consolidating around 113.500. 113.250 is the mirror support. The trading instrument has prospects for growth. The financial market participants expect reports from the US and new data regarding the Treasury bond yield. Positions should be opened from the key levels.
The price has crossed the 200 MA and 50 MA which points towards a bullish mood.
The MACD histogram is in the positive zone but below the signal line, which gives a weak signal to buy USD/JPY.
The Stochastic Oscillator is in the neutral zone, the %K line crosses the %D line. There are no signals at the moment.
Trading recommendations
Support levels: 113.250, 113.000, 112.750
Resistance levels: 113.500, 113.750
If the price fixes above the support level of 113.500,, it is necessary to consider buying USD/JPY. The movement is tending to 113.750-114.000.
An alternative could be the descend of the USD/JPY quotes to 113.000.
The USD strengthened against the basket of other currencies due to the recovery of the US Treasury bonds 10-year yield. The USD index updated the monthly maximum and closed in the green (+0.18%). Also yesterday the US published the Manufacturer’s Price Index which grew by 0.1% in November, just as the experts predicted. Today we expect essential reports from the US.
The GBP remains under pressure due to the Brexit conundrum. Yesterday’s reports from the UK labor market are also somewhat ambiguous. For example, the average wage grew by 3.3% while the experts expected 3.0%. The September`s growth was also re-reviewed and closed at 3.1%. However, the number of requests for the unemployment benefits grew to 21.9K instead of 13.2K. The data from October was also re-reviewed from 20.2K to 23.2K.
Prices on oil moderately grew. The WTI futures are at 51.95 USD/barrel. At 17:30 (GMT+2) the report on the US crude oil reserves will be published.
Market Indicators
The US stock market had a variety of trends yesterday: #SPY (+0,02%), #DIA (-0,20%), #QQQ (+0,33%).
The US Treasury bond 10-year yield started to grow. Right now it is at 2.88-2.89%
On Tuesday the 11th of December, trading on the EURUSD pair closed down. The single currency’s slide against the greenback was facilitated by a broadly stronger dollar, a statement from Italian Finance Minister Giovanni Tria, and a drop in German 10-year bond yields ahead of the ECB meeting.
The exchange rate dropped to 1.1306. German bond yields fell due to a selloff of Italian and French bonds. Giovanni Tria announced that the government isn’t planning any major changes to its budget. French President Emmanuel Macron tried to quell the protests in Paris with wage increases and tax cuts. The GBPUSD pair dropped amid uncertainty surrounding Brexit.
Day’s news (GMT+3):
13:00 Eurozone: industrial production (Oct).
16:30 Canada: capacity utilisation (Q3).
16:30 US: CPI (Nov).
18:30 US: EIA crude oil stocks change (7 Dec).
22:00 US: monthly budget statement (Nov).
Fig 1. MA channel on the EURUSD hourly chart.
Current situation:
On the back of a rise in European stocks, euro bulls managed to test the 1.14 mark around the 45th degree. From there, the rate plummeted 94 pips. I’ve listed the reasons for this drop above. The pair has exited the upwards channel (dashed line), and is currently trading beneath it.
In my forecast, I expect to see the pair recover to the LB balance line and the 45th degree. Since there’s a slight divergence between the indicators on the H1 and H4 timeframes, I’m expecting an initial drop to 1.1317 followed by a rise to 1.1356. As I’ve mentioned above, there’s a multitude of levels here from various methods of technical analysis. I can’t see the pair rising any further than 1.1380.
External factors for the euro remain negative. Taking into account that the ECB is holding a meeting on Thursday, it would be nice to see a pullback to 1.1360. Trading around the balance line would suit both the bulls and the bears. If 1.1300 doesn’t hold up, we’ll get a drop to 1.1248 (D3).
I will start this analysis by telling you that in the past few months, the movements on gold have been a bit, let’s say, weird. Gold is not behaving as it has been over the past few years. The correlation between the USD and the risk ON/OFF mode seems broken. Gold is following its own path. Luckily, technical analysis works in any situation and this is what we will focus on now.
For the past few weeks, gold has had only one crucial resistance, which was the 38.2% Fibonacci of the main downtrend. 38.2% finally got broken. Does this mean that we have a change in long-term sentiment on gold? Unfortunately for buyers, the answer is no. The long-term sentiment remains negative and let me explain why. First of all, we are still inside the mid-term flag formation (black lines). The flag is a trend continuation pattern and it was created after a deep drop, which promotes a further drop. The price is currently bouncing from the upper line of this formation, which only confirms this pattern and my previous sentence. Yes, the breakout of 38.2% is a crucial development in the mid-term, but it doesn’t change the big picture.
In my opinion, we can start being optimistic only after a breakout of the upper line of the flag or after a breakout of the 50% Fibonacci. I think that the current scenario is the price testing 38.2% from the top. In other words, we’re going to get a short-term drop followed by a mid-term upswing.
If you are a U.S. resident that invested in Bitcoin or other cryptocurrencies in 2017, you may have recently received a tax document from the trading platform or cryptocurrency exchange you use and may need to pay taxes. While there is currently very little guidance on the taxation of cryptocurrency, one thing is clearly defined. The Internal Revenue Service (IRS) views cryptocurrency as property for tax purposes. That means you likely received a tax document because you either experienced a capital gain on that virtual investment in 2017 or received cryptocurrency as compensation, which is seen as ordinary income to the IRS.
For practical purposes, the IRS has issued guidance defining cryptocurrency such as Bitcoin and Ethereum as virtual currencies. This guidance is subject to interpretation, but for most people the main things to consider from a tax perspective are:
How long you held your Bitcoin or other cryptocurrencies from purchase to sale? If held for less than a year, any profit may be liable for short-term capital gains tax. If held for longer than a year, any profit may be liable for long-term capital gains tax.
What is your tax filing status and taxable income? That will determine your tax bracket and the tax rate on any Bitcoin profits.
What is your state tax rate? That will determine how much you may owe in state taxes.
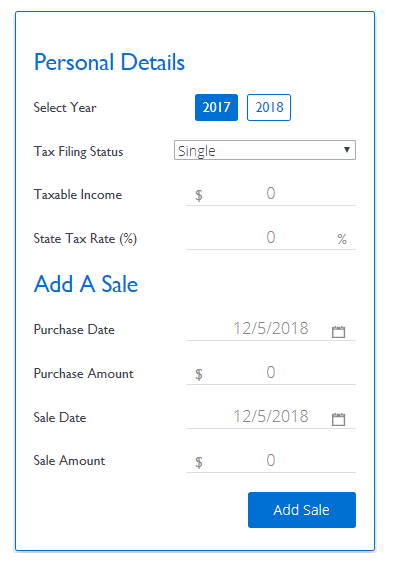
Bitcoin Tax Calculator Instructions
Part 1: Enter Your Personal Details
Step 1: Select the tax year you would like to calculate your estimated taxes. Step 2: Select your tax filing status. Step 3: Enter your taxable income excluding any profit from Bitcoin sales. For most people, this is the same as adjusted gross income (AGI). Step 4: Enter your state’s tax rate.
Part 2: For each Bitcoin sale within a tax year
Step 1: Enter the purchase date and purchase price. The purchase date can be any time up to December 31st of the tax year selected. Step 2: Enter the sale date and sale price. Make sure the sale date is within the tax year selected. Step 3: Repeat for all Bitcoin or cryptocurrency sales within the tax year selected.
Bitcoin Tax Calculator
Example Bitcoin Tax Situation
This example calculates estimated taxes for the 2018 tax year for a person that made two sales. All values are in USD.
Person A Tax and Finance Details
2018 Taxable income – 80,000 2018 Filing Status – Single 2018 State tax rate – 5%
Transaction #1
On Feb. 1, 2018, Person A sold Bitcoin for a total of $10,000. That Bitcoin was previously purchased on June 1, 2017 for $5,000. Since it was held for less than a year, the $5,000 profit is subject to short-term capital gains tax rates. Based on Person A’s filing status and income, the taxes are calculated as follows:
The first $2,500 in profit is taxed at the 22 percent federal tax rate.
The remaining $2,500 is taxed at the 24 percent federal tax rate.
The entire $5,000 taxed at the 5 percent state tax rate.
$2,500 X 22 percent + $2,500 X 24 percent = $1,150 federal taxes owed on short-term capital gains
$5,000 X 5 percent = $250 state taxes owed
$1150 + $250 = $1,400 total tax liability for transaction #1
Transaction #2
On Mar. 1, 2018, Person A sells Bitcoin for a total of $10,000. That Bitcoin was purchased on Feb. 1, 2017 for $3,000. Since it was held for longer than a year, the $7,000 profit is subject to long-term capital gains tax. In addition, Person A’s taxable income is now calculated at $85,000 to include the income from the previous sale. The taxes are calculated as follows:
The entire $7,000 is taxed at the 15 percent long-term capital gains tax rate.
The entire $7,000 is taxed at the 5 percent state tax bracket.
$7,000 X 15 percent = $1,050 federal taxes owed onlong-term capital gains
$7,000 X 5 percent = $350 state taxes owed
$1,050 + $350 = $1,400 total tax liability for transaction #2
Total Taxes Owed
Since both long-term and short-term capital gains are positive, the total taxes owed are calculated as follows:
$1,150 federal short term capital gains + $1,050 federal long term capital gains + $600 state taxes owed = $2,800 total taxes owed
As we can see in the H4 chart, USDCAD has once again reached the resistance level and formed several Shooting Star, Hanging Man, and Long-Legged Doji reversal pattern. Judging by the previous movements, right now it may be assumed that right now the instrument may form another correction and then resume its ascending movement.
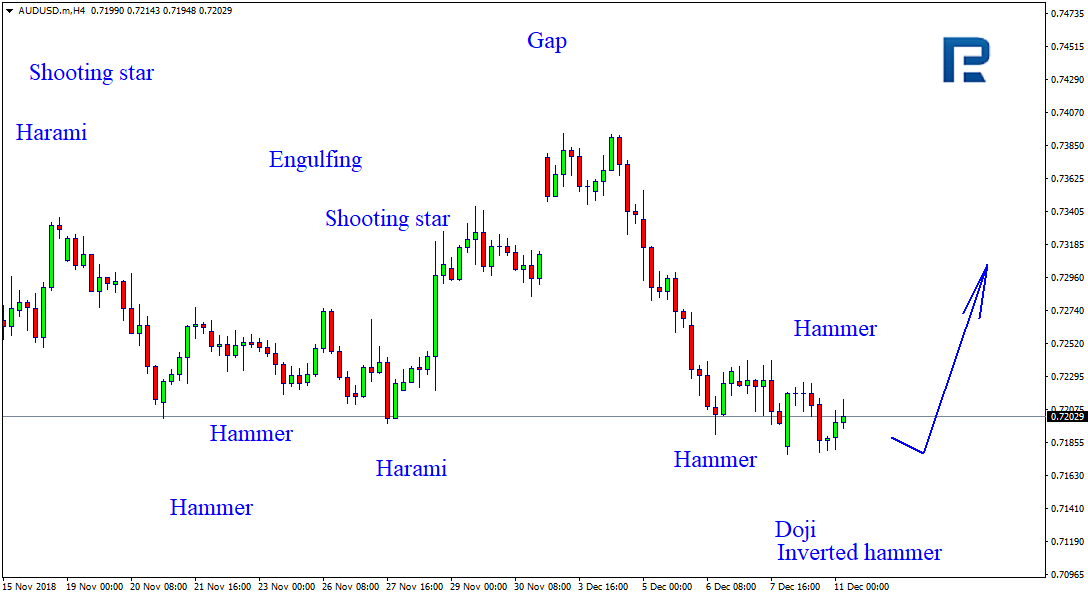
AUDUSD, “Australian Dollar vs US Dollar”
As we can see in the H4 chart, AUDUSD is still trading close to the support level and forming Hammer, Doji, and Inverted Hammer reversal patterns. Judging by the previous movements, it may be assumed that after finishing the correction the instrument may resume moving inside the uptrend.
Attention! Forecasts presented in this section only reflect the author’s private opinion and should not be considered as guidance for trading. RoboForex LP bears no responsibility for trading results based on trading recommendations described in these analytical reviews.