EURUSD is consolidating around 1.1140. Possibly, today the pair may fall to wards 1.1111 and then start another growth to return to 1.1140, thus forming a new consolidation range. If later the price breaks range to the upside, the instrument may be corrected to reach 1.1180; if to the downside – resume trading inside the downtrend with the target at 1.1080.
GBPUSD, “Great Britain Pound vs US Dollar”
GBPUSD is consolidating around 1.2912. If later the price breaks range to the upside, the instrument may start a new correction to reach 1.2962; if to the downside – resume trading inside the downtrend with the target at 1.2790.
USDCHF, “US Dollar vs Swiss Franc”
USDCHF is consolidating above 1.0180. Today, the pair may form one more ascending structure to break 1.0230 and then continue growing with the target at 1.0290. However, if the price breaks 1.0180 to the downside, the market may be corrected towards 1.0130.
USDJPY, “US Dollar vs Japanese Yen”
USDJPY has failed to fix above 111.87; it has broken this level instead, formed a downside continuation pattern, and reached 111.37. Possibly, today the pair may be corrected to return to 111.87. Later, the market may form a new descending structure with the target at 111.60.
AUDUSD, “Australian Dollar vs US Dollar”
AUDUSD is consolidating around 0.7027. If later the price breaks range to the upside, the instrument may be corrected to reach 0.7065; if to the downside – resume trading inside the downtrend with the target at 0.6930.
USDRUB, “US Dollar vs Russian Ruble”
USDRUB has completed the correction at 64.85. Today, the pair may start consolidating around 64.66. If later the price breaks range to the downside, the instrument may continue trading inside the downtrend with the target at 63.66.
XAUUSD, “Gold vs US Dollar”
Gold has completed the ascending impulse at 1282.15. Possibly, today the pair may fall to reach 1273.80, thus forming a new consolidation range. If later the price breaks range to the downside, the instrument may resume trading inside the downtrend with the short-term target at 1260.00; if to the upside – start another correction towards 1289.10.
BRENT
After finishing the ascending structure at 75.40, Brent has been corrected towards 74.00, thus forming a new consolidation range. If later the price breaks range to the downside, the instrument may continue the correction to reach 73.00; if to the upside – resume trading inside the uptrend with the target at 76.50.
Attention! Forecasts presented in this section only reflect the author’s private opinion and should not be considered as guidance for trading. RoboForex LP bears no responsibility for trading results based on trading recommendations described in these analytical reviews.
As we can see in the H4 chart, the divergence made BTCUSD reached start a new decline, which has already reached the retracement of 38.2%. The next downside target may be the retracements of 50.0%, 61.8%, and 76.0% at 4753.00, 4538.00, and 4286.00 respectively. The resistance level is the high at 5643.80.
In the H1 chart, after finishing another descending impulse, the pair started a new pullback, which has already reached the retracement of 61.8%. The next upside target may be the retracement of 76.0% at 5366.00. If the price breaks the low at 4924.20, the instrument may resume its decline.
ETHUSD, “Ethereum vs. US Dollar”
As we can see in the H4 chart, the divergence made ETHUSD start a new correctional downtrend, which has already reached the retracement of 38.2%. In the nearest future, the price may be corrected and then start another descending impulse. The possible downside targets may be the retracements of 50.0% and 61.8% at 134.07 and 121.53 respectively.
In the H1 chart, ETHUSD is being corrected upwards and has already reached the retracement of 23.6%. The next upside targets may be the retracements of 38.2%, 50.0%, and 61.8% at 158.24, 161.79, and 165.34 respectively. The support is the low at 146.70.
Attention! Forecasts presented in this section only reflect the author’s private opinion and should not be considered as guidance for trading. RoboForex LP bears no responsibility for trading results based on trading recommendations described in these analytical reviews.
As we continue to scan the charts for setups and trigger to alert our followers, we’ve come across a setup that may be more ominous than what it appears. Recently we’ve posted articles about how the SPY and the NQ have pushed into new all-time high price territory and how Gold is setting up for a momentum base that should launch precious metals to near highs. We’ve also discussed how we believe the current upside price bias in the US stock markets should last another 10~35+ days before new price weakness sets up – possibly pushing prices lower in late May or early June 2019.
Our research team has been scanning the charts looking for anything that could give us an edge to the potential setup for this price weakness in the future. We believe the Transportation Index and the Financials could be keys to understanding how far the upside rally can continue and when a price peak may begin to warn of a potential price top or rollover.
An Island Top is a pattern that sets up with an upside price gap followed by sideways price action above that gap. In theory, this type of setup should promote the gap to be filled with downside price action before any further upside price move can continue. Although, gaps to the upside are fairly common in strong uptrends. Given the strength of the earnings data released early this week and the expectations that we have for some continued upside price bias over the next 10~35+ days, we are watching these Island Top formation in the Financials for any signs of weakness to alert our followers.
This Daily FAS chart highlights the GAP as well as the Resistance levels that are currently acting as a ceiling. A breakout above the resistance level would indicate that we have more room to run higher. Any failed breakout to the upside, where price briefly rallies above the resistance level, then falls back below it, would be a pretty strong indication of a rotational peak. The Financials could fall 10% from current levels and still be within the range of the March/April lows. It would take a much bigger move to qualify as a breakdown bearish trend.
This Daily XLF chart highlights a similar pattern to the FAS chart. The key element of the XLF chart is that the Resistance level provides more key fundamental price peaks than the FAS chart. On this XLF chart, we can see that the current Resistance level aligns perfectly with the Nov/Dec 2018 highs. We can also see a short GREEN Fibonacci trigger level line in early March 2019 above the Resistance level. That Fibonacci trigger level is still valid and any move above that level would constitute a new bullish price trend trigger.
Any failure to break the Resistance level would qualify as a price rotation to fill the GAP and potentially set up a move back to near $25 looking to find new support. Overall, the Financials are poised for a move – up or down. Our research suggests the US stock market is not done rising, thus we are concerned that certain sectors may begin to show signs of weakness as the broader market continues to rise.
Our research team believes a critical peak formation is likely near the end of May or in early June 2019. It is because of this belief that we are warning traders to play the next 15~25+ days very cautiously. Watch the Financials, the Transportation Index, the US Dollar, and Precious Metals. We believe any early signs of weakness will be found within these symbols.
With a total of 55 years of technical analysis and trading between Brad Matheny, and myself Chris Vermeulen, our research and trading signals makes analyzing the complex and ever-changing financial markets a natural process. We have a simple and highly effective way to provide our customers with the most convenient, accurate, and timely market forecasts available today. Our stock and ETF trading alerts are readily available through our exclusive membership service via email and SMS text. Our newsletter, Technical Trading Mastery book, and Trading Coursesare designed for both traders and investors. Also, some of our strategies have been fully automated for the ultimate trading experience.
EUR/USD retains its bearish mood. Right now the quotes are at the 1.11200-1.11600 range. The demand for USD remains high due to a positive durable goods report from the US. The financial market participants are waiting for the US GDP report for the first quarter of 2019. The experts forecast that the economy growth in the US will slow down from 2.2% to 2.0%. Consider the difference between the real and forecasted events and open positions from these levels.
At 15:30 (GMT+3:00) we expect the US GDP report.
The price fixed below 50 MA and 200 MA which points to the power of the buyers.
The MACD histogram is in the negative zone but above the signal line which gives a weak signal to sell EUR/USD.
The Stochastic Oscillator is near the overbought zone, the %K line is above the %D line which gives a weak signal to buy EUR/USD.
Trading recommendations
Support levels: 1.11200, 1.11000
Resistance levels: 1.11600, 1.12000, 1.12300
If the price fixed below 1.11200, expect further descend toward 1.10800-1.10600.
Alternatively, the quotes can recover toward 1.12000.
The GBP/USD currency pair
Technical indicators of the currency pair:
Prev Open: 1.29031
Open: 1.28884
% chg. over the last day: -0.06
Day’s range: 1.28877 – 1.29173
52 wk range: 1.2438 – 1.4378
GBP/USD stabilized aftera long fall in the last two weeks. Right now GBP is testing the local support and resistance levels at 1.28900 and 1.29200. The investors are waiting for additional drivers. You should keep an eye on Brexit. A technical correction is possible soon. You should open positions from the key levels.
The Economic News Feed for 26.04.2019 is calm.
The indicators do not provide precise signals, the price has crossed 50 MA.
The MACD histogram is close to 0.
The Stochastic Oscillator is near the overbought zone, the %K line has crossed the %D line. There are no signals at the moment.
Trading recommendations
Support levels: 1.28900, 1.28650
Resistance levels: 1.29200, 1.29600, 1.29800
If the price fixes below 1.28900, expect further descend towards 1.28650-1.28400.
Alternatively, the quotes can recover toward 1.29600-1.29800.
This article reflects a personal opinion and should not be interpreted as an investment advice, and/or offer, and/or a persistent request for carrying out financial transactions, and/or a guarantee, and/or a forecast of future events.
USD/CAD stabilized after a long rally since the beginning of the week. The technical picture remains ambiguous. The local support and resistance levels are 1.34600 and 1.34900. A technical correction is possible soon. The investors are waiting for the US GDP report. Keep an eye on the oil quotes dynamics and open positions from the key levels.
The Economic News Feed for 26.04.2019 is calm.
The indicators do not provide precise signals, the price has crossed 50 MA.
The MACD histogram is close to 0.
The Stochastic Oscillator is near the overbought zone, the %K line has crossed the %D line. There are no signals at the moment.
Trading recommendations
Support levels: 1.34600, 1.34200, 1.34000
Resistance levels: 1.34900, 1.35150
If the price fixes above 1.34900, consider buying USD/CAD, since the price will move toward 1.35200-1.35500.
Alternatively, the quotes can correct toward 1.34300-1.34000.
The USD/JPY currency pair
Technical indicators of the currency pair:
Prev Open: 112.136
Open: 111.594
% chg. over the last day: -0.57
Day’s range: 111.449 – 111.786
52 wk range: 104.56 – 114.56
USD/JPY shows an agressive sales. The quotes fell by 50 points and updated the local minimums. Right now the safe haven currency is consolidating around 111.550-111.800. USD/JPY has a tendency to descend further. Keep an eye on the US GDP report and open positions from the key levels.
Today during the asian trading session Japan published an array of weak economic reports.
The price fixed below 50 MA and 200 MA which points towards a bearish mood.
The MACD histogram fixed in the negative zone but above the signal line which gives a weak signal toward selling USD/JPY.
The Stochastic Oscillator is in the neutral zone, the %K line is below the %D line, which points toward a bearish mood.
Trading recommendations
Support levels: 111.550, 111.400, 111.000
Resistance levels: 111.800, 112.000, 112.150
If the price fixes below 111.550, expect further descend toward 111.300-111.200.
Alternatively, the quotes can grow toward 112.000-112.150.
Demand for the US currency is still high. Yesterday, the US dollar strengthened slightly against the basket of major currencies. At the moment, the dollar index (#DX) has become stable near two-year highs. The United States has published mixed economic releases. Core durable goods orders rose by 0.4% in March, although investors expected growth by only 0.2%. However, initial jobless claims increased to 230K instead of 199K. Today, investors have taken a wait-and-see attitude before the publication of US GDP data for the first quarter of 2019. We recommend taking into account the difference between the actual and forecasted values.
The euro has stabilized after aggressive sales the day before. Yesterday, ECB Vice President, Luis de Guindos, said that the regulator was ready to resume a quantitative easing program (QE) to stimulate inflation in the Eurozone. The official also added that he expected growth in the Eurozone economy by 1.1-1.2% in 2019.
The “black gold” prices have moved away from annual highs. In the near future technical correction is not excluded after a protracted rally. At the moment, futures for the WTI crude oil are testing the mark of $64.90 per barrel.
Market Indicators
Yesterday, there was a variety of trends in the US stock market: #SPY (-0.06%), #DIA (-0.52%), #QQQ (+0.41%).
The 10-year US government bonds yield is at the level of 2.52-2.53%.
On Thursday the 25th of April, trading on the euro closed 0.2% down. The state of the Eurozone economy is weighing down on the euro, with the strength of the US dollar adding to this pressure. The DXY rose to 98.32, while the euro dropped to June 2017 levels. In the US session, the greenback got a boost from strong data on durable goods orders, which exceeded expectations. Traders are now focused on US GDP data for Q1, so a strong showing will play into the hands of dollar bulls.
17:00 US: Michigan consumer sentiment index (Apr).
20:00 US: Baker Hughes US oil rig count.
Current situation:
Since the beginning of the week, the euro has shed 0.83% against the dollar. In this morning’s Asian session it’s trading up by 0.14%. The market is consolidating ahead of the US GDP report. Markets are expecting a rise of 2.0% against 2.2% in Q4. Considering that last quarter’s report exceeded expectations, market participants are expecting figures well above 2%. Since this is the first reading, volatility should be high.
The pair is trading around the trend line, and the stochastic is in the euro sell zone. Since there’s important data coming out today, the pair should remain within a limited range until 15:30. In my forecast, I expect a drop to 1.1113. Further movements will be decided by the GDP figures. The general feeling is that good GDP figures are already built into the price, so it’s worth expecting a correction before the day is out. This could see a pin bar form on Monday.
The DOW Transportation Index continues to test resistance near $10,050 as earnings drive the NQ well past historical all-time highs. Our interest in the Transportation Index is because it acts as a fundamental indicator for the US and global economies in terms of future transportation/shipping expectations. When the Transportation Index rises, it is a good sign that business and consumers have faith in the future economy and the continued demand for goods to be supplied to retailers and distribution centers.
The fact that the TRAN is back to near December 2018 highs means we have reached an expected economic expansion level that equals that level just before Christmas 2018. A continued rally would push expectations even higher going into the Summer months. With earnings hitting the market hard today driving a strong rally in almost all the major US stock indexes, we are surprised that the TRAN did not move a bit higher on the news.
Should the resistance level near $11,050 continue to operate as a ceiling for the TRAN, we’ll know soon enough as price should begin to move back below $11,000 and possibly attempt to retest $10,800. A key Fibonacci trigger level currently rests near $10,800 that would indicate a potential for a new bearish trend if this level is broken.
This Weekly TRAN chart, below, highlights just how important the current resistance level really is. This $11,050 level actually plays a key role in the 2018 price rotation and is the key resistance level for the December 2018 rotation peak.
As we’ve continually suggested, Fibonacci price theory suggests that price must always attempt to establish new price highs or new price lows. If this new price high, above the $11,050 fails, then price should attempt to rotate lower and attempt to break the $10,000 low level created in early April 2019.
We suggest traders take a very cautious long-biased stance in the markets right now. Weakness could come out of the shadows fairly quickly as earnings hit. The Iran Oil news hit the markets quickly on Monday. We could wake up to some dire earnings news this week that could send the markets lower and push some of these resistance levels into a topping formation.
Additionally, as you look at this Weekly chart, pay attention to the fact that we could be setting up a Right Shoulder of a Head-n-Shoulders pattern if new all-time highs are not reached. There are many ways to attempt to read this chart and the TRAN should lead the markets if a price move does breakout.
Our research says we should continue to see an upward price bias for at least another 10~35+ days before any real sign of weakness shows up. We are still urging traders to take a very cautious approach to their trading until we see the TRAN break to new highs. We feel it is wise to trade this area very cautiously over the next 30+ days.
The pound is currently looking undervalued – despite the Brexit chaos – and can be expected to appreciate, forecasts the CEO of one of the world’s largest independent financial advisory organizations.
Nigel Green, the founder and chief executive of deVere Group is speaking out as weeks of talks resumed between the two main political parties in Westminster following the Easter break.
Mr Green comments: “Despite Theresa May securing an extension from the EU, the Brexit impasse seems as intractable as ever.
“The talks between the government and the official opposition seem to be on the verge of collapse.
“Nothing has of any substance been achieved and everything remains up in the air.”
“However, the one thing that does seem a relative certainty is that there will be some form of soft Brexit. The longer the Brexit process takes, and it is clearly taking a long time, the closer the final relationship between the UK and the EU will be.”
He continues: “Against the backdrop of a likely soft Brexit, the pound currently looks undervalued.
“When Brexit is finally delivered, investors are advised to be on the watch for a rally in the pound, UK stocks and a spurt in economic activity as sidelined household and business spending kicks in.”
He goes on to add: “Since the Brexit referendum took place, the pound is down 14 per cent against the euro and 13 per cent against the US dollar compared to the day of the vote in June 2016.
“In the new environment, should a soft Brexit be delivered, there is a possibility that the pound could rise to pre-referendum levels against the pound.”
Mr Green concludes: “Brexit, amongst other geopolitical and economic factors, drive investors returns. It’s therefore crucial that investors mitigate risks and capitalise on the inevitable opportunities of shifting environments by ensuring that their portfolios properly diversified.”
About
deVere Group is one of the world’s largest independent advisors of specialist global financial solutions to international, local mass affluent, and high-net-worth clients. It has a network of more than 70 offices across the world, over 80,000 clients and $12bn under advisement.
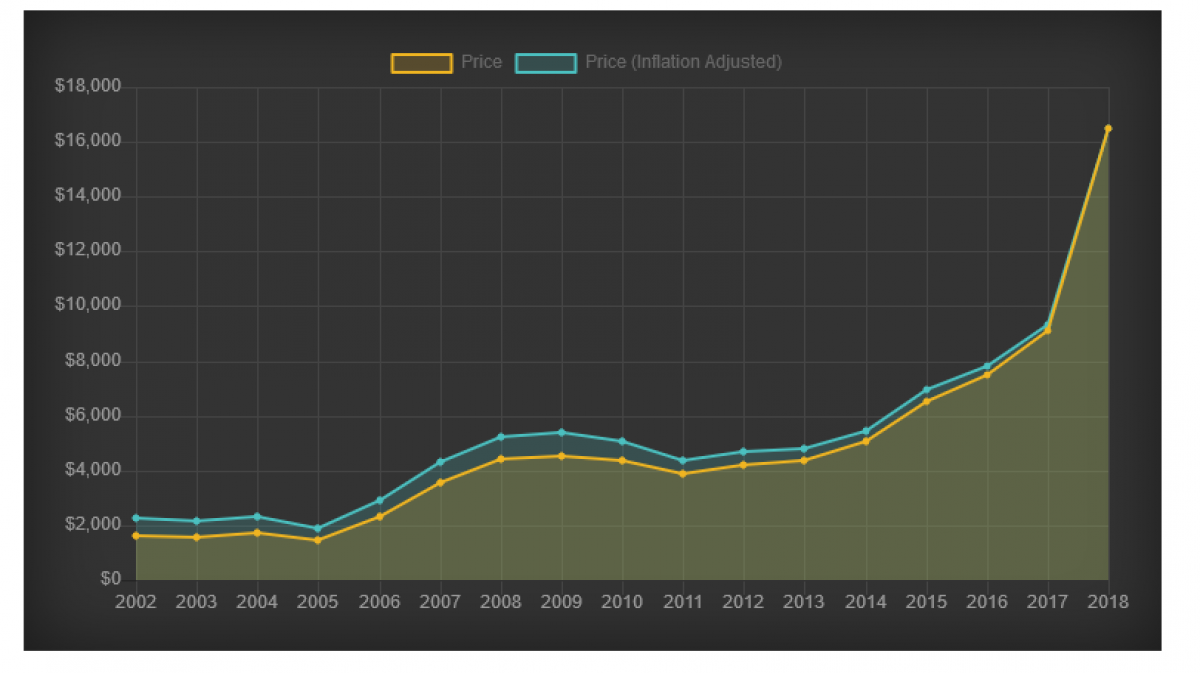
2018 was a terrible year for commodities, but few sectors fared as badly as lithium.
The crucial battery metal, also known as “White petroleum“, struggled through a 50 percent price correction as supply soared and demand fears spread like wildfire.
But it isn’t time to give up on lithium stocks just yet.
The rising stars of the hard-rock lithium space are transforming the industry with their remarkable ability to extract lithium at a lower cost and faster pace than the lithium majors can from their brine deposits. In short, there’s a new caliber of producer in town and – with lithium demand set to soar once again – their timing could not be better.
The three stand out companies in the hard-rock mining space at the moment are Albemarle (NYSE:ALB), Chinese Tianqi Lithium (SZSE:002466) and Power Metals (TSXV: PWM; OTC:PWRMF). And each of these companies are able to bring lithium to market faster and cleaner than their brine-based competitors.
Before examining the hard rock lithium space though, we need to take a closer look at the market itself. Overall, the supply-demand balance is actually much tighter than prices suggest. After all, the soaring demand from tech and energy sectors that triggered lithium’s meteoric rise in 2018 didn’t vanish overnight.
The lithium boom began in earnest in 2014, with prices rising from less than $6k a ton to more than $16k by 2018. With demand soaring, billions were invested in new mines, with salt brine deposits in Chile and China getting most of the attention.
But after a few banner years, Wall Street started looking at Lithium with more suspicion. In February 2018 Morgan Stanley issued a crushing report: the firm determined that Chilean brine would add 200kt to the market by 2025, effectively doubling supply.
That sent lithium prices plummeting. In China, lithium carbonate prices fell by 50.31%, crushed by reports of the over-supply.
But by year’s end, some of those fears had begun to dissipate. Huge projects that were expected to flood the market began experiencing delays.
You see, salt brine lithium production, which accounts for most of the market, takes a while to get going: salt water is pumped to the surface where it evaporates to form potassium deposits containing lithium.
Take Orocobre in Brisbane, Australia, and its Salar de Olaroz facility in Argentina, which was meant to supply 42.5k tons. Delays, legal troubles and mounting expenses has brought the project basically to a halt.
Mining lithium through salt brine evaporation can generate big earnings, but only for firms with the capital to see them through: for that reason, the lithium sector is dominated by larger companies such as Albemarle (NYSE:ALB), FMC (NYSE:FMC) and SQM (NYSE:SQM)
These major firms saw their prices tank last year, as the lithium bubble burst in the wake of the Morgan Stanley report and fears of future over-supply.
But that doesn’t mean the lithium party is over. In fact, it may have only just started.
Hard-rock lithium miners in hotspots such as Australia, Canada and China are warming up for the next bull run in this crucial commodity.
The legendary Greenbushes mine which is operated by Tianqi (SZSE:002466) and Albemarle (NYSE:ALB) has been in operation for 30 years, and produces a safe and ‘dry’ source of lithium gained from ‘spodumene’, a mineral that contains high-grade lithium.
On the other site of the planet in North-East Ontario, and not far from Tesla’s battery producing ‘gigafactory’ lies the prolific Case Lake property which is 100% claimed by Power Metals (TSXV: PWM; OTC:PWRMF)
The lithium holding spodumene here is found in pegmatite zones of which the metallurgy is currently being tested by SGS Canada.
Hard rock miners do not only have cleaner production methods, they also have one leg up on the competition as they are likely to bring new supply to the marketplace quicker than their brine-mining peers do.
According to Benchmark Minerals intelligence, there’s a huge discrepancy between lithium prices and the lithium demand side.
In September 2018, analysts at CRU estimated a lithium surplus for the year of only 22k tons, against demand of 277k tons.
Let’s take a look at key demand drivers for lithium.
First, there’s electric vehicles (EV). According to Argus Media, lithium ion batteries in EVs have increased from 10 GWh to 70 GWh in only a decade, with estimates placing the market to reach 223 GWh by 2025, an increase of 300x from current levels.
EVs have been taking off in the United States, with sales increasing by 81% in 2018, though a more modest increase is expected in 2019. EVs take up 2.4% of total vehicles in the United States.
Where demand is really soaring is in China. More than 2 million EVs will be sold this year, up from 1.1 million last year. It’s part of the government’s plan to have 50% market share for EVs by 2025.
Consumers in Europe are also turning towards EVs, which now make up considerable portions of total vehicle fleets in Norway, Holland and France. EV sales jumped 67% in Europe, led by affordable EV models from Renault and Nissan.
Fastmarket predicts EV market penetration of 15% by 2025, up from only 2% currently. But with such ambitious plans in place in China, one of the world’s most important car markets, that figure could be on the conservative side.
According to Simon Moores of Benchmark Minerals, EVs and an increase in battery storage demand “has sparked a wave of lithium ion battery mega factories,” such as Tesla’s famous Gigafactory. Currently, 70 lithium-ion battery “mega” factories are under construction, up from only 17 in October 2017.
Elon Musk wants 20 gigafactories producing lithium batteries for Tesla EVs by the next decade. Benchmark thinks new factories will be using up 534,000 tons in new demand (on top of current demand of 200,000 tons) by 2028.
That’s the other demand side factor: as the energy storage sector grows, demand for lithium-ion batteries will grow by leaps and bounds. By one estimate, the market could reach $92 billion by 2024, with a CAGR of 16%. The market was worth $21.6 billion in 2018.
A slightly more conservative estimate has the market reaching $40 billion by 2025, but that’s still nearly 100% in growth in less than a decade. Another estimate is $60 billion by 2024. Due to declining prices, Bloomberg raised its forecast for lithium ion batteries due to lower than expected prices.
The best estimate is from Global Market Insights, which predicts energy storage and automotive lithium ion battery demand to double by 2024.
The expectation from GMI is that the bulk of new battery production will come from China, where batteries have a large internal market.
So how will this play out in the lithium sector?
One major take-away here is that traditional lithium production—through salt-brine evaporation—may lose market share to newer and more competitive production methods, particularly spodumene or “hard-rock” lithium mining, where the lithium is extracted by drilling directly into rich deposits.
Extracting lithium in this way is cheaper, easier and faster—and it’s starting to attract more attention, with multiple spodumene operations popping up in
Australia. Lithium giant Albemarle has gone so far as to halt all expansions of salt brine in South America, the so-called “lithium triangle,” and has instead been pouring resources into the Greenbushes project, where capacity is doubling.
Demand for spodumene is reflecting rising prices, which spiked in 2018 even as lithium prices across the board were slumping.
In 2018 there were four new spodumene operations. But in China, General Lithium Corp. is planning a new mineral ore converter project that will triple production capacity for lithium by the end of 2020.
The plant will take in spodumene and convert it into lithium—60,000 tons per year, according to company estimates. That’s from 135,000 tons of spodumene.
As we mentioned before, Canadian hard-rock miner Power Metals (TSXV: PWM; OTC:PWRMF) has drilled approximately 15,000 meters at its very valuable Case Lake
Property in North-East Ontario. In fact, Power Metals drilled more than any other hard rock lithium company in North America last year. The size of its deposits are quite impressive and easy to mine as they are concentrated very close to the surface. The average grade is also world class, and at approximately
1.75% Li20 with intervals as high as 3.5%, it competes directly with projects like Greenbushes in Australia, the world’s largest operating hard-rock lithium mine.
Next to the prolific Case Lake project, Power Metals is also developing the Paterson Lake and Gullwing Tot Lake properties in Ontario, which, according to its
VP of exploration Julie Selway, could be the next gamechanging hard-rock lithium plays in Canada.
Power Metals is just one example of this new trend in the lithium space. The entire sector is being transformed from within, and with prices stabilizing there are plenty of opportunities for investors in 2019.
A lithium renaissance is well and truly underway, and it is hard-rock miners who find themselves at the forefront of this movement.
By. Charles Kennedy
NOT AN INVESTMENT ADVISOR. Oilprice.com is not registered or licensed by any governing body in any jurisdiction to give investing advice or provide investment recommendation. ALWAYS DO YOUR OWN RESEARCH and consult with a licensed investment professional before making an investment. This communication should not be used as a basis for making any investment.
RISK OF INVESTING. Investing is inherently risky. While a potential for rewards exists, by investing, you are putting yourself at risk. You must be aware of the risks and be willing to accept them in order to invest in any type of security. Don’t trade with money you can’t afford to lose. This is neither a solicitation nor an offer to Buy/Sell securities.
RISK OF BIAS. We often own shares in the companies we feature. For those reasons, please be aware that we are extremely bias in regards to the companies we write about and feature in our newsletter and on our website.
Admiral Markets has partnered with Trading Central to provide clients with a suite of new market analysis and trading features.
Admiral Markets’ new offering of Trading Central’s Technical Insight and Forex Featured Ideas form a powerful, advanced addition to both MetaTrader 4 and MetaTrader5 platforms. Collectively, these two new award-winning tools empower today’s trader with a wide range of rich technical analytics, trading indicators and industry-leading pattern recognition.
Featured Ideas™ delivers traders unbiased, intraday trading ideas tailored to each individual trader’s preferences such as holding timeframes, favourite patterns or preferred currencies. These new features are currently available to all Admiral Markets clients using the desktop version of MetaTrader 4 or MetaTrader 5, via the exclusive MetaTrader Supreme Edition plugin.
Featured Ideas’ transparent and educational feature set helps teach new traders about technical analysis and assists traders of skill-levels in forming confident, timely decisions.
Each idea offers clear and concise commentary on why this idea was displayed, and what the technical events mean for price movement. Hovering over the pattern will teach you about that technical patterns and “watching” an idea will allow you to keep track of how it performs so you can make a confident, educated decision next time you see that pattern.
Technical Insight™ combines actionable, technical analysis from virtually every financial instrument to help traders optimise their trading strategies. Through a balanced feature set of detailed, proactive analytics, educational guidance and customisable options, Technical Insight™ empowers traders of all skill levels to take control of their investments.
Traders can continue to learn about any instrument through the “Learn more” and “View Historical Events” buttons. This progressive disclosure of information allows new traders a jumping off point to begin trading and the ability to continue learning at their own pace.
The Technical Summary Score removes the need to wade through extraneous details to form a decision. It enables traders to see a concise technical outlook across three timeframes in an instant!
Using a proprietary weight-of-evidence approach, the Score displays the directional outlook of either bullish, bearish or neutral, across short- to long-term timeframes, to provide simplistic support at the moment it’s needed.
Chairman of the Management Board of Admiral Markets Group, Sergei Bogatenkov, commented, “Admiral Markets is excited to be partnering with Trading Central to be offering these new features to clients, including an analysis platform that will be released in the coming months. Our clients’ trading experience is our top priority, and giving traders the tools to succeed is a key part of ensuring an excellent trading experience.”
“At Trading Central, we’re dedicated to empowering traders with actionable research and insightful analytics that support them at the point of action. Technical Insight does just that, by making detailed, award-winning technical analysis, concise insight and education approachable for today’s investors,” says Alain Pellier, CEO of Trading Central.
“With their heavy focus on educational resources and a wide range of tools to assist their customers, Admiral Markets is a natural complement to our mission. We’re very excited to launch insightful analytics through their platform, as it enables us to support even more of today’s traders in the moments which matter.”
About Admiral Markets
Admiral Markets is a leading online Forex and CFD trading provider. In addition to a wide range of financial instruments, Admiral Markets offers free educational materials, including analytics, webinars and seminars. Admiral Markets is proud to announce being awarded the coveted “2019 CFD Broker of the Year” award by a customer survey conducted by Broker-Test.de, on the eve of celebrating 18 years of success in trading and client service.
About Trading Central
Trading Central has been successfully supporting investment decisions through innovation since 1999. Our broad portfolio of market solutions combines award-winning analyst research and patented pattern recognition with 24H global multi-asset coverage. Collectively, these provide technical and fundamental analysis on 75,000+ instruments every market day to offer timely and actionable insight. Our tools empower today’s investors to participate in financial markets by helping them to generate trade ideas, validate investment decisions and manage risk- all at the point of action.
***
Risk disclosure: CFDs are complex instruments and come with a high risk of losing money rapidly due to leverage. 85% of retail investor accounts lose money when trading CFDs with this provider. You should consider whether you understand how CFDs work and whether you can afford to take the high risk of losing your money. Read more at admiralmarkets.com