Author Archive for InvestMacro – Page 220

Forex Technical Analysis & Forecast 14.06.2019 (EURUSD, GBPUSD, USDCHF, USDJPY, AUDUSD, USDRUB, GOLD, BRENT)

Article By RoboForex.com

EURUSD, “Euro vs US Dollar”

EURUSD has formed the consolidation range above 1.1283 and broken it downwards. Today, the pair may fall to reach 1.1266 and then grow to test 1.1283 from below. After that, the instrument may resume trading inside the downtrend with the short-term target at 1.1225.

EURUSD_Технический анализ
Risk Warning: the result of previous trading operations do not guarantee the same results in the future

GBPUSD, “Great Britain Pound vs US Dollar”

GBPUSD has formed the consolidation range above 1.2683 and broken it downwards. Possibly, today the pair may form a new descending structure towards 1.2660 and then start a new growth to test 1.2683 from below. Later, the market may resume trading inside the downtrend with the short-term target at 1.2622.

GBPUSD_Технический анализ
Risk Warning: the result of previous trading operations do not guarantee the same results in the future

USDCHF, “US Dollar vs Swiss Franc”

USDCHF has reached 0.9957; right now, it is consolidating below it. Today, the pair may break this level and form one more ascending structure towards 0.9990. After that, the instrument may resume trading downwards to test 0.9960 from above and then continue trading inside the uptrend with the short-term target at 1.0056.

USDCHF_Технический анализ
Risk Warning: the result of previous trading operations do not guarantee the same results in the future

USDJPY, “US Dollar vs Japanese Yen”

USDJPY is still consolidating around 108.52 without any particular direction. Possibly, the pair may form one more ascending structure to reach 108.80 and then resume falling towards 108.52. Later, the market may and then start another growth with the short-term target at 109.18.

USDJPY_Технический анализ
Risk Warning: the result of previous trading operations do not guarantee the same results in the future

AUDUSD, “Australian Dollar vs US Dollar”

AUDUSD is still trading downwards with the short-term target at 0.6830; by now, it is has reached the predicted target at 0.6960. Possibly, the pair may start another correction towards 0.6930 and then resume trading downwards to reach the above0-mentioned target.

AUDUSD_Технический анализ
Risk Warning: the result of previous trading operations do not guarantee the same results in the future

USDRUB, “US Dollar vs Russian Ruble”

After reaching the first upside target at 64.69, USDRUB has completed the correction at 64.53, thus forming a new consolidation range. If later the price breaks the range to the upside, the instrument may continue the correction towards 64.88; if to the downside – resume trading inside the downtrend with the short-term target at 64.20.

USDRUB_Технический анализ
Risk Warning: the result of previous trading operations do not guarantee the same results in the future

XAUUSD, “Gold vs US Dollar”

Gold is trading upwards; it has almost reached 1347.74. Possibly, the pair may rebound from this level and then form a new descending structure with the first target at 1334.30. Later, the market may start another growth towards 1342.60.

GOLD_Технический анализ
Risk Warning: the result of previous trading operations do not guarantee the same results in the future

BRENT

Brent is trading upwards to reach 63.17. After that, the instrument may be corrected towards 61.51 and then form one more ascending structure with the short-term target at 66.00.

BRENT_Технический анализ
Risk Warning: the result of previous trading operations do not guarantee the same results in the future

Article By RoboForex.com

Attention!
Forecasts presented in this section only reflect the author’s private opinion and should not be considered as guidance for trading. RoboForex LP bears no responsibility for trading results based on trading recommendations described in these analytical reviews.

Fibonacci Retracements Analysis 14.06.2019 (BITCOIN, ETHEREUM)

Article By RoboForex.com

BTCUSD, “Bitcoin vs US Dollar”

As we can see in the H4 chart, BTCUSD hasn’t completed the correction yet. After reaching 38.2% fibo, the pair may yet continue moving towards 50.0% and 61.8% fibo at 7012.00 and 6522.00 respectively. However, in the current attempts to grow transform into a new rising wave, the instrument may break the high at 9098.70 and then reach its mid-term target at 50.0% fibo (10170.00).

BITCOIN
Risk Warning: the result of previous trading operations do not guarantee the same results in the future

In the H1 chart. BTCUSD is being corrected upwards and has already reached 50.0% fibo. The next upside target may be 61.8% fibo at 8458.00. At the same time, there is a divergence on MACD, which may indicate the completion of the local tendency. The key target of a possible descending impulse may be the low at 7435.10.

BTCUSD
Risk Warning: the result of previous trading operations do not guarantee the same results in the future

ETHUSD, “Ethereum vs. US Dollar”

As we can see in the H4 chart, ETHUSD is finishing correctional descending wave at 38.2% fibo and may start a new one to the upside. If the price fails to form a proper rising impulse and break the high at 288.99, the instrument may start another descending wave to reach 50.0% and 61.8% fibo at 217.63 and 200.91 respectively.

ETHEREUM
Risk Warning: the result of previous trading operations do not guarantee the same results in the future

In the H1 chart, the convergence made the pair start a new uptrend, which has almost reached 61.8% fibo at 265.15. The next upside target may be 76.0% fibo at 273.93. If the instrument breaks the support at 226.56, it may continue its mid-term downtrend.

ETHUSD

Article By RoboForex.com

Attention!
Forecasts presented in this section only reflect the author’s private opinion and should not be considered as guidance for trading. RoboForex LP bears no responsibility for trading results based on trading recommendations described in these analytical reviews.

Precious Metals: T-Minus 3 Seconds To Liftoff

By TheTechnicalTraders.com

We take great pride in our research team’s ability to make accurate predictions and calls in the markets.  In addition to the many predictions and calls we’ve made over the past few years, our Gold prediction from October 2018 continues to astound many industry professionals. We receive emails from people asking how we were able to make such an incredible call in Gold 6 to 8 months before these price moves?  We politely tell these people that our research team and our proprietary predictive modeling tools assist us in finding and making these incredible predictions.  The simple answer is it takes hard work, specialized tools and a lot of skill and research.

Please take a minute to review some of our research from January 2019 that highlighted this incredible prediction for Gold and the supporting, more recent, research posts suggesting Silver is the real sleeper trade.

January 28, 2019: MULTI YEAR BREAKOUT IN METALS

June 7, 2019: ADL PREDICTIVE MODELING SUGGESTS A BIG MOVE IN SILVER :

June 2, 2019: IS SILVER THE SLEEPER RALLY SETUP OF A LIFETIME?

Today, we are highlighting what we believe is the momentum impulse move in Gold that will become the catalyst for the future move in Gold & Silver throughout the rest of this year and likely all of 2020.  The key element to launch Gold and Silver beyond current resistance levels is bound by two factors and could be boosted by a third.  The first two factors are “fear and greed”.

Investors are continually searching for suitable investments with healthy returns and moderate risk.  As we have learned from the past, capital will flow into any investment, even instruments that include incredible long term risk factors, when the opportunity exists for gains and risk is mitigated.  The current upside price move in Gold is just such an event.

The recent news items add additional fuel to the Precious Metals rally because they foster increased fear related to the global economy and potential military action or increased uncertainty.  This fear translates into the action of “protect my investments that may be exposed to greater risk and find an investment that reduces this risk and provides for greater returns/gains”.  That is the question Gold investors are asking themselves all over the world right now.

The booster fuel, which would drive Gold and Silver into another galaxy is the US Dollar.  If the US Dollar were to weaken, even by 4% to 7%, while a global uncertainty event continued to unfold, we believe this valuation pressure would push Gold and Silver well above our current expectations.

When we think about the current environment for precious metals, one has to understand that fear and greed don’t have to be tangible or overwhelming.  This process is almost like a perpetual motion machine.  Once the process gets started where investors pile into Gold because of the fear and greed factors, the price of gold rises.  Because the price of gold rises, traders start to pay closer attention to what is happening in gold and the greed factor starts to increase.  Once they are convinced this is a bigger opportunity and their fear levels are still valid, the conclusion is “I don’t want to miss this move in Gold, so I’ll get it now – before the big move happens”.

It is as simple as that.  And this is why we are saying “T-Minus Three Seconds” before the big breakout move really takes shape.  That is our way of saying, it could happen any day now.  The breakout move and the momentum base appear to be ready to go.

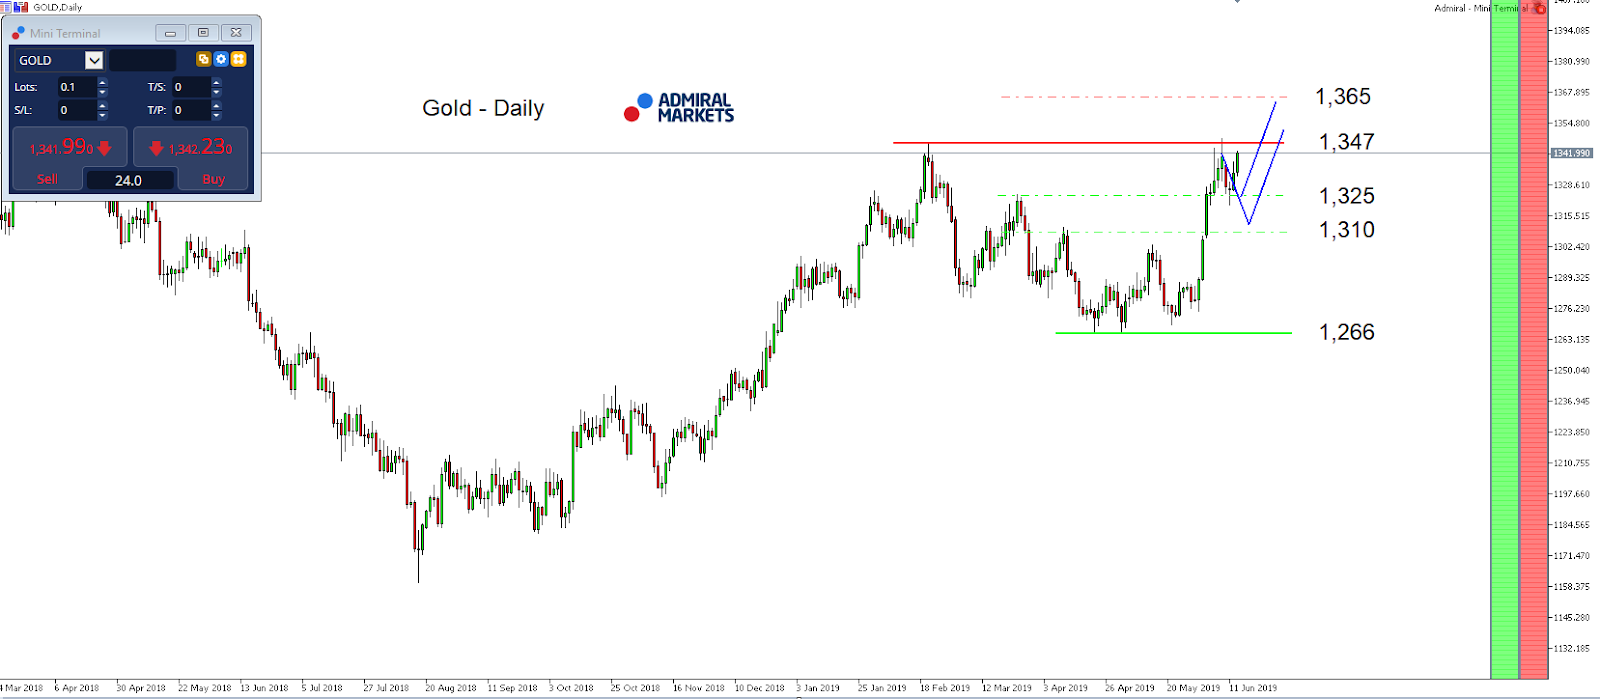
This Gold daily chart highlights the recent upward price move and shows just how quickly price can rally.  This resulted in a $75 price rally (+6%) in a matter of 10+ days.  Imagine what that will look like after Gold breaks above $1650 on the fear/greed move.

This Gold Weekly chart highlights what we expect to be the first upside leg – the move to $1450.  After that, we expect a brief pause in the rally (possibly 7 to 21+ days), then another big move higher where the price will rally above $1650.  That bigger move should solidify the focus of global investors and, much like the big move in Bitcoin, should attract a large number of investors not wanting to miss the rest of the upside move.

Silver is what we are calling the “sleeper trade” for precious metals bugs.  Sure, Gold has all the action right now because it is the leading metal to offset this fear/greed factor.  Silver always lags behind gold because it is the “little brother” to the bigger players in gold.  As our research has shown, when the move begins, Silver is actually a better trade than Gold because it will likely increase in price by a factor of 1.4 to 1.8 compared to the rally in gold prices.

We believe the next move in Silver will target $18 to $20.  These price levels below $15 are a gift for anyone willing to take the trade.

This Monthly Silver chart shows what we believe will be the upside price waves as silver advances past $22.  Read the research posts, above, again to learn more about our more detailed expectations.  It is all right there for you to see and understand.

T-Minus Three And Counting.  We believe this setup is about to break to the upside and there is not much time left to see prices near these levels.  Below $1400 in gold and below $15 in silver are about to end.  When this really does begin to lift off as we’ve been predicting, we may never see these price levels again.  Well, at least in the foreseeable future.

CONCLUSION AND UNIQUE OPPORTUNITY

Its been an incredible year and a half for many reasons. We and our Subscribers portfolios are up over 91%. We called forecasted each and every move in gold 8 months before it all unfolded right down to the week for the low/bottom.

This May we said it was a sell in May set up and we profited from the rally leading into May and traded and inverse ETF to profit from the correction. We then profited from the safe haven money flow into the utility sector which rallied while the stock market fell. And to top it off we shorted the vix spike for a quick 25% gain during a time when everyone else was panicking.

So what does this all this mean? It means we have a good pulse on the major markets and can profit during times when most others can’t.

I can tell you that huge moves are about to start unfolding not only in metals, or stocks but globally and some of these super cycles are going to last years. These super cycles starting to take place will go into 2020 and beyond which we lay out in our new book/guide: 2020 Cycles – The Greatest Opportunity Of Your Lifetime

I am going to give away and ship out silver rounds to anyone who wants to trade and invest with me for the next 1-2 years through my Wealth Trading Newsletter. You can upgrade to this longer-term subscription or if you are new, join one of these two plans listed below, and you will receive:

1-Year Subscription Gets One 1oz Silver Round FREE
(Could be worth hundreds of dollars)

2-Year Subscription Gets TWO 1oz Silver Rounds FREE
(Could be worth a lot in the future)

I only have 27 silver rounds I’m giving away
​​​​​​​so upgrade or join now before its too late!

SUBSCRIBE TO MY TRADE ALERTS TO GET YOUR FREE SILVER!

Chris Vermeulen


The Analytical Overview of the Main Currency Pairs on 2019.06.14

by JustForex

The EUR/USD currency pair

Technical indicators of the currency pair:
  • Prev Open: 1.12868
  • Open: 1.12761
  • % chg. over the last day: -0.08
  • Day’s range: 1.12697 – 1.12823
  • 52 wk range: 1.1111 – 1.2009

EUR/USD started to descend and set new local minimums. Right now the quotes are near the support level of 1.12650. The mirror resistance is at 1.13000. USD remains under pressure due to the expectations for Federal Reserve to increase the key interest rate in July. Today the investors are going to evaluate the retail sales report from US. Open positions from the key levels.

At 15:30 (GMT+3:00) the US will publish a real estate sales report.

EUR/USD

The indicators do not provide precise signals: 50 MA is crossing 200 MA.

The MACD histogram is in the negative zone and keeps falling which points to the bearish mood.

The Stochastic Oscillator is in the oversold zone, the %K line is below the %D line which gives a weak signal to sell EUR/USD.

Trading recommendations
  • Support levels: 1.12650, 1.12300, 1.12000
  • Resistance levels: 1.13000, 1.13450

If the price fixes below 1.12650, expect further correction towards 1.12300-1.12000.

Alternatively, the price can fix at 1.13300-1.13500.

The GBP/USD currency pair

Technical indicators of the currency pair:
  • Prev Open: 1.26844
  • Open: 1.26772
  • % chg. over the last day: -0.07
  • Day’s range: 1.26704 – 1.26819
  • 52 wk range: 1.2438 – 1.3631

The GBP/USD technical picture. GBP is consolidating, the local support and resistance are 1.26550 and 1.26900. The incestors are waiting for relevant info regarding Brexit. The leading candidate for the Britain PM position Boris Johnson mentioned that the country will leave the EU on October 31. The official also said that will force a review of the deal earlier negotiated with Brussel. You should open positions from the key levels,

The Economic News Feed for 14.06.2019 is calm.

GBP/USD

The indicators do not provide precise signals, 50 MA has crossed 200 MA.

The MACD histogram is in the negative zone but above the signal line which gives a singal to sell GBP/USD.

The Stochastic Oscillator is in the neutral zone, the %K line is above the %D line which points to the bullish mood.

Trading recommendations
  • Support levels: 1.26550, 1.26100
  • Resistance levels: 1.26900, 1.27300, 1.27600

If the price fixes below 1.26550, expect the quotes to descend towards 1.26200-1.26000.

Alternatively, the quotes can grow toward 1.27200-1.27500.

The USD/CAD currency pair

Technical indicators of the currency pair:
  • Prev Open: 1.33421
  • Open: 1.33263
  • % chg. over the last day: -0.12
  • Day’s range: 1.33232 – 1.33461
  • 52 wk range: 1.2727 – 1.3664

USD/CAD keeps recovering after a long fall. The trading instrument updated the local maximums. The USD/CAD quotes are testing the support zone at 1.33450-1.33650 with 1.33000 acting as a key resistance. USD/CAD can correct further. Keep an eye on the oil quotes and open positions from the key levels.

The Economic News Feed for 14.06.2019 is calm.

USD/CAD

The indicators do not provide precise signals, 50 MA is crossing 200 MA.

The MACD histogram is in the positive zone and keeps rising which points toward further correction of USD/CAD.

The Stochastic Oscillator started to leave the overbought zone, the %K line is below the %D line which gives a signal to sell USD/CAD.

Trading recommendations
  • Support levels: 1.33000, 1.32750, 1.32400
  • Resistance levels: 1.33450, 1.33650, 1.34000

If the price fixes above 1.33450, expect further correction towards 1.33700-1.33400.

Alternatively, the quotes can descend towards 1.32700-1.32400.

The USD/JPY currency pair

Technical indicators of the currency pair:
  • Prev Open: 108.497
  • Open: 108.349
  • % chg. over the last day: -0.16
  • Day’s range: 108.268 – 108.396
  • 52 wk range: 104.97 – 114.56

USD/JPY keeps moving sideways. The technical picture is ambiguous. The key support and resistance levels are 108.250 and 108.500. The financial markets are waiting for the US retail sales report. Keep an eye on the US Treasury bonds` yield and open positions from the key levels.

The Economic News Feed for 14.06.2019 is calm.

USD/JPY

The indicators do not provide precise singals, the price has crossed 50 MA and 200 MA.

The MACD histogram is in the negative zone which points to the bearish mood.

The Stochastic Oscillator is in the neutral zone, the %K line is above the %D line which gives a signal to sell USD/JPY.

Trading recommendations
  • Support levels: 108.250, 108.000, 107.850
  • Resistance levels: 108.500, 108.800, 109.200

If the price fixes below 108.250, expect further descend towards 108.000-107.850.

Alternatively, the ptice can grow towards 108.700-109.000.

by JustForex

Gold seeing new yearly highs into the weekly close

By Admiral Markets

Economic events calendar

Source: Economic Events June 14, 2019 – Admiral Markets’ Forex Calendar

Today, we want to have a look at Gold. Even though last week’s Non-Farm Payrolls disappointed, and it took until Tuesday to see pullback against 1,325 USD, which we discussed in a recent technical analysis.

Last Wednesday, the precious metal took on serious bullish momentum again after the US Inflation data came in at 1.8% for May, up from a 5-month high in April – but below expectations of 1.9%.

As a result, expectations that the Fed will start cutting interest rates this year edged higher, as the Fed Watch Tool‘s prediction for next week’s meeting now sees a 65% that the central bank doesn’t move, while one week earlier we stood at nearly 85%.

In addition to the weak NFP reading last Friday, and Fed chairman Powell opening the door for a potential rate cut on June 4, another disappointing economic data set like the Retail Sales today could trigger another push higher in Gold up to the multi-year-highs around 1,365 USD.

A break higher, driven by a surprisingly dovish FED which goes already with a rate-hike next Wednesday, would mean a strong mid-term buy-signal which sees a projected target somewhere around 1,700 USD, and possibly even higher.

In general, the bullish picture in Gold on a daily time-frame stays active as long as we trade above 1,266 USD:

Gold index daily chart

Source: Admiral Markets MT5 with MT5-SE Add-on Gold Daily chart (between March 14, 2018, to June 13, 2019). Accessed: June 13, 2019, at 10:00pm GMT – Please note: Past performance is not a reliable indicator of future results, or future performance.

In 2014, the value of Gold fell by 1.7%, in 2015, it fell by 10.4%, in 2016, it increased by 8.1%, in 2017, it increased by 13.1%, in 2018, it fell by 1.6%, meaning that after five years, it was up by 6.4%.

Investing in Forex with Admiral Markets

Admiral Markets offers professional traders the ability to trade with a custom, upgraded version of MetaTrader 5, allowing you to experience trading at a significantly higher, more rewarding level. Experience benefits such as the addition of the Market Heat Map, so you can compare various currency pairs to see which ones might be lucrative investments, access real-time trading data, and so much more. Click the banner below to start your FREE download of MT5 Supreme Edition!

Download MetaTrader 5 and begin trading today!

Disclaimer: The given data provides additional information regarding all analysis, estimates, prognosis, forecasts or other similar assessments or information (hereinafter “Analysis”) published on the website of Admiral Markets. Before making any investment decisions please pay close attention to the following:

  1. This is a marketing communication. The analysis is published for informative purposes only and are in no way to be construed as investment advice or recommendation. It has not been prepared in accordance with legal requirements designed to promote the independence of investment research, and that it is not subject to any prohibition on dealing ahead of the dissemination of investment research.
  2. Any investment decision is made by each client alone whereas Admiral Markets shall not be responsible for any loss or damage arising from any such decision, whether or not based on the Analysis.
  3. Each of the Analysis is prepared by an independent analyst (Jens Klatt, Professional Trader and Analyst, hereinafter “Author”) based on the Author’s personal estimations.
  4. To ensure that the interests of the clients would be protected and objectivity of the Analysis would not be damaged Admiral Markets has established relevant internal procedures for prevention and management of conflicts of interest.
  5. Whilst every reasonable effort is taken to ensure that all sources of the Analysis are reliable and that all information is presented, as much as possible, in an understandable, timely, precise and complete manner, Admiral Markets does not guarantee the accuracy or completeness of any information contained within the Analysis. The presented figures refer that refer to any past performance is not a reliable indicator of future results.
  6. The contents of the Analysis should not be construed as an express or implied promise, guarantee or implication by Admiral Markets that the client shall profit from the strategies therein or that losses in connection therewith may or shall be limited.
  7. Any kind of previous or modeled performance of financial instruments indicated within the Publication should not be construed as an express or implied promise, guarantee or implication by Admiral Markets for any future performance. The value of the financial instrument may both increase and decrease and the preservation of the asset value is not guaranteed.
  8. The projections included in the Analysis may be subject to additional fees, taxes or other charges, depending on the subject of the Publication. The price list applicable to the services provided by Admiral Markets is publicly available from the website of Admiral Markets.
  9. Leveraged products (including contracts for difference) are speculative in nature and may result in losses or profit. Before you start trading, you should make sure that you understand all the risks.

By Admiral Markets

The US Currency Is Consolidating

by JustForex

The US dollar does not show clear dynamics against the basket of major currencies. The US dollar index closed yesterday with a slight increase (+0.03%). Traders have taken a wait-and-see attitude before the upcoming Fed meeting, which will be held next week on Wednesday. Earlier this week, Fed Chairman Jerome Powell said that the Central Bank was ready to support the economic growth in the United States. Investors believe that the Fed is going to reduce the base interest rate at the next meetings amid slowing inflation and increasing tensions in trade relations.

The Australian dollar is getting cheaper due to the assumptions of financial market participants that the Reserve Bank of Australia will be forced to reduce the rate to support the economy. Yesterday, weak data on the unemployment rate of Australia were published: the figure counted to 5.2% in May and was worse than the forecasted value of 5.1%.

Weak economic data from China have been published today. Thus, the industrial production grew by only 5.0% in May, while experts expected 5.4%. The unemployment rate counted to 5.0%.

The “black gold” prices continue to rise after substantial growth the day before due to increased tensions in the Middle East. Yesterday, two tankers were attacked in the Gulf of Oman. There are suggestions that it could be a torpedo attack, which resulted in explosions and fire on ships. At the moment, futures for the WTI crude oil are testing the mark of $52.00 per barrel.

Market Indicators

Yesterday, the bullish sentiment was observed in the US stock market: #SPY (+0.41%), #DIA (+0.43%), #QQQ (+0.59%).

The 10-year US government bonds yield has been declining. Currently, the indicator is at the level of 2.06-2.07%.

The news feed on 2019.06.14:

– Retail sales in the US at 15:30 (GMT+3:00).

We also recommend paying attention to the speech by the Bank of England Governor Carney.

by JustForex

EURUSD pair consolidating around the trend line

By Alpari.com

Previous:

On Thursday the 13th of June, trading on the EURUSD pair closed down. The rate dropped after the breakout of the 1.1285 support (trend line, lower boundary of the channel, and 45th degree at 1.1291). Pressure on the euro increased after a statement from the IMF labelling the Eurozone’s central economic forecast precarious.

Markets are currently under the influence of several factors: the likely lowering of interest rates by the Fed, the trade dispute between the US and China, uncertainty over Brexit, and sanctions against Iran and Venezuela.

Day’s news (GMT+3):

  • 15:30 US: retail sales (May).
  • 15:55 UK: BoE’s Governor Carney speech.
  • 16:15 US: industrial production (May).
  • 17:00 US: Michigan consumer sentiment index (Jun), business inventories (Apr).
  • 20:00 US: Baker Hughes US oil rig count.

EURUSD H1Current situation

Most of the majors are trading down in Asia. At the moment, we have a contradictory picture of the euro in terms of technical analysis. On the chart, I’ve laid out one scenario with a renewed minimum and a rebound to the balance line at 1.1290/95. Another potential scenario is a descending triangle formation and the downwards wave ending at 1.1251. I went with the first one because the stochastic is in the buy zone, and after a bullish divergence, there’s a good chance of the pair returning to around 1.13.

By Alpari.com

The pains must go with relaxation in the trading profession

If you can think about healing from the losses, there will not be good support most of the time. The trades will have to get some good performance from the most proper management. There is no way for the traders to income some good income from the trades either. The right kind of management will be coming in the way of good overall thinking for the trades. If you can get the right kind of trading mindset, the performance will be good. There will be more care for the safety of the trades. That is very good for the most proper management of the business. There are ways for traders to execute the most proper thinking. From there, do not try to maintain the most proper settlement of the trades. It is necessary for good and overall thinking of the trades. We will have to think about some good care though. Only then, proper relief will be possible from the losses.

Do not say anything about income

It is not right for the traders to think about income from the business. There will not be a good performance in the system of currency trading. We all have to know that it is the Forex trading system which will come against our executions of trades. For that, the right kind of performance will have to come with the best possible management. It is necessary for some good performance in the business. Too many good performances will also not be necessary for the traders. You can assume that we are talking about the income which can be in a big size. So think less about it and try to convert your focus onto the right management of the position sizes. If that will be possible for you there will be a good end to the right kind of trading performance. From there, we can also get a decent income every so often.

Forget about past trades

Losing is just a part of the Forex trading profession. Even the most experienced traders in Hong Kong loses money on a regular basis. Due to their strong risk management skills, they are able to cover up the loss by executing trades in the premium trading account. So try to be like a pro trader by developing your skills. Never think you can win big trades without doing the hard work. Push yourself to the edge and you will definitely become a profitable trader. Believe in yourself and focus on the next trades.

The right management is needed

As we were saying, the right kind of performance in the business of Forex is all about keeping it safe. All of the traders will have to know about it. And from the right kind of trading mindset, the traders also need some good overall thinking of a good performance. It is not like getting the most out of the trades. For that, you will have to know about the right kind of market analysis. The indicators and common chart patterns cannot go away from you without being noticed. The most proper management of the trading system will have to be getting good care. So, think about the management. It is not that tough for us to manage because the main topic is the risk per trade. Thinking about it will make sense to most of the traders about safety.

Justify the way to trade with care

Let go of the income intentions for the most proper trading performance. Time will tell you whether there is a chance of getting some good income. You will have to listen to the markets and execute the trades. It may not be pleasing for most of the traders but the most proper management of the business will have to get a good car from the traders. Think about it and manage some good planning for your business.

By Taylor Wilman


Ichimoku Cloud Analysis 13.06.2019 (AUDUSD, NZDUSD, USDCAD)

Article By RoboForex.com

AUDUSD, “Australian Dollar vs US Dollar”

AUDUSD is trading at 0.6910; the instrument is moving below Ichimoku Cloud, thus indicating a descending tendency. The markets could indicate that the price may test the cloud’s downside border at 0.6955 and then resume moving downwards to reach 0.6825. Another signal to confirm further descending movement is the price’s rebounding from the channel’s downside border. However, the scenario that implies further decline may be cancelled if the price breaks the cloud’s upside border and fixes above 0.6995. In this case, the pair may continue growing towards 0.7065.

AUDUSD_Анализ индикатора Ишимоку
Risk Warning: the result of previous trading operations do not guarantee the same results in the future

NZDUSD, “New Zealand Dollar vs US Dollar”

NZDUSD is trading at 0.6571; the instrument is moving below Ichimoku Cloud, thus indicating a descending tendency. The markets could indicate that the price may test the cloud’s upside border at 0.6588 and then resume moving downwards to reach 0.6490. Another signal to confirm further descending movement is the price’s rebounding from the resistance level. However, the scenario that implies further decline may be cancelled if the price breaks the cloud’s upside border and fixes above 0.6615. In this case, the pair may continue growing towards 0.6705.

NZDUSD_Анализ индикатора Ишимоку
Risk Warning: the result of previous trading operations do not guarantee the same results in the future

USDCAD, “US Dollar vs Canadian Dollar”

USDCAD is trading at 1.3326; the instrument is moving below Ichimoku Cloud, thus indicating a descending tendency. The markets could indicate that the price may the cloud’s downside border at 1.3340 and then resume moving downwards to reach 1.3175. Another signal to confirm further descending movement is the price’s rebounding from the channel’s upside border. However, the scenario that implies further decline may be cancelled if the price breaks the cloud’s upside border and fixes above 1.3415. In this case, the pair may continue growing towards 1.3505.

USDCAD_Анализ индикатора Ишимоку
Risk Warning: the result of previous trading operations do not guarantee the same results in the future

Article By RoboForex.com

Attention!
Forecasts presented in this section only reflect the author’s private opinion and should not be considered as guidance for trading. RoboForex LP bears no responsibility for trading results based on trading recommendations described in these analytical reviews.

The next Bitcoin run is imminent: deVere CEO

By George Prior

Bitcoin could be on the verge of the next bull run, affirms the CEO of one of the world’s largest independent financial advisory organizations.

The prediction from Nigel Green, founder and chief executive of deVere Group, comes as the Bitcoin price on Wednesday broke through the $8,000 barrier against the U.S. Dollar after a period of low volatility.

Mr Green observes: “Ditching its trademark volatility, Bitcoin has been stuck in no-man’s land for over a week oscillating within a $600 range.

“But the price of the world’s largest cryptocurrency surged to the upside on Wednesday and cleared the key $8,000 resistance level.”

He continues: “This could indicate that Bitcoin is on the verge of the next bull run.

“Crypto history teaches us that periods of low volatility come directly before extended crypto bull runs.

“For instance, Bitcoin went through a relatively stable period in February this year, then the price ran towards $4,200 in March and to $9,090 before the end of May.

“Should Bitcoin experience a new run, we can expect it to deliver a boost to the wider crypto market, with other leading cryptocurrencies such as Ethereum, XRP and Litecoin, rallying too.”

He goes on to say: “Volatility is typically welcomed by traders and investors as it can present important buying opportunities and bring positive rewards.

“However, I think moving forward, we are likely to see less extreme volatility. Lower volatility is a sign of the maturation of the cryptocurrency market.

“Although volatility will return again, as it does in all financial markets, I think we’re experiencing a fundamental shift and, overall, the crypto market will have less turbulent bouts in the future.  This is essential for the cryptocurrency sector long-term as it will further encourage mass adoption and institutional investment.”

The deVere CEO, a high-profile advocate of cryptocurrencies having launched the deVere Crypto app in 2018, concludes: “Of course, no-one knows for sure when the next crypto run will happen, but current relative low volatility suggests it is imminent.

“What we do know for sure, however, is that cryptocurrencies are the future of money.”

About:

deVere Group is one of the world’s largest independent advisors of specialist global financial solutions to international, local mass affluent, and high-net-worth clients.  It has a network of more than 70 offices across the world, over 80,000 clients and $12bn under advisement.