The USD, from a market perspective anyway, is facing in a very dovish set up; and that’s despite last week’s strong non-farm payrolls (NFP).
The NFPs certain throw out a red herring, its strength saw pairs whipsawing away from trend and did in fact knock out a previous trade idea in USD/JPY by hitting our stop. However, Friday week’s NFP rally has been short lived and the main event – a Dovish Fed – has finally grabbed hold of the USD.
In fact, Chairman Powell’s press conference mid-last week has actually made the July FOMC on the 30-31 st a fait accompli in the market’s eye. If we look at market probability pricing pre-NFP a 25-basis point (bps) cut was at 82%, Post-NFP below 50% and then after Powell’s testimony 93%.
It raises the bigger question in the USD dovish setup and that is: it's not ‘if’ the FOMC cuts, its ‘by how much’ will they cut?
A minority point to the FOMC minutes which suggests a ‘gradual’ approach to accommodation suggesting 25bps is more likely (I actually concur with this statement as there is still solid strength in the US economy). The majority however, seemed to favour a stronger move of up to 50bps at the July meeting. This is by no means a lock but is ‘stronger’ view currently.
Which Pair? The set up in the USD suggests you can almost choose your pair of choose. It is always ‘best practice’ to choose the pair you most comfortable with, thus for me its AUD/USD.
Straying Long AUD/USD
Entry: 0.6950 Target: 0.7200, Stop: 0.6900
Over the past year the AUD has been priced correctly, due to the slowdown in economics, inflation below trend and unemployment ticking up. This led to a pricing in of rate cuts, which have now been delivered in the form of two 25bp cuts back-to-back. If we couple this with the new government tax reform legislation the level of stimulus in the Australian economy should be a positive in the coming period and thus an AUDUSD positive.
If we also look at the US-China trade tensions this too appears to have abated (for now) again a risk F positive and even more so for an Asian-focused currency such as the AUD.
Trade Caveat:
Fed is hawkish even neutral – will hit all USD pairs
We believe Gold is setting up for an incredible upside breakout move after reaching our predicted target near $1450. For those of you that have been following our research and Gold calls, we’ve nailed this move and our October 2018 predictive modeling call has continued to mirror (almost exactly) the price movement in Gold over the past 10+ months. See the chart below.
Our Adaptive Dynamic Learning (ADL) predictive modeling system suggested that Gold would rally from the $1200 level to above $1300, then stall. It suggested that in April or May of 2019, Gold would settle back below $1300 and set up a “momentum base” before attempting an upside breakout move after forming the base. Our research team identified April 21~24 as the likely “price low” for the “momentum base” using our advanced price cycle and other research tools.
You can see from the chart, above, that our upside price targets from our original research are above $1550~1600. What if we told you we now believe the upside price targets could actually be above $1700 and more like $1750 to $1800 on a parabolic upside price rally initiating after price breaks critical resistance levels?
Take a look at this simple Gold/Silver/USDollar index chart. The purpose of this chart is to relate the price of Gold to the price of Silver in US Dollar price levels. It highlights that Silver is still very undervalued in comparison to Gold and that any attempt to restore a price balance between Silver and Gold would likely result in either two outcomes : A. the price of Gold falls, or B. the price of Silver rallies faster than Gold rallies whereas this ratio will attempt to balance out (as we see back in 2013/2014).
Our Price Amplitude Arcs are a means of measuring price cycles, price waves and allow us to seek out critical price inflection points. As you can see, where multiple arcs align and are breached by price, we typically see some type of increased price volatility and trending. Currently, two separate arcs are setting up to be breached and we believe this is important because of how it aligns with our October 2018 research post.
What would cause Gold to rally above $1600 at this time? Why would this become a period where renewed interest in precious metals could drive such a big move? We believe a number of global economic factors will become more evident over the next 30 to 60+ days and that these critical Price Amplitude Arcs are suggesting price is set up to rally from these levels. We believe the move higher will include both Gold and Silver and that Silver may rally stronger than Gold which would cause this Gold/Silver ratio chart price level to move higher – towards our objective line (MAGENTA).
We believe a key date for all traders/investors to be aware of is August 19, 2019 (+/- 5 days). We believe this will be the date range that the market will break out of existing ranges and when fear and greed will likely solidify in the precious metals markets. We have about 35 days to go before this date and we believe Gold will continue to trade below the “Breakout Resistance” until renewed fear and greed become more evident in the global markets.
This means the US Dollar will likely continue to rally, or at least stay above $96, for the next 25+ days and that upside US Dollar price activity will partially mute the upside price potential in precious metals. Overall, the upside price momentum in metals will push metals prices higher while the US Dollar continues to strengthen moderately. Once the US Dollar breaks lower, metals will skyrocket higher (breaking past the Breakout Resistance level) and begin the upside parabolic move.
Any opportunity you find where Gold is trading below $1400 is an excellent opportunity to prepare for this move. Silver continues to trade below $15.50 and continues to be an incredible opportunity for traders who understand the ratio levels of precious metals. Don’t miss this move. It is just a matter of time (30+ days) now.
Be prepared for these incredible price swings before they happen and learn how you can identify and trade these fantastic trading opportunities in 2019, 2020, and beyond with our Wealth Building & Global Financial Reset Newsletter. You won’t want to miss this big move, folks. As you can see from our research, everything has been setting up for this move for many months – most traders/investors have simply not been looking for it.
Join me with a 1 or 2-year subscription to lock in the lowest rate possible and ride my coattails as I navigate these financial market and build wealth while others lose nearly everything they own during the next financial crisis. Join Now and Get a 1oz Silver Round or Gold Bar Shipped To You Free.
I can tell you that huge moves are about to start unfolding not only in currencies, metals, or stocks but globally and some of these supercycles are going to last years. A gentleman by the name of Brad Matheny goes into great detail with his simple to understand charts and guide about this. His financial market research is one of a kind and a real eye-opener. 2020 Cycles – The Greatest Opportunity Of Your Lifetime
As a technical analysis and trader since 1997, I have been through a few bull/bear market cycles. I believe I have a good pulse on the market and timing key turning points for both short-term swing trading and long-term investment capital. The opportunities are massive/life-changing if handled properly.
BILLION GIVEAWAY – REAL GOLD OR SILVER WITH MEMBERSHIPS
So kill two birds with one stone and subscribe for two years to get your FREE GOLD BAR and enough trades to profit through the next metals bull market and financial crisis!
U.S. President Trump is wrong and is placing himself on the wrong side of history on Bitcoin – but cryptocurrencies should be regulated, says the boss of one of the world’s largest independent financial advisory organizations.
Nigel Green, the founder and CEO of deVere Group, is speaking out after Donald Trump took to Twitter to say: “I am not a fan of Bitcoin and other cryptocurrencies, which are not money, and whose value is highly volatile and based on thin air.
“If Facebook and other companies want to become a bank, they must seek a new Banking Charter and become subject to all Banking Regulations, just like other Banks, both National and International,” he added.
The President’s tweets follow last month’s announcement by Facebook that it is to launch its own new digital currency to be called Libra. It is designed to be a low-volatility currency that will let its users buy things or send money to people with very low fees.
It will be backed by reserves managed by an independent organisation, called the Libra Association, made up of several leading tech firms and non-profits that give the token real-world value.
Nigel Green affirms: “President Trump is wrong and is placing himself on the wrong side of history on Bitcoin and other cryptocurrencies.
“The blistering pace of the digitalisation of economies and our lives underscores that there will be a growing demand for digital, global, borderless money.
“Indeed, it is now almost universally regarded as the future of money.
“This is why most major financial institutions globally already have or are preparing to establish crypto desks. It is why more and more retail and institutional investors are piling into the market. And it is why tech giants, like Facebook, are getting involved. And you can bet that where Facebook follows, other tech companies will do the same.
“When everything from voting to music to books is already digital, dismissing digital currencies in a digital era is, frankly, bizarre and looks depressingly archaic.
“Does the President seriously think that traditional, fiat currencies are the way forward?”
Mr Green continues: “However, I agree with Mr Trump that Facebook’s new Libra project should be scrutinised.
“But, being the social media monolith that it is, it is surely expecting this level of scrutiny. I would suggest that it is prepared for it, has the resources for it, and will welcome it, as it will make its cryptocurrency stronger.”
He goes on to add: “The wider point here is regulation. Cryptocurrencies are already becoming mainstream. As such they should adhere to the same standards as the rest of the financial system.
“Regulation is necessary as it will provide further protection for the growing number of people using cryptocurrencies, the less likely it will be that criminals will use these digital payment methods, the less potential risk there will be for the disruption of global financial stability, and the more potential opportunities there will be for higher economic growth and activity in those countries which introduce it.
“And it is surely on its way, judging by the activities of regulators around the world.”
The deVere Group CEO concludes: “Standing on the sidelines, or worse looking backwards, on the issue of cryptocurrencies – which are redefining and reshaping the financial system – is a baffling approach for the leader of the world’s largest economy to take.”
About:
deVere Group is one of the world’s largest independent advisors of specialist global financial solutions to international, local mass affluent, and high-net-worth clients. It has a network of more than 70 offices across the world, over 80,000 clients and $12bn under advisement.
After reaching the short-term upside target, EURUSD has completed the correction at 1.1248; right now, it is forming the fifth wave towards 1.1300. Possibly, the pair may reach this level and then return to 1.1248. After that, the instrument may break it and then continue trading inside the downtrend with the target at 1.1180.
GBPUSD, “Great Britain Pound vs US Dollar”
After reaching the short-term upside target, GBPUSD has finished the correction at 1.2507; right now, it is forming the fifth ascending wave towards 1.2575. Later, the market may form a new descending structure to break 1.2500 and then continue trading inside the downtrend with the target at 1.2400.
USDCHF, “US Dollar vs Swiss Franc”
After reaching the downside target, USDCHF has completed the correction at 0.9898. Possibly, today the pair may consolidate. If later the price breaks this range to the upside, the instrument may continue trading upwards with the first target at 0.9999.
USDJPY, “US Dollar vs Japanese Yen”
USDJPY has finished the correction at 108.50; right now, it is consolidating. According to the main scenario, the price is expected to fall and break 108.00. After that, the instrument may continue trading downwards with the target at 107.20.
AUDUSD, “Australian Dollar vs US Dollar”
AUDUSD is moving upwards. Possibly, the pair may reach 0.6997 and then form a new descending structure to break 0.6940. Later, the market may form another consolidation range. If the price breaks this range to the upside, the instrument may form one more ascending structure towards 0.7000; if to the downside – continue trading inside the downtrend with the target at 0.6830.
USDRUB, “US Dollar vs Russian Ruble”
USDRUB is consolidating around 63.09. If later the price breaks this range to the downside, the instrument may start another decline to reach 62.22; if to the upside – form one more ascending structure with the target at 64.22.
XAUUSD, “Gold vs US Dollar”
Gold is consolidating around 1407.95. Possibly, today the pair may grow towards 1431.00 and then start another decline to return to 1407.95. After that, the instrument may break this level and then continue trading downwards with the target at 1382.00.
BRENT
Brent is consolidating at the top of the structure. Today, the pair may fall to break 66.66 and then reach the target at 63.75. This movement may be considered as a descending correction. Later, the market may continue trading inside the uptrend with the short-term target at 70.00.
Attention! Forecasts presented in this section only reflect the author’s private opinion and should not be considered as guidance for trading. RoboForex LP bears no responsibility for trading results based on trading recommendations described in these analytical reviews.
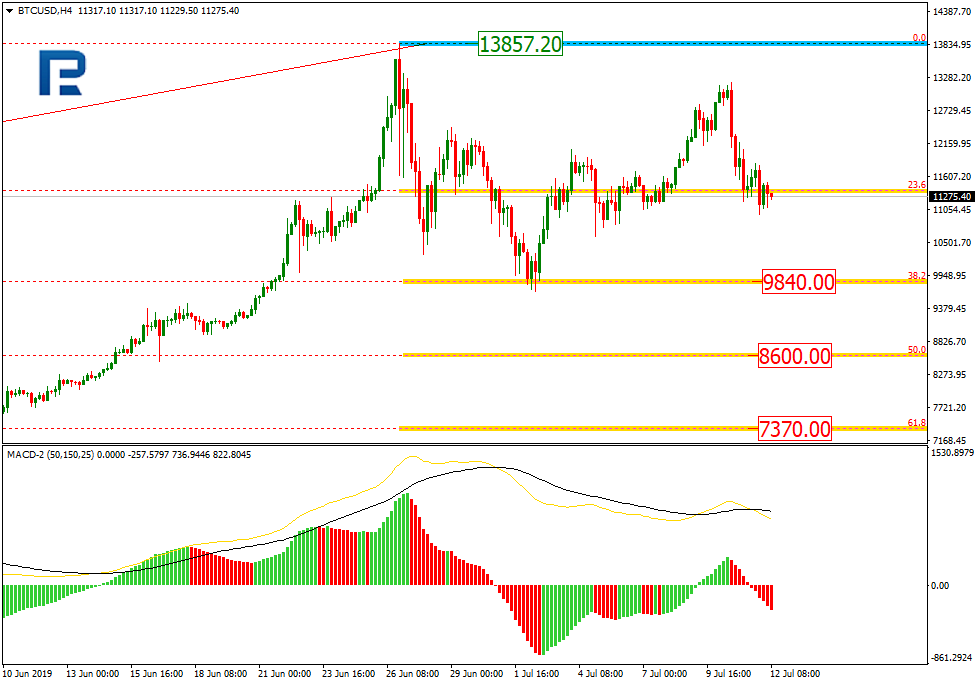
As we can see in the H4 chart, after attempting to reach the high at 13857.20, BTCUSD is forming a new descending wave, which may test 38.2% fibo at 9840.00 again, thus continuing the correction. The next downside targets may be 50.0% and 61.8% fibo at 860.00 and 7370.00 respectively.
The H1 chart shows more detailed structure of the current descending wave after the divergence. By now, it has already reached 61.8% and, after a slight pullback, may continue moving towards 76.0% fibo at 10520.00. The key downside target is the low at 9666.00.
As we can see in the daily chart, ETHUSD is still being corrected to the downside and has already reached 38.2% fibo. The next downside targets may be 50.0% and 61.8% fibo at 231.50 and 200.80. The resistance is the high at 363.18
Эфириум (Ethereum) на дневном таймфрейме демонстрирует достижение очередным импульсом спада уровня 38,2%, продолжая развивать коррекционную фазу. Далее котировки могут снизиться к уровням 50,0% (231,50) и 61,8% (200,80) по Фибоначчи. Сопротивлением служит максимум – 363,18.
The H1 chart shows more detailed structure of the current descending channel. Right now, the pair continues testing 38.2% fibo.
Attention! Forecasts presented in this section only reflect the author’s private opinion and should not be considered as guidance for trading. RoboForex LP bears no responsibility for trading results based on trading recommendations described in these analytical reviews.
The US dollar has stabilized against most world currencies. Investors are waiting for additional drivers. The quotes are consolidating around 1.12500 and 1.12800, respectively. According to the minutes of the last ECB meeting of the, the regulator does not exclude the introduction of additional incentive measures in the face of growing risks in the global economy. The technical picture signals a further recovery of the EUR/USD currency pair. We recommend to open positions from key levels.
The Economic News Feed for 12.07.2019:
– Manufacturer’s Price Index (US) – 15:30 (GMT+3:00);
The price has fixed above 50 MA and 100 MA, which indicates the strength of buyers.
The MACD histogram has started to rise, which also gives a signal to buy EUR/USD.
The Stochastic Oscillator is in the overbought zone, the %K line crossed the %D line. There are no signals at the moment.
Trading recommendations
Support levels: 1.12500, 1.12300, 1.12000
Resistance levels: 1.12800, 1.13100, 1.13500
If the price consolidates above 1.12800, expect further groth toward 1.13100-1.13400.
Alternatively, the quotes can drop to 1.12200-1.12000.
The GBP/USD currency pair
Technical indicators of the currency pair:
Prev Open: 1.24974
Open: 1.25234
% chg. over the last day: +0.16
Day’s range: 1.25182 – 1.25485
52 wk range: 1.2438 – 1.3631
The GBP/USD currency pair is in a lateral movement without a defined trend. Support and resistance levels are 1.25150 and 1.25650, respectively. GBP can correct further. The financial markets participants continue to monitor the situation around Brexit. Today we expect important economic releases from the United States. You should open positions from the key levels.
The Economic News Feed for 12.07.2019 is calm.
The price has fixed above 50 MA and 100 MA, which indicates the strength of buyers.
The MACD histogram is in the positive zone and continues to rise, which gives a strong signal to buy GBP/USD.
The Stochastic Oscillator is in the overbought zone, the %K line crossed the %D line. There are no signals at the moment.
Trading recommendations
Support levels: 1.25150, 1.24800, 1.24400
Resistance levels: 1.25650, 1.26000
If the price consolidates above 1.25650 expect further growth toward 1.26000.
Alternatively, the price could fall to 1.24800-1.24600.
The USD/CAD currency pair
Technical indicators of the currency pair:
Prev Open: 1.30806
Open: 1.30699
% chg. over the last day: -0.10
Day’s range: 1.30248 – 1.30717
52 wk range: 1.2727 – 1.3664
USD/CAD shows a negative trend and updated key extremes. At the moment, USD/CAD quotes are testing the local support of 1.30250. 1.30450 is already a “mirror” resistance. Trading instrument has the potential to decline further. A bullish mood on oil market provides additional support for CAD. You should open positions from the key levels.
The Economic News Feed for 12.07.2019 is calm.
The price has fixed below 50 MA and 100 MA, which indicates the strength of the sellers.
The MACD histogram is in the negative zone and continues to decline, which gives a strong signal to sell USD/CAD.
The Stochastic Oscillator is in the oversold zone, the %K line crossed the %D line. There are no signals at the moment.
Trading recommendations
Support levels: 1.30250, 1.30000, 1.29750
Resistance levels: 1.30450, 1.30750, 1.30900
If the price consolidates below 1.30250, expect a further decline toward 1.30000-1.29750.
Alternatively, the quotes can grow to 1.30650-1.30800.
The USD/JPY currency pair
Technical indicators of the currency pair:
Prev Open: 108.423
Open: 108.489
% chg. over the last day: +0.08
Day’s range: 108.290 – 108.610
52 wk range: 104.97 – 114.56
An ambiguous technical picture emerged on the USD/JPY currency pair. The trading instrument is consolidating. The safe haven currency tests local support and resistance levels: 108.300 and 108.600, respectively. USD/JPY quotes have a downside potential. We recommend to pay attention to the dynamics of the yield of US government bonds. Positions must be opened from key levels.
During Asian trading session Japan published weak data on the volume of industrial production in May.
Indicators do not give accurate signals: the price crossed 50 MA and 100 MA.
The MACD histogram is near the 0 mark.
The Stochastic Oscillator is in the oversold zone, theK line crossed theD line. There are no signals at the moment.
Trading recommendations
Support levels: 108.300, 108.150, 107.900
Resistance levels: 108.600, 108.750, 109.000
If the price consolidates below 108.300, the USD/JPY quotes are expected to fall. The potential movement to 108.000-107.800.
Alternatively, the quotes could grow to 108.750-109.000.
The US dollar is consolidating against a basket of major currencies. Investors took statements by Fed Chairman, Jerome Powell, on Wednesday as a signal for a further sharp fall in the key interest rate. However, a positive report on US inflation was published yesterday. Thus, according to the report, inflation accelerated by 0.3% (m/m) in June, while experts expected an increase by 0.2% (m/m). Also, the number of initial jobless claims dropped to 209K instead of 220K. Optimistic data that indicated a good state of the labor market weakened financial market expectations for a more aggressive rate cut by 50 basis points at the Fed meeting on July 30-31.
The European Commission has lowered the 2020 Eurozone GDP growth forecast to 1.4% from 1.5%. For 2019, the economic recovery estimate remains unchanged at 1.2%. The EC also lowered its growth forecast in the EU economy next year. The estimate of GDP growth in 27 countries for 2020 has been revised to 1.6% from 1.7%. According to the forecast, consumer prices in the Eurozone will increase by 1.3% in 2019-2020 against the forecasted 1.4%. The European Commission believes that duties imposed by the United States and China, may adversely affect the entire global economy. The slowdown in economic growth in the next two years may turn out to be even more significant if the United States and China continue to increase duties on each other’s goods. According to the minutes of the last meeting of the ECB, the regulator does not exclude the introduction of additional stimulus measures amid growing risks in the global economy.
The “black gold” prices continue to rise. At the moment, futures for the WTI crude oil are testing the mark of $60.70 per barrel.
Market Indicators
Yesterday, there was a variety of trends in the US stock markets: #SPY (+0.23%), #DIA (+0.83%), #QQQ (-0.07%).
The 10-year US government bonds yield has been growing. At the moment, the indicator is at the level of 2.10-2.11%.
The News Feed on 2019.07.12:
– Producer price index in the US at 15:30 (GMT+3:00).
On Thursday the 11th of July, trading on the euro closed slightly up. The EURUSD pair rose to 1.1280 in the Asian session. Trading on the dollar was mixed against the majors. It recovered its losses during the US session, where we saw a rise in consumer inflation.
The CPI report exceeded expectations to post the biggest rise since the beginning of last year. This caused a rise in US 10-year bond yields, while the euro dropped against the dollar to 1.1245.
Day’s news (GMT+3):
12:00 Eurozone: industrial production (May).
15:30 US: PPI (Jun).
20:00 US: Baker Hughes US oil rig count.
Current situation:
The pair corrected as expected, dropping after forming a third high. This is a typical pricing model among cryptocurrencies. The drop came to an end at the upper boundary of the channel, falling short of the 45th degree.
The majors are trading up against the dollar in today’s Asian session. Despite their rise, I’m expecting the euro to drop to the trend line against the dollar. If the price had corrected to the LB via a three-wave movement, we could have expected a rise above 1.13. As it turns out, the downwards correction isn’t over.
Given that the pair has risen in Asia without any trading volume, coupled with the fact that the stochastic oscillator is looking down, it makes more sense to expect a decline in the coming hours, rather than a rise. Our target is at 1.1233. This is where the 45th degree intersects the trend line, so I can’t see the pair dropping any lower.
After last week on Friday very solid Non-Farm Payrolls resulted in markets pricing completely out a 50 basis point rate cut by the Fed on her meeting on July 31, Fed chairman Powell’s testimonial before the House Financial Services Panel on Wednesday brought such a deep rate cut back on the table – and Gold eyeing its current yearly highs around 1,440 USD again.
Powell said that a number of government policy issues have yet to be resolved, including trade developments, the federal debt ceiling, and Brexit. And there is a risk that weak inflation will be even more persistent than the Fed currently anticipates.
As a result, US yields tumbled again (even though 10-year US-Treasury yields held above 2%) and Gold aggressively pushed back above 1,400 USD.
While the economic docket is quite thin into the weekly close, the device in the yellow metal seems to be ‘Buy the dip’ and on the lower time-frames the region around 1,405/407 USD should be carefully watched as a potential long-trigger.
In general, we consider another serious attack at the region around 1,440 USD an option as long as Gold holds above 1,380 USD:
Source: Admiral Markets MT5 with MT5-SE Add-on Gold Daily chart (between April 12, 2018 to 11 July 2019). Accessed: July 11, 2019, at 10:00pm GMT – Please note: Past performance is not a reliable indicator of future results, or future performance.
In 2014, the value of Gold fell by 1.7%, in 2015, it fell by 10.4%, in 2016, it increased by 8.1%, in 2017, it increased by 13.1%, in 2018, it fell by 1.6%, meaning that after five years, it was up by 6.4%.
Investing in Forex with Admiral Markets
Admiral Markets offers professional traders the ability to trade with a custom, upgraded version of MetaTrader 5, allowing you to experience trading at a significantly higher, more rewarding level. Experience benefits such as the addition of the Market Heat Map, so you can compare various currency pairs to see which ones might be lucrative investments, access real-time trading data, and so much more. Click the banner below to start your FREE download of MT5 Supreme Edition!
Disclaimer: The given data provides additional information regarding all analysis, estimates, prognosis, forecasts or other similar assessments or information (hereinafter “Analysis”) published on the website of Admiral Markets. Before making any investment decisions please pay close attention to the following:
This is a marketing communication. The analysis is published for informative purposes only and are in no way to be construed as investment advice or recommendation. It has not been prepared in accordance with legal requirements designed to promote the independence of investment research, and that it is not subject to any prohibition on dealing ahead of the dissemination of investment research.
Any investment decision is made by each client alone whereas Admiral Markets shall not be responsible for any loss or damage arising from any such decision, whether or not based on the Analysis.
Each of the Analysis is prepared by an independent analyst (Jens Klatt, Professional Trader and Analyst, hereinafter “Author”) based on the Author’s personal estimations.
To ensure that the interests of the clients would be protected and objectivity of the Analysis would not be damaged Admiral Markets has established relevant internal procedures for prevention and management of conflicts of interest.
Whilst every reasonable effort is taken to ensure that all sources of the Analysis are reliable and that all information is presented, as much as possible, in an understandable, timely, precise and complete manner, Admiral Markets does not guarantee the accuracy or completeness of any information contained within the Analysis. The presented figures refer that refer to any past performance is not a reliable indicator of future results.
The contents of the Analysis should not be construed as an express or implied promise, guarantee or implication by Admiral Markets that the client shall profit from the strategies therein or that losses in connection therewith may or shall be limited.
Any kind of previous or modeled performance of financial instruments indicated within the Publication should not be construed as an express or implied promise, guarantee or implication by Admiral Markets for any future performance. The value of the financial instrument may both increase and decrease and the preservation of the asset value is not guaranteed.
The projections included in the Analysis may be subject to additional fees, taxes or other charges, depending on the subject of the Publication. The price list applicable to the services provided by Admiral Markets is publicly available from the website of Admiral Markets.
Leveraged products (including contracts for difference) are speculative in nature and may result in losses or profit. Before you start trading, you should make sure that you understand all the risks.
Our researchers rely on a number of proprietary tools and cycle forecasting technology. Additionally, we use custom index charts to help measure price cycles, trends, support & resistance and many other aspects of the markets. Recently, we posted an article relating to the US Dollar and foreign currencies using custom index techniques. In the past, we’ve highlighted our Custom Price Cycle index that we use to gauge market sentiment, topping and bottoming setups. All of these tools are essential for our team of researchers while they attempt to identify trade setups and larger market events.
Currently, we are highlighting a number of our custom index chart that suggest a market top may only be 3 to 5 weeks away and the setup of this market top may surprise many traders. We posted a good forecast chart here also.
First, we’ll highlight our Smart Money Custom Index chart on a Monthly charting basis. As you can see since the ultimate price bottom in 2009, and using the price range from 2015 to 2016 (the rotation prior to the 2016 Presidential Elections) as the basis for the forward envelope, our Smart Money index shows the markets have rallied to levels just above the envelope in January 2018, then rotated lower to levels near the lower envelope levels in December 2018. This extended price rotation suggests the entire year of 2018 prompted a massive price rotation event that likely resulted in a price revaluation cycle.
Our researchers believe the strength of the US Dollar will continue to drive foreign investments into the US stock market and prompt a rally to levels near the middle of this price envelope before stalling and topping in August or September of 2019. This top formation should result in a price decline in the US stock market of at least 16% with a maximum decline level of somewhere between 24% to 28% overall. We’ll get into more detail about that later in this article.
We want our readers to understand this Custom Price Cycle chart highlights the level at which the price bottom will likely form, near the lower level of the current price envelope, and suggests the current price rally will likely attempt to breach key psychological price levels ($300: SPY, $3000: ES, $30k: INDU) before this new price top completes.
After these new price highs are reached above the key psychological price levels, we believe the new price top will immediately begin to form with a short period of sideways price action, then a price decline back below these psychological levels and likely initiating a downward price decline of at least 11 to 13%. It is our opinion that this downward price decline in the US stock market will align with increased global market weakness and currency devaluations that are likely to be much greater in scale and scope than the US stock market price decline.
We believe the US Dollar will continue to stay strong while staying above $95~96 throughout most of this price decline. We believe the strength in the US Dollar may be a catalyst for the future global market price declines and may also play out in future activities in precious metals and commodities.
The strength of the US Dollar, while foreign markets are contracting, would present a very ominous event as debt, credit and future operational standards of many foreign corporations, nations, governments, and consumers could come under severe pressures.
This Custom Price Cycle chart, below, highlights the current price setup of the US stock market in relation to previous high and low points. The closer we come to the upper price channel, the more likely we are to see price setup and seek out a price top formation. Although, history has shown that price can move up to these upper levels and continue to trend in an upward price channel for many weeks and months. So, at some point in the future, we would expect to see this Custom Price Cycle chart revert back to 2017 type price activity where price continually attempts to stay near the upper price channel levels with very mild price rotations.
Currently, though, we believe the US stock market is only 3 to 5 weeks away from a major price topping formation and that the downside price move will likely result in a, roughly, -16% to -25% downside price rotation before the end of 2019. We believe US earnings will push this Custom Price Cycle chart to levels near or above the upper price channel level and that will drive the US Dollar higher as well as a shift in capital deployment prior to the end of September. The shift will be away from technology and mid-caps and into the safety of cash, metals and large-cap equities.
This shift in capital investments will likely transpire over many weeks before a serious price breakdown begins. In other words, we expect a top formation to setup somewhere between August 15 and September 16. This top formation will likely result in 3~6 weeks of sideways downward pricing pressure before a larger price breakdown happens. We believe the larger price breakdown will coincide with some external economic event and result in a migration of capital away from risk and into cash/metals/safety. Right now, our estimate is that this external economic event may be a currency devaluation event (Asian currencies breaking down and putting pressure throughout Europe and the rest of the developing world).
It is very likely that some issue related to the US/China trade deal prompts this currency devaluation move or that some extended credit/debt crisis event becomes more evident to investors. We believe the Asian currencies are particularly at risk for this event and that European and development market currencies will likely collapse as a result of the Asian/European currency price declines.
The US technology sector could be uniquely vulnerable should this event unfold as we suspect. Foreign markets and investor are heavily invested in the US technology sector. Many of these investors have moved their capital into the US Technology sector to avoid risks related to their home country’s currencies and to take advantage of the US Dollar strength. A decline in the US stock market, of any level greater than 10%, could send a shock-wave through the global markets and cause investors to shift away from risk and into safety.
Expect to see the volatility index to start rising and for the price of options to jump as well. I posted this VIX chart and cycle analysis a couple of days ago and its good for another few weeks in terms of its direction.
IN CONCLUSION:
Our researchers believe we are only a few weeks away from this event and those Q2 US earnings will push the US stock market above these psychological price levels. It is this event, the push above the key psychological price levels ($ 300: SPY, $ 3000: ES, $ 30k: INDU) that will likely trigger the topping event and set off a chain reaction event that we have described.
Pay very close attention to how the foreign currency market reacts over this time-span and pay very close attention to Gold/Silver and the US Dollar. We believe this topping price formation is going to unfold just as we are suggesting and we believe this will be an incredible opportunity for skilled technical traders.
We’ll keep you informed as this plays out with Wealth Building & Global Financial Reset Newsletter if you like what I offer, join me with the 1 or 2-year subscription to lock in the lowest rate possible and ride my coattails as I navigate these financial market and build wealth while others lose nearly everything they own during the next financial crisis. Join Now and Get a Free 1oz Silver Round or Gold Bar Shipped To You!
I can tell you that huge moves are about to start unfolding not only in metals, or stocks but globally and some of these supercycles are going to last years. A gentleman by the name of Brad Matheny goes into great detail with his simple to understand charts and guide about this. His financial market research is one of a kind and a real eye-opener. 2020 Cycles – The Greatest Opportunity Of Your Lifetime
As a technical analysis and trader since 1997, I have been through a few bull/bear market cycles. I believe I have a good pulse on the market and timing key turning points for both short-term swing trading and long-term investment capital. The opportunities are massive/life-changing if handled properly.
IM GIVING THEM AWAY WITH 2-YEAR MEMBERSHIPS
So kill two birds with one stone and subscribe for one or two years to get your FREE BULLION and enough trades to profit through the next metals bull market and financial crisis!