On Wednesday the 24th of July, trading on the euro closed slightly down against the dollar (-0.09%), with trading opening at 1.1150 and closing at 1.1139. The intraday high of 1.1155 was reached in both the European and US sessions, although the bears managed to bring the rate down to 1.1126 during the European session on the back of weak German data, where the manufacturing PMI came out worse than the already pessimistic expectations, marking a decline on the previous reading.
The Markit manufacturing PMI for July came out at 43.1 points, marking a 1.9 point drop on last month’s value of 45 points. The Eurozone is seeing a similar trend, with a drop from 52.2 to 51.5 points. The effects of these reports were short-lived, however, as US PMI data was also worse than expected, with the latest value dropping from its previous value of 50.6 points to 50 against a forecasted rise to 51, resulting in a rise for the euro and a decline on the dollar.
Day’s news (GMT+3):
14:45 Eurozone: ECB interest rate decision.
15:30 US: durable goods orders (Jun).
15:30 Eurozone: ECB monetary policy statement and press conference.
Current situation:
Nothing major has changed since yesterday, and the market continues to inch towards 1.1108. This level may be reached, and even breached, during the announcement of the ECB interest rate decision and the subsequent monetary policy statement. We may see some sharp fluctuations amid increased volatility, so any short positions that were opened with the breakout of 1.1194 should ideally have protective stop levels in place.
Nearly a decade ago, the globe experienced the biggest banking system failures we had seen in nearly a century. The exposure to risk that was inherent throughout the global banking system was so completely ignored that when the crisis unfolded, hardly anyone completely understood the depth of the risks at play. Could it happen again? Now?
Have foreign banking institutions extended credit and debt risks beyond safe levels again? Are Deutsche Bank risk factors going to complicate an already fractured Asia, China, and Europe? What are the signs we should be looking for in terms of extended weakness or a breaking point?
In the first part of this research article, we highlighted the risk factors detailed by two separate public articles we found interesting. Deutsche Bank derivatives risk is listed at $49 trillion and extends across the globe into the global banking sector. We believe the economic slowdown being experienced throughout must of the globe could quickly expose a great chance for some type of contagion event to unfold.
Our research suggests the US banking sector and economy may be somewhat immune from this event this time having already learned its lesson from 2008-09. Still, we believe this potential event should be on every trader’s mind going forward – especially in relation to our August 19 stock market prediction.
This second part of the article will attempt to investigate how the US Fed and US interest rates may complicate the speed of this potential contagion event and how it may have compounded the credit crisis of 2008-09. Additionally, we’ll consider how multiple QE processes over the past 8+ years may have created the perfect setup for a new foreign banking/credit contagion event in the near future.
First, we’ll explore exactly when QE actions took place and ended. Secondly, we’ll compare these with the derivatives and risk exposure activities to attempt to determine a correlative comparison.
This chart of the S&P 500 highlights exactly when QE activities started and ended. It also highlights US fed debt investment activities (taper).
Have the global markets been fading the US Fed and decreasing leverage when the QE functions are at risk of ending or when the US Fed pushes rates higher? What are the risk factors for the global markets if the foundation of the global economy is based on “fading the Fed” and this easy US Dollar carry-trade/economic boom cycle expectation?
If our analysis is correct, then we can state that foreign nations and governments are hooked on the easy US Dollar/US Fed QE functions even more so than the US is dependent on a strong US economy and a strong US Dollar. It would appear that foreign banks, governments, and financial institutions became addicted to the idea that easy US Dollars would allow them to run a massive debt expansion scheme where they could borrow US Dollars for near 0% interest and deploy this capital as credit into their economies. This credit quickly entered their shadow banking and gray banking processes where it ran through various forms with limited restrictions and oversight. Could the easy-money policies of the past 8 years actually have created one of the biggest global credit risks in our future?
CONCLUDING THOUGHTS:
In short, it certainly seems as though the global banking institutions could get caught with their pants down if certain economic processes continue. First, if commodities continue to collapse (oil, copper, steel and other infrastructure/transport essentials), then commodity-backed loans will continue to default – sending shock-waves through the shadow and traditional banking systems.
If the US Fed continues to keep rates near current levels and when borrowers need to extend terms at current rates, this creates a scenario where borrowers may need to pay rates far greater than they can offset as profits – creating a negative return and extended defaults.
If foreign banks have extended loans into the shadow/gray banking system under the expectation that the US Federal Reserve would never attempt to move rates above 1% to 1.5% while foreign trade and economic activities continue to decline, the potential for decreased income/revenues pushing debt default levels higher becomes a real risk going forward.
A contagion event could become a much more real possibility of two or more of these events continue to extend out into 2020 or longer.
We believe we are already nearing a minor contagion event within the EU and Asia/China. We believe the debt/banking sectors are about to experience a wave of continued defaults and shake-outs as the US Fed navigates future expectations. Deutsche Bank is the one to watch in Europe because the extended debt risks associated with DB could become the black hole that sucks the rest of the foreign financial sector into an abyss.
Pay attention to the news and risk factors at play over the next few weeks and months. Plan and prepare for increased volatility as this event continues to unfold. Follow our research to learn how to protect your assets and find ways to profit from these events.
You should be starting to get a feel of where stocks are headed along with precious metals for the next 8-24 months. The next step is knowing when and what to buy and sell as these turning points take place, and this is the hard part. If you want someone to guide you through the next 12-24 months complete with detailed market analysis and trade alerts (entry, targets and exit price levels) join my ETF Trading Newsletter.
This bear market has been a long time coming, but finally, almost all the signs are showing that it’s about to start. As a technical analyst since 1997 having lost a fortune and made fortunes from bull and bear markets I have a good understanding of how to best attack the market during its various stages.
Be prepared for these incredible price swings before they happen and learn how you can identify and trade these fantastic trading opportunities in 2019, 2020, and beyond with our Wealth Building & Global Financial Reset Newsletter. You won’t want to miss this big move, folks. As you can see from our research, everything has been setting up for this move for many months – most traders/investors have simply not been looking for it.
Join me with a 1 or 2-year subscription to lock in the lowest rate possible and ride my coattails as I navigate these financial market and build wealth while others lose nearly everything they own during the next financial crisis.
As a technical analysis and trader since 1997, I have been through a few bull/bear market cycles. I believe I have a good pulse on the market and timing key turning points for both short-term swing trading and long-term investment capital. The opportunities starting to present themselves will be life-changing if handled properly.
FREE GOLD OR SILVER WITH MEMBERSHIP!
Kill two birds with one stone and subscribe for two years to get yourFREE PRECIOUS METAL and get enough trades to profit through the next metalsbull market and financial crisis!
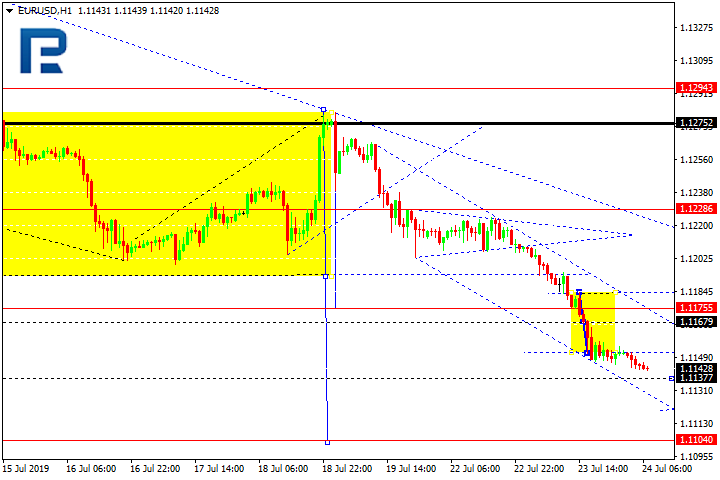
The pair has reached 1.1180 and broken it downwards through the consolidation range. There is potential for continuation of the trend to 1.1111. The goal is local.
GBPUSD
The instrument has created a consolidation range around 1.2480 and broken it top down. There is potential for a decline to 1.2404, after which growth to 1.2480 may follow.
USDCHF
The pair has created a consolidation range around 0.9852. Today the market has escaped it upwards. There is potential for growth to 0.9876. The goal is local. Then a decline to 0.9852, then growth to 0.9898 may follow. The goal is first.
USDJPY
The instrument keeps developing the structure of growth. Today it may reach 108.34, then continue the downtrend to 107.37. Upon breaking this level downwards potential for continuation of the trend to 106.44 may appear. The goal is local.
AUDUSD
Today the instrument keeps developing the second impulse for declining. The goal is at 0.6969. The goal is local. Then growth to 0.7014, and then a decline to 0.6947 may follow.
USDRUB
The pair has reached 63.25 in accordance with the correction matrix. Today the development of a consolidation range around this level seems possible. Upon escaping the correction channel downwards another wave of declining to 62.25 may begin.
GOLD
Gold is trading in the structure of the third impulse for decline. The goal is at 1412.50. Then a correction to 1440.15 may begin, followed by a decline to 1414.30.
BRENT
Oil is trading in a correction structure aimed at 64.35. Then another structure of declining to 61.08 may develop, followed by growth to 64.35. Practically, we are considering the development of a wide consolidation range.
Attention! Forecasts presented in this section only reflect the author’s private opinion and should not be considered as guidance for trading. RoboForex LP bears no responsibility for trading results based on trading recommendations described in these analytical reviews.
On H4 we can see that the first correcting wave of growth after a convergence reached 38.2% Fibo in relation with the previous descending trend. The new impulse for declining may be regarded as another wave of descending into the post-correctional extension area of 138.2-161.8% (1.2400 – 1.2335). However, if the impulse do not break the local minimum, a bonce may provoke the beginning of another wave of growth and the extension of the correction phase to 50.0% (1.2583) and 61.8% (1.2630).
On H1 it can be noted that the short-term downtrend has been corrected by growth to 38.2% Fibo. The correcting growth may go on to 50.0% (1.2488), 61.8% (1.2505) and 76.0% (1.2525). A breakthrough of the minimum at 1.2417 may signal further decline.
EURJPY
On H4 the pair demonstrates the end of the correction phase and stable development of the downtrend wave. The goals of the decline are: 76.0% (120.25) and the post-correction extension area 138.2-161.8% (119.80-119.20) Fibo. The resistance is at 61.8% (21.61).
On H1 a downtrend to 76.0% (120.25) Fibo is developing, forming a convergence.
Attention! Forecasts presented in this section only reflect the author’s private opinion and should not be considered as guidance for trading. RoboForex LP bears no responsibility for trading results based on trading recommendations described in these analytical reviews.
The EUR/USD currency pair continues to show negative dynamics. During yesterday’s and today’s trading, the drop in quotes exceeded 65 points. The trading instrument reached two-month lows. EUR remains under pressure due to rising expectations that the ECB may announce the introduction of additional stimulus measures in the near future. The meeting of the Central Bank will be held on Thursday, July 25. Today, investors will be evaluating important economic releases from the eurozone and the US. Quotes EUR/USD can decline further. We recommend to open positions from key levels.
The Economic News Feed for 24.07.2019:
– a number of indicators on business activity in Germany and the EU – 10:30 (GMT + 3:00) and 11:00 (GMT + 3:00);
– primary real estate sales in the US – 17:00 (GMT + 3:00).
Indicators signal the strength of sellers: the price has fixed below 50 MA and 100 MA.
The MACD histogram is in the negative zone, but above the signal line, which gives a weak signal to sell EUR/USD.
The Stochastic Oscillator started to go out of the oversold zone, the %K line is above the %D line, indicating a technical correction of the EUR/USD currency pair.
Trading recommendations
Support levels: 1.11400, 1.11000
Resistance levels: 1.11650, 1.11850, 1.12100
If the price consolidates below 1.11400, the price will fall toward 1.11000.
Alternatively, the quotes can correct toward 1.11800-1.12000.
The GBP/USD currency pair
Technical indicators of the currency pair:
Prev Open: 1.24673
Open: 1.24370
% chg. over the last day: -0.30
Day’s range: 1.24283 – 1.24497
52 wk range: 1.2397 – 1.3385
The technical picture on the GBP/USD currency pair is still ambiguous. The pound is trading in a flat. Currently, local support and resistance levels are: 1.24200 and 1.24550, respectively. Sterling remains under pressure due to uncertainty around Brexit. Boris Johnson will be the 77th prime minister of Great Britain. Earlier, the official repeatedly stated that Britain would withdraw from the block before October 31, even under the conditions of “tough” Brexit. Positions must be opened from key levels.
Today we recommend to pay attention to economic reports from the USA.
Indicators do not give accurate signals: the price is consolidated near 50 MA and 100 MA.
The MACD histogram is in the negative zone, but above the signal line, which gives a weak signal to sell GBP/USD.
The Stochastic Oscillator is in the neutral zone, the %K line is above the %D line, which indicates bullish moods.
Trading recommendations
Support levels: 1.24200, 1.23850
Resistance levels: 1.24550, 1.24850, 1.25100
If the price consolidates below 1.24200, the price will fall toward 1.23850-1.23600.
Alternatively, the quotes can grow toward 1.24850-1.25000.
The USD/CAD currency pair
Technical indicators of the currency pair:
Prev Open: 1.31179
Open: 1.31307
% chg. over the last day: +0.16
Day’s range: 1.31307 – 1.31433
52 wk range: 1.2727 – 1.3664
The USD/CAD currency pair has stabilized after a sharp rally since the beginning of this week. At the moment, CAD is consolidating. Local levels of support and resistance are 1.31200 and 1.31450, respectively. In the near future technical correction is not excluded. Investors expect statistics from the United States. We also recommend to pay attention to the dynamics of oil prices. Positions must be opened from key levels.
The Economic News Feed for 24.07.2019 is calm.
The price has fixed above 50 MA and 100 MA, which indicates the strength of buyers.
The MACD histogram is located in the positive zone, but below the signal line, which gives a weak signal to buy USD/CAD.
The Stochastic Oscillator is in the neutral zone, the %K line has started to cross the %D line. There are no signals at the moment.
Trading recommendations
Support levels: 1.31200, 1.30950, 1.30650
Resistance levels: 1.31450, 1.31650, 1.32000
If the price consolidates above the level of 1.31450, the quotes will grow toward to 1.31700-1.32000.
An alternative would be a correction of the USD/CAD quotes to 1.31000-1.30850.
The USD/JPY currency pair
Technical indicators of the currency pair:
Prev Open: 107.852
Open: 108.217
% chg. over the last day: +0.33
Day’s range: 108.105 – 108.277
52 wk range: 104.97 – 114.56
A bullish sentiment still prevails on the USD/JPY currency pair. At the moment the trading instrument is consolidating. Key levels of support and resistance are 108.000 and 108.350. Financial market participants expect additional drivers. We recommend to pay attention to economic releases, as well as the dynamics of the US Treasury bonds yield. Positions must be opened from key levels.
The Economic News Feed for 24.07.2019 is calm.
The price has fixed above 50 MA and 100 MA, which indicates the strength of buyers.
The MACD histogram is located in the positive zone, but below the signal line, which gives a weak signal to buy USD/JPY.
Stochastic Oscillator is in the neutral zone, the %K line is below the %D line, indicating a bearish mood.
Trading recommendations
Support levels: 108.000, 107.800, 107.600
Resistance levels: 108.350, 108.600
If the price consolidates above the 108.350 the price will rise toward 108.600-108.800.
Alternatively, the quotes can decline toward 107.800-107.600.
The US dollar is strengthening against a basket of major currencies despite weak economic data. So, existing home sales counted to only 5.27M in July instead of the forecasted value of 5.35M. The US dollar index (#DX) closed in the positive zone (+0.49%). Euro’s decline supports the US currency. Thus, the euro has reached two-month lows before the ECB meeting. Financial market participants expect the ECB to give signals for lowering interest rates at tomorrow’s meeting.
UK Prime Minister, Theresa May, is resigning today due to the victory of Boris Johnson in the election of the Conservative Party leader. Thus, from today, Johnson will become the 77th Prime Minister of the UK. It should be recalled that the official is a supporter of the “hard” Brexit and most likely wants the UK to exit the EU before October 31. At the same time, some members of the Conservative Party are ready to oppose Johnson and his Brexit position. It is not yet known whether the official will be able to enlist the support of the majority in the House of Commons and avoid no-deal Brexit. Otherwise, his opponents will act against him.
The “black gold” prices show positive dynamics. At the moment, futures for the WTI crude oil are testing the mark of $57.10 per barrel. At 17:30 (GMT+3:00) weekly crude oil inventories will be published in the US.
Market Indicators
Yesterday, the bullish sentiment was observed in the US stock markets: #SPY (+0.72%), #DIA (+0.63%), #QQQ (+0.65%).
The 10-year US government bonds yield is at 2.05-2.06%.
The news feed for 2019.07.24:
– A number of indicators on economic activity in Germany and the Eurozone at 10:30 (GMT+3:00) and 11:00 (GMT+3:00), respectively; – New home sales in the US at 17:30 (GMT+3:00).
We also recommend paying attention to the speech by the UK Prime Minister Theresa May.
At a glance, the economic calendar looks quite packed on Wednesday and there looks to be some potential market movers for US yields which could result in some price action fireworks in the USD/JPY.
However, we are a little sceptical if chances are really so high to see big moves in the currency pair, as we find ourselves currently in the FOMC blackout period which started last Saturday and where we should expect volatility to stay subdued.
After the comments from NY Fed president Williams last Thursday, “to take swift action when faced with adverse economic conditions” and “keep interest rates lower for longer,” which was interpreted as exceedingly dovish. It resulted in a short-term push in expectations of a 50 basis point rate cut from the Fed on July 31, to nearly 70%, and we are now back at an approximately 75% likelihood of a 25 basis point rate cut which isn’t likely to significantly change even if we get to see some data surprises today.
Technically, the picture stays neutral on a daily time-frame between 106.80 and 109.00, even though with a bearish touch below 109.00. Mid-term, we see the clear advantage in the USD/JPY on the short-side, especially if the Fed delivers a dovish stance on July 31 with a target around 105.00 and lower:
Source: Admiral Markets MT5 with MT5-SE Add-on USD/JPY Daily chart (between July 19, 2018, to July 23, 2019). Accessed: July 23, 2019, at 10:00pm GMT – Please note: Past performance is not a reliable indicator of future results, or future performance.
In 2014, the value of the USD/JPY increased by 13.7%, in 2015, it increased by 0.5%, in 2016, it fell by 2.8%, in 2017, it fell by 3.6%, in 2018, it fell by 2.7%, meaning that after five years, it was up by 4.1%.
Investing in Forex with Admiral Markets
Admiral Markets offers professional traders the ability to trade with a custom, upgraded version of MetaTrader 5, allowing you to experience trading at a significantly higher, more rewarding level. Experience benefits such as the addition of the Market Heat Map, so you can compare various currency pairs to see which ones might be lucrative investments, access real-time trading data, and so much more. Click the banner below to start your FREE download of MT5 Supreme Edition!
Disclaimer: The given data provides additional information regarding all analysis, estimates, prognosis, forecasts or other similar assessments or information (hereinafter “Analysis”) published on the website of Admiral Markets. Before making any investment decisions please pay close attention to the following:
This is a marketing communication. The analysis is published for informative purposes only and are in no way to be construed as investment advice or recommendation. It has not been prepared in accordance with legal requirements designed to promote the independence of investment research, and that it is not subject to any prohibition on dealing ahead of the dissemination of investment research.
Any investment decision is made by each client alone whereas Admiral Markets shall not be responsible for any loss or damage arising from any such decision, whether or not based on the Analysis.
Each of the Analysis is prepared by an independent analyst (Jens Klatt, Professional Trader and Analyst, hereinafter “Author”) based on the Author’s personal estimations.
To ensure that the interests of the clients would be protected and objectivity of the Analysis would not be damaged Admiral Markets has established relevant internal procedures for prevention and management of conflicts of interest.
Whilst every reasonable effort is taken to ensure that all sources of the Analysis are reliable and that all information is presented, as much as possible, in an understandable, timely, precise and complete manner, Admiral Markets does not guarantee the accuracy or completeness of any information contained within the Analysis. The presented figures refer that refer to any past performance is not a reliable indicator of future results.
The contents of the Analysis should not be construed as an express or implied promise, guarantee or implication by Admiral Markets that the client shall profit from the strategies therein or that losses in connection therewith may or shall be limited.
Any kind of previous or modeled performance of financial instruments indicated within the Publication should not be construed as an express or implied promise, guarantee or implication by Admiral Markets for any future performance. The value of the financial instrument may both increase and decrease and the preservation of the asset value is not guaranteed.
The projections included in the Analysis may be subject to additional fees, taxes or other charges, depending on the subject of the Publication. The price list applicable to the services provided by Admiral Markets is publicly available from the website of Admiral Markets.
Leveraged products (including contracts for difference) are speculative in nature and may result in losses or profit. Before you start trading, you should make sure that you understand all the risks.
On Tuesday the 23rd of June, trading on the euro closed significantly down against the dollar after spending virtually the whole day in a downtrend. A speech from RBA Deputy Governor Christopher Kent and an announcement from US President Donald Trump on a bipartisan budget agreement bolstered the US dollar. The euro shed 4.6%, slumping from the 1.1207 mark to close the day at 1.1151.
The announcement of Boris Johnson as the victor in the Conservative Party’s vote for a new leader, confirming his as the new Prime Minister, as well as speeches from the Bank of England’s MPC, helped to set a stable downwards trend on the EURUSD pair, leading to a breakout of some key levels around 1.1194. The dollar’s rise was finally mitigated by weak housing data in the US.
Day’s news (GMT+3):
10:30 Germany: Markit manufacturing PMI (Jul).
11:00 Eurozone: Markit manufacturing PMI (Jul).
16:45 US: Markit manufacturing PMI (Jul).
17:00 US: new home sales (Jun).
Current situation:
The pair is approaching the support zone between 1.1128 and 1.1108. We have the ECB and Fed meetings ahead, where decisions will be made on the economies’ key rates. Markets expect the US Fed to lower interest rates at the next meeting, while there are hints at an easing of monetary policy by the ECB. Depending on how markets react to this, we could get a bounce from 1.1108, with the euro further strengthening.
Almost a decade ago, the global financial crisis of 2008-09 exposed billions of people to the risks within the global financial/banking sector. With all this money flowing around the globe and with banks able to facilitate greater and more diverse risk/derivatives investments, the central banks and insurance companies are left with an incredible “black hole” of exposed risk that is almost impossible to quantify. When we add the shadow/gray market banking risks into this equation and begin to understand the complexity of commodity-backed or Purchase Order backed financing that has become commonplace throughout the planet, we have to ask ourselves one question – “what would it take for these risks to become another crisis?”
Deutsche Bank Massive Exposure Could Cripple Europe
A recent article we found on ZeroHedge highlights the risk exposure from Deutsche Bank and how that derivatives/banking risk could spill over into another global financial market crisis again.
The ZeroHedge article stated that Deutsche Bank has $49 trillion dollars in derivatives exposure, making it the single greatest danger to Europe and global financial institutions imaginable at this time.
This additional article from TheStreet, from May 2016, highlights the continued risks associated with the global financial system and the level of derivatives risk that is inherent in the system.
Here is a quote from that article that attempts to rationalize debt exposure…
”Let’s take the latest data in Deutsche Bank’s annual report for 2015. It shows that the bank’s total, notional exposure to derivatives transactions is 41.9 trillion euros ($46.8 trillion). While that’s more than 35% lower than its 2013 exposure, it still looks huge.
However, after offsetting the positive and negative exposures against each other, the net exposure is a much more manageable 18.2 billion euros ($20.3 billion).”
The data that we’ve been able to find regarding US exposure to the global derivatives market is rather limited in scope. The Federal Reserve Bank of St. Louis provides some data, but we believe this data fails to include shadow/gray banking risks. Traders must be aware of the fact that the global economy has been running on ether after the 2009 market collapse. Global central banks have poured capital into the markets and foreign economies have consumed vast amounts of easy-money capital to run up huge debt levels while creating massive shadow/gray level financial systems.
In our opinion, the current global banking situation is far more fragile now than it was 10 years ago. The US is in a far better position to handle risks and exposure to risks than it was in 2008-09 and the real issue before us is the level of unknown risks that are a complete black hole in the foreign markets.
Ray Dalio Says Gold Is the Best Asset During Global Financial Reset And Eric Sprott Likes Gold Also.
A recent article by Ray Dalio, he stated gold is the asset in which we should all be accumulating as it will be a top performer globally when things start to fall apart. On May 31st Eric Sprott talked about my gold forecast in detail. Since then I have accumulated more gold and silver from Eric Sprott’s company https://www.SprottMoney.com/ and you should too.
Eric Sprott Gold & Silver
Federal Reserve Bank Data Is A Warning Sign
Ok, now take a look at these graphs from the Federal Reserve Bank of St. Louis to see the data that is currently being reported.
Net US Acquisitions of non-derivatives assets have been relatively tame over the past 6+ years. We can see from this chart the continued acquisition of assets from 2002 through 2007-08 – just before the credit crisis event. Then, we can see how dramatically the assets were dumped between 2007 and 2009. We’re not seeing that type of setup or event play out currently in the US.
This next chart highlights the US financial derivatives net position and we can see the peak in 2008-09 and the dramatic deleveraging that has taken place over the past 8+ years. This chart shows the US financial derivatives levels are less than 25% of the levels from the start of 2008. ($31B vs $125B).
This last chart highlights the fact that US investors and institutions have been deleveraging from derivatives recently – as shown by the net negative transactions data on this chart. This suggests that investors are worried about the future and have been attempting to remove risk from their investments since the peak in early 2018. Notice similar net transaction declines in 2014-15 and 2009-10.
We believe the dips in these assets are related to US Quantitative Easing actions and investor concerns regarding the elimination of easy money policies. We will take a look at when and how these correlations to risk aversion and QE actually take place in Part II.
In the second part of this article, we’ll explore how the US economy, US Fed and global banking sector could be complicating this derivative risk exposure and how traders need to prepare for this event – if it takes place as we suspect.
If you want to see 5 other crucial warning signs about the US markets and global economic downturn just take a look at this short video and charts.
In early June I posted a detailed video explaining in showing the bottoming formation and gold and where to spot the breakout level, I also talked about crude oil reaching it upside target after a double bottom, and I called short term top in the SP 500 index. This was one of my premarket videos for members it gives you a good taste of what you can expect each and every morning before the Opening Bell. Watch Video Here.
I then posted a detailed report talking about where the next bull and bear markets are and how to identify them. This report focused mainly on the SP 500 index and the gold miners index. My charts compared the 2008 market top and bear market along with the 2019 market prices today. See Comparison Charts Here.
On June 26th I posted that silver was likely to pause for a week or two before it took another run up on June 26. This played out perfectly as well and silver is now head up to our first key price target of $17. See Silver Price Cycle and Analysis.
More recently on July 16th, I warned that the next financial crisis (bear market) was scary close, possibly just a couple weeks away. The charts I posted will make you really start to worry. See Scary Bear Market Setup Charts.
On June 17th I showed my chart of the transportation index forming a double top formation. It’s known that the transportation index leads the broad stock market and if the transports are breaking down then we must expect the bear market is close. I then went on to talk about the precious metals breakout with silver and silver miners leading the way. Gold miners broke out as well while gold continued to hold its bullish formation. See Transportation index double top.
CONCLUDING THOUGHTS:
In short, you should be starting to get a feel of where stocks are headed along with precious metals for the next 8-24 months. The next step is knowing when and what to buy and sell as these turning points take place, and this is the hard part. If you want someone to guide you through the next 12-24 months complete with detailed market analysis and trade alerts (entry, targets and exit price levels) join my ETF Trading Newsletter.
This bear market has been a long time coming, but finally, almost all the signs are showing that it’s about to start. As a technical analyst since 1997 having lost a fortune and made fortunes from bull and bear markets I have a good understanding of how to best attack the market during its various stages.
Be prepared for these incredible price swings before they happen and learn how you can identify and trade these fantastic trading opportunities in 2019, 2020, and beyond with our Wealth Building & Global Financial Reset Newsletter. You won’t want to miss this big move, folks. As you can see from our research, everything has been setting up for this move for many months – most traders/investors have simply not been looking for it.
Join me with a 1 or 2-year subscription to lock in the lowest rate possible and ride my coattails as I navigate these financial market and build wealth while others lose nearly everything they own during the next financial crisis.
As a technical analysis and trader since 1997, I have been through a few bull/bear market cycles. I believe I have a good pulse on the market and timing key turning points for both short-term swing trading and long-term investment capital. The opportunities starting to present themselves will be life-changing if handled properly.
FREE GOLD OR SILVER WITH MEMBERSHIP!
Kill two birds with one stone and subscribe for two years to get yourFREE PRECIOUS METAL and get enough trades to profit through the next metalsbull market and financial crisis!
Boris Johnson will be an impotent Prime Minister – but his impotency is his not-so-secret weapon, says the CEO of one of the world’s largest independent financial advisory organizations.
The comments from Nigel Green follow the confirmation of Mr Johnson as next British Prime Minister and as the pound falls to three-day lows against the dollar amid fears he will pursue no-deal Brexit.
Mr Green affirms: “Boris Johnson will be an impotent Prime Minister. Theresa May faced tricky arithmetic in parliament, but her successor will have it even harder.
“After a series of defections from serving politicians and the potential loss of two seats in special elections, the ruling Conservatives’ parliamentary tiny majority is on the brink of collapse.
“This arithmetic, together with the fact that the EU has shot down Mr Johnson’s Brexit plan within moments of his appointment as leader – signalling it has no plans to make concessions – makes the job of leaving the European Union with a deal almost impossible. No-deal is looking increasingly likely.”
He continues: “Yet this impotency is likely to be Boris Johnson’s secret weapon.
“This is because all he has to do is do nothing to ensure a no-deal happens by default on 31 October. Then in early November, he will call an election being able to claim to have delivered Brexit. This will secure him votes from right-wing Conservatives and Brexit Party supporters, he will be capitalising on an opposition Labour Party with low poll ratings for its leader, and making Liberal Democrat opposition to Brexit and their call for a second referendum irrelevant as the UK would have already left the EU.”
He goes on to add: “Mr Johnson’s impotency, which is fuelling a looming hard break from the EU, will not only work politically, but if it goes to plan, it could also work economically for the UK.
“Whilst it is a huge gamble – and one he seems willing to embrace – a quicker and cleaner exit from the EU could indeed deliver an unexpected boost for the pound and the UK economy as international and domestic investors get the clarity they crave before stepping off the sidelines and investing in Britain.”
Earlier today, the deVere CEO noted: “The surprise could be that a clarity of purpose of a Johnson administration on the overriding issue of the day – Brexit – could well give the pound a lift.
“The importance of clarity for the markets and business should not be underrated. It now just remains to be seen if the former London Mayor and foreign secretary delivers on what he has said– or whether there will simply be more Boris bluster, which would sink the pound further and kill-off investment hopes.”
Mr Green concludes: “It looks set that impotency will define Boris Johnson’s premiership in the short to medium term. But being the impotent Prime Minister could suit him very well politically – and economically if his gamble pays off.”
About:
deVere Group is one of the world’s largest independent advisors of specialist global financial solutions to international, local mass affluent, and high-net-worth clients. It has a network of more than 70 offices across the world, over 80,000 clients and $12bn under advisement.
 Current situation: