Author Archive for InvestMacro – Page 197

Energy Sets Up Two New Trades – Here They Are

By TheTechnicalTraders.com

Before we discuss these incredible trade setups in the Energy sector, we have to discuss the continued shifting global economy and how that relates to these setups.  Nearly three weeks ago, we posted a research article suggesting Crude Oil would call to levels near $50 over the next 30+ days, then stall for about 45 days before falling further and potentially attempting new lows near $40 ppb.  It is important to understand certain aspects of the global economy, economic demand and how it relates to seasonal patterns for Energy.

We believe the move lower is Crude Oil is related to a supply glut that continues to plague the global markets while global economic trade, shipping, and activity continue to weaken.  Too much oil supply with weakening global economic activity means Crude Oil will likely waffle lower until this dynamic changes.

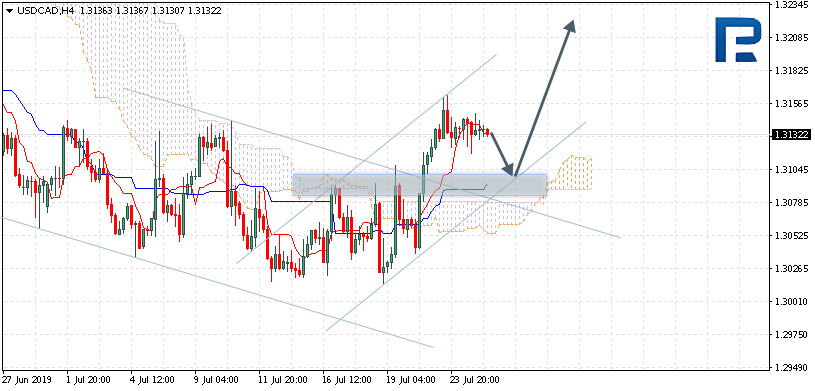
Please read our recent research post to know where Crude Oil is likely to head next. Also this crude oil, prediction uses our oil price DNA algorithm to show us the future price range of oil.

Other energy-related symbols, like Natural Gas and ERY, are set up for a different type of price move.

The reality of the situation is that once Crude Oil reaches to levels near $50 ppb, it is very likely that a support level will push Crude back higher (as we suggest in our research) which will align with a seasonal pattern for Natural Gas and early Winter demand for heating oil.  September, October, and November are typically a ramp-up period for winter demand and end of year holiday travel.  People tend to take advantage of the last bit of Summer to seek out vacation spots, prepare for winter and push the cold back as long as possible.

Future contracts may move higher, in preparation of this seasonal trend, many months before the season actually starts.  This is the reason we believe the energy sector is setting up some incredible opportunities for skilled technical traders.

The weekly chart of Natural Gas

This first Weekly chart of Natural Gas highlights a basing pattern that we’ve been following for months.  We believe any move below $2.30 is a strong bottoming/basing setup for skilled traders and our predictive modeling systems suggest we are just weeks (3 to 5+) away from a big upside move in NG.

We believe natural gas will continue to fall and base. Once a bottom has been made the upside potential for NG over the next 60+ days is quite substantial.  We believe an in initial upside move after it bottoms will be to levels above $3.15 will take place before October 10 and that potential for an extreme breakout upside move above $4.00 is quite likely before the end of November 2019.

Please read this article to learn more about our research into NG and the opportunities that are setting up now.  Also, this post we shared Natural Gas Moves Into Basing Zone.

ERY – Bear Energy Sector Chart

Keeping in mind that the setup within the energy sector is two-fold.  First, Oil and NG will continue to fall and base/bottom (moving slightly lower over the next few weeks).  This is why ERY is such a great setup right now.  Any breakdown in energy commodity prices over the next 3~5 weeks will push ERY 15% to 25% higher from current levels – which is exactly what we are expecting to happen.

Then, as Crude Oil and Natural Gas base in their support zones, ERY will peak which is when we want to pull profits from ERY and watch other bullish energy ETFs for long side setups.

From current levels, we believe ERY will target $50 to $52.50 fairly quickly as Crude Oil and NG continue to move lower and setup a momentum base within the basing zone/support range.  Remember Crude Oil should move to levels near $50 (a full 10% lower than current price levels) before basing.

Concluding Thoughts:

As we’ve been suggesting for months, 2019 and 2020 are setting up to be incredible years for skilled technical traders.  These moves in commodities, energy, and metals are providing us with trade after trade of 10%, 20% or more.  Almost every month, the markets are setting up 10 to 15+ incredible trading opportunities and all we have to do is time our entries and run these trades as we do any other trade. Not all trade setups are the kind we like and we only enter the ones that we think have the highest opportunity and lowest risk.

Get ready because these incredible setups in Metals and Energy should keep you busy pulling the trigger to create profits over the next 5+ months or longer with my  Wealth Building & Global Financial Reset Newsletter

Join me with a 1 or 2-year subscription to lock in the lowest rate possible and ride my coattails as I navigate these financial market and build wealth while others lose nearly everything they own during the next financial crisis.

Join Now and Get a 1oz Silver Round or Gold Bar Shipped To You Free. Follow our research and visit www.TheTechnicalTraders.com to learn how we can help you find and execute better trades.

Chris Vermeulen
Technical Traders Ltd.


Fibonacci Retracements Analysis 26.07.2019 (Bitcoin, Ethereum)

Article By RoboForex.com

Bitcoin

On H4 the currency is completing a short-term pullback and starting a new wave of decline. If the quotations manage to break through the local minimum 9098.90, further decline may be aimed at 50.0% (8600.00) and 61.8% (7370.00) Fibo. The resistance is at 23.6% (11380.00).

BTCUSD
Risk Warning: the result of previous trading operations do not guarantee the same results in the future

On H1 we can see that after a convergence the market is trying to develop a wave of growth towards 50.0% (11142.00) Fibo. However, the main trend is still descending.

BITCOIN
Risk Warning: the result of previous trading operations do not guarantee the same results in the future

Эфириум (Ethereum)

On H4 the ETH demonstrates a correction period upon reaching 61.8% Fibo. The correcting wave of growth failed to reach 38.2% (239.40) Fibo However, the next wave of growth may do it and rise to 50.0% (254.50). Upon completing the correction a breakaway of the minimum and a decline to 76.0% (163.75) may follow.

ETHUSD
Risk Warning: the result of previous trading operations do not guarantee the same results in the future

On H1 we may see that, after a convergence, an impulse of growth has formed, which may develop into an uptrend to the target levels.

ETHEREUM
Risk Warning: the result of previous trading operations do not guarantee the same results in the future

Article By RoboForex.com

Attention!
Forecasts presented in this section only reflect the author’s private opinion and should not be considered as guidance for trading. RoboForex LP bears no responsibility for trading results based on trading recommendations described in these analytical reviews.

Investors Assess the ECB Meeting Results

by JustForex

The US dollar is changing slightly against a basket of major currencies. The US dollar index (#DX) closed with a slight increase (+0.07%). Yesterday, optimistic economic data from the US were published. Thus, core durable goods orders rose by 1.2% in June instead of the forecasted growth by 0.2%. Initial jobless claims decreased to 206K instead of 220K.

At the same time, the euro strengthened against the US currency after the ECB decided on the interest rate. Thus, the regulator left the key marks of monetary policy unchanged. In addition, the ECB has changed its forecast for the further course of rate. It is expected that key rates will remain at the same level or will be lower at least until the end of the first half of 2020, or until inflation in the Eurozone returns to the 2% level.

The “black gold” prices continue to rise. At the moment, futures for the WTI crude oil are testing the mark of $56.30 per barrel.

Market Indicators

Yesterday, aggressive sales were observed in the US stock markets: #SPY (-0.48%), #DIA (-0.45%), #QQQ (-0.95%).

The 10-year US government bonds yield has been growing. Currently, the indicator is at the level of 2.07-2.08%.

The news feed for 2019.07.26:

– GDP data in the US at 15:30 (GMT+3:00).

by JustForex

EUR/USD bears find new fuel thanks to the ECB – 1.1100 in focus

By Admiral Markets

Source: Economic Events July 26, 2019 – Admiral Markets’ Forex Calendar

After the ECB rate decision yesterday, and the Fed rate decision coming up next Wednesday, we want to focus today on the EUR/USD.

The currency pair saw a drop over the last few days, and went for a test of its current yearly lows after the ECB statement was released.

While the ECB kept interest rates unchanged, it adjusted its forward guidance in a way which allows rate cuts, but also rate tiering (to relieve pressure on European banks resulting out of a collapse in yields) and QE in the near-term.

In addition to that, the mentioning of inflationary pressures which have been persistently below levels that are in line with the central bank’s aim (note: 2%), and as long as that’s the case, the ECB will adjust all of its instruments as appropriate.

With that said, further monetary stimulus should be expected, coming probably in September, with the European Central Bank lowering interest rates into negative territory. So, the already expected rate cut from the Fed next Wednesday will most likely not trigger a sharp reversal in the EUR/USD.

This is especially true if today’s US GDP Growth Rate data comes in better than the expected 1.8%. After the solid Retail Sales data on July 16 (which saw a print of 0.4% against the expected 0.1%), and knowing that Retail Sales account for around 30% of the GDP, a better-than-expected US GDP print is a serious option and could trigger some USD strength if it results in an “out-pricing” of a fourth rate cut in 2019 in the Fed Watch Tool.

Technically, we carefully watch the region around 1.1180/1200 as a potential Short-trigger, against which a sustainable break below 1.1100 could be anticipated. The outlook on H4 stays clearly bearish as long as we trade below 1.1280/1300:

Source: Admiral Markets MT5 with MT5-SE Add-on EUR/USD 4-hour chart (between June 11, 2018, to July 25, 2019). Accessed: July 25, 2019, at 10:00pm GMT – Please note: Past performance is not a reliable indicator of future results, or future performance.

Source: Admiral Markets MT5 with MT5-SE Add-on EUR/USD Daily chart (between April 20, 2018, to July 19, 2019). Accessed: July 19, 2019, at 10:00pm GMT – Please note: Past performance is not a reliable indicator of future results, or future performance.

In 2014, the value of the EUR/USD fell by 11.9%, in 2015, it fell by 10.2%, in 2016, it fell by 3.2%, in 2017, it increased by 13.92%, 2018, it fell by 4.4%, meaning that after five years, it was down by 16.5%.

Investing in Forex with Admiral Markets

Admiral Markets offers professional traders the ability to trade with a custom, upgraded version of MetaTrader 5, allowing you to experience trading at a significantly higher, more rewarding level. Experience benefits such as the addition of the Market Heat Map, so you can compare various currency pairs to see which ones might be lucrative investments, access real-time trading data, and so much more. Click the banner below to start your FREE download of MT5 Supreme Edition!

Download MetaTrader 5 and begin trading today!

Disclaimer: The given data provides additional information regarding all analysis, estimates, prognosis, forecasts or other similar assessments or information (hereinafter “Analysis”) published on the website of Admiral Markets. Before making any investment decisions please pay close attention to the following:

  1. This is a marketing communication. The analysis is published for informative purposes only and are in no way to be construed as investment advice or recommendation. It has not been prepared in accordance with legal requirements designed to promote the independence of investment research, and that it is not subject to any prohibition on dealing ahead of the dissemination of investment research.
  2. Any investment decision is made by each client alone whereas Admiral Markets shall not be responsible for any loss or damage arising from any such decision, whether or not based on the Analysis.
  3. Each of the Analysis is prepared by an independent analyst (Jens Klatt, Professional Trader and Analyst, hereinafter “Author”) based on the Author’s personal estimations.
  4. To ensure that the interests of the clients would be protected and objectivity of the Analysis would not be damaged Admiral Markets has established relevant internal procedures for prevention and management of conflicts of interest.
  5. Whilst every reasonable effort is taken to ensure that all sources of the Analysis are reliable and that all information is presented, as much as possible, in an understandable, timely, precise and complete manner, Admiral Markets does not guarantee the accuracy or completeness of any information contained within the Analysis. The presented figures refer that refer to any past performance is not a reliable indicator of future results.
  6. The contents of the Analysis should not be construed as an express or implied promise, guarantee or implication by Admiral Markets that the client shall profit from the strategies therein or that losses in connection therewith may or shall be limited.
  7. Any kind of previous or modeled performance of financial instruments indicated within the Publication should not be construed as an express or implied promise, guarantee or implication by Admiral Markets for any future performance. The value of the financial instrument may both increase and decrease and the preservation of the asset value is not guaranteed.
  8. The projections included in the Analysis may be subject to additional fees, taxes or other charges, depending on the subject of the Publication. The price list applicable to the services provided by Admiral Markets is publicly available from the website of Admiral Markets.
  9. Leveraged products (including contracts for difference) are speculative in nature and may result in losses or profit. Before you start trading, you should make sure that you understand all the risks.

By Admiral Markets

The Analytical Overview of the Main Currency Pairs on 2019.07.26

by JustForex

The EUR/USD currency pair

Technical indicators of the currency pair:
  • Prev Open: 1.11408
  • Open: 1.11461
  • % chg. over the last day: +0.04
  • Day’s range: 1.11424 – 1.11509
  • 52 wk range: 1.1111 – 1.2009

Yesterday, EUR/USD had high trading activity and volatility were observed. The ECB, as expected, kept the main parameters of monetary policy at the same level. The trading instrument retreated from two-month lows, disappointing some market participants who made a weakening bet. The head of the Central Bank, Mario Draghi, said that the interest rates would remain at or below the level until at least the end of the first half of 2020. At the moment, the EUR/USD quotes are consolidating in the range of 1.11300-1.11550. Today, investors will evaluate important statistics from the United States. Positions must be opened from these marks.

At 15:30 (GMT+3:00) the US will publish a GDP report.

EUR/USD

Indicators do not give accurate signals: the price crossed 50 MA and 100 MA.

The MACD histogram is near 0.

The Stochastic Oscillator is in the neutral zone, the %K line crossed the %D line. There are no signals at the moment.

Trading recommendations
  • Support levels: 1.11300, 1.11000
  • Resistance levels: 1.11550, 1.11850, 1.12100

If the price consolidates below 1.11300, expect a further devline toward 1.11000-1.10800.

Alternatively, the quotes can correct toward 1.12000.

The GBP/USD currency pair

Technical indicators of the currency pair:
  • Prev Open: 1.24828
  • Open: 1.24440
  • % chg. over the last day:-0.24
  • Day’s range: 1.24257 – 1.24596
  • 52 wk range: 1.2397 – 1.3385

The bearish mood prevails on the GBP/USD currency pair. During yesterday’s and today’s trading, the drop in quotes exceeded 50 points. The pound has updated local lows. At the moment, the key range is 1.24200-1.24550. GBP/USD quotes have the potential to further decline. Investors are concerned about the “tough” Brexit scenario. Today, financial market participants will evaluate the US GDP report. We recommend to open positions from key levels.

The news background on the UK economy is calm.

GBP/USD

Indicators of accurate signals do not give: 50 MA crossed 100 MA.

The MACD histogram is in the negative zone and continues to decline, indicating a drop in GBP/USD quotes.

The Stochastic Oscillator is in the oversold zone, the %K line crossed the %D line. There are no signals at the moment.

Trading recommendations
  • Support levels: 1.24200, 1.23850
  • Resistance levels: 1.24550, 1.24900, 1.25200

If the price consolidates below 1.24200, expect a further descend toward 1.23850-1.23600.

Alternatively, the price will grow toward 1.24800-1.25000.

The USD/CAD currency pair

Technical indicators of the currency pair:
  • Prev Open: 1.31395
  • Open: 1.31556
  • % chg. over the last day: +0.14
  • Day’s range: 1.31528 – 1.31683
  • 52 wk range: 1.2727 – 1.3664

The USD/CAD currency pair has once again shifted to growth. CAD updated local maxima. At the moment, the USD/CAD quotes are consolidating near the resistance level of 1.31700. 1.31450 is already a “mirror” support. Trading instrument has the potential for further growth. Financial market participants expect a report on US GDP. We also recommend to pay attention to the dynamics of oil prices. Positions must be opened from key levels.

The Economic News Feed for 26.07.2019 is calm.

USD/CAD

Indicators indicate the strength of buyers: the price has fixed above 50 MA and 100 MA.

The MACD histogram is in the positive zone and continues to rise, which signals a further increase in the USD/CAD quotes.

The Stochastic Oscillator is in the neutral zone, the %K line is above the %D line, which also indicates bullish moods.

Trading recommendations
  • Support levels: 1.31450, 1.31200, 1.30950
  • Resistance levels: 1.31700, 1.32000

If the price fixes above 1.31700, expect further growth toward 1.32000-1.32200.

Alternatively, the price will drop toward 1.31200-1.31000.

The USD/JPY currency pair

Technical indicators of the currency pair:
  • Prev Open: 108.177
  • Open: 108.648
  • % chg. over the last day: +0.45
  • Day’s range: 108.561 – 108.742
  • 52 wk range: 104.97 – 114.56

The USD/JPY currency pair shows a positive trend. Trading tool updated key extremes. At the moment, the USD/JPY quotes are consolidating. Local levels of support and resistance are: 108.500 and 108.750, respectively. We expect statistics on US GDP. We also recommend tracking up-to-date information regarding trade negotiations between the US and China. USD/JPY quotes have the potential for further growth. Positions must be opened from key levels.

The Economic News Feed for 26.07.2019 is calm.

USD/JPY

The price has fixed above 50 MA and 100 MA, which indicates the strength of buyers.

The MACD histogram is located in the positive zone, but below the signal line, which gives a weak signal to buy USD/JPY.

The Stochastic Oscillator is in the neutral zone, the% K line is above the% D line, which also gives a signal to buy USD/JPY.

Trading recommendations
  • Support levels: 108.500, 108.250, 108.000
  • Resistance levels: 108.750, 109.000

If the price consolidates above the level of 108.750, expect further growth toward 109.000-109.200.

Alternatively, the quotes can descend toward 108.300-108.100.

by JustForex

Silver Price Target during the Next Bull Market

By TheTechnicalTraders.com

It is time to explore the details of our Gold vs. Silver ratio research and to start to understand the potential for profits within this move in precious metals.  The first part of our research article highlighted the Gold vs. Silver ratio and why we believe the “reversion process” that is taking place in price could be an incredible opportunity for traders.

Historically, when the Gold vs. Silver ratio reaches an extreme level, and precious metals begin to rally, a reversion within the ratio takes place, which represents a revaluation process for silver prices compared to gold prices.  This typically means that the prices of Silver will accelerate to the upside as the price of gold moves higher – resulting in a decrease in the ratio level.

This reversion process related to precious metals pricing is an opportunity for traders to take advantage of an increased pricing advantage to generate profits.

For every drop of 5.0 points in the gold/silver ratio, the price of Silver should increase by 6.5% to 7.5% to the price of Gold.

This research is based on our belief that Gold and Silver will continue to rally and potentially enter a parabolic upside price advance soon.  If this takes place and precious metals begin to skyrocket higher, the ratio level will react in a hyperactive “reversion process” where Silver may move higher at a rate that is substantially faster than Gold.  This is the process that we are exploring and our researchers are attempting to shed some insight into this event.

I believe a reversion process has already begun to take place within the precious metals market.  We believe this reversion process is about to explode as a dramatic revaluation event unfolds over the next 12+ months.  This process will become more evident to traders as the price of Gold continues to rally towards the $1750+ level and as the price of Silver explodes higher in larger and larger advances.

Gold/Silver/US Dollar ratio chart

This Gold/Silver/US Dollar ratio chart is the basis of our analysis for the reversion process event and the associated revaluation event.  Our previous analysis suggests Gold will attempt a move to levels above $1650 to $1700 on the next breakout move higher.  This next upside price move will expose the price reversion event for all traders to witness and we have mapped out the expected Silver price advantage for all traders going forward.

Gold/Silver Ratio – Silver Price vs Ratio Level

We put together this reference table to assist all traders in understanding just how important this move could be to them.  This reference table shows the current Gold/Silver price levels (in GREY) as the ratio levels change from 88 to lower levels.

If the price of Gold were to stay at the same $1426 level while Silver rallied to prompt an 82 or 77 ratio level, the price of silver would move from the current price of $16.19 to $17.39 or $18.52 in order to reflect this decreased ratio level.  That represents a 7.5% to 14.3% price increase.

Yet if the price of Gold advances to $1650 or $1750 while the ratio level drops to the 82 or 77 ratio level (because Silver advances fast than Gold), then the price of Silver would move from the current price of $16.19 to $20.12 to $22.73.  That move represents a 24.2% to 40.3% price increase in Silver when Gold increased only 15.7% to 22.7%.

What If Silver Advances Quicker Than Gold?

If Silver advances even faster than our “what if” scenario, above, and Gold continues to advance as we expect, the increased price reversion process taking place in Silver as a process of this revaluation event could result in a 70% to 110% fast price advance in Silver than the price advance that takes place in Gold.

We believe the next upside price leg in Silver will target $19.50 to $22.75.  This target range supports the highlighted area on our Ratio table (below).  In other words, we believe the ratio level will attempt to quickly move toward the 70 to 77 level as Gold prices rally over the next few months.  This would push silver up into the $22.50 to $25 price level very quickly.

What If Gold Rallies Faster Than Silver?

If Gold were to rally above $1950 on an extended upside price advance before August or September, we believe the reversion process would become extremely hyperactive in nature and the price of Silver could push well above $29~34 per ounce – may be even higher.

This declining ratio level acts as a turbo-boost for the price of Silver as Gold continues to advance.  The recent rotation to the downside suggests the ratio relationship between Gold and Silver has already stated a reversion process – the only question is “where will it end?”.  Our researchers believe it will stop where it stops and we believe the 65 level on the Ratio chart is just the initial target for this first upside leg.

Imagine where Silver could go if the ratio level fell to levels below 40 and gold rallied to $2500 or more?  Ok, stop imagining and take a look at this second extended ratio table.

Pay attention to the fact that Silver could rally more than 300% if Gold moves up above $1750 and the Gold/Silver ratio drops below the 55 level.  If Gold were to continue to rally and the Gold/Silver ratio continued to fall, Silver could rally well above $50 over the long run.

Silver Price Range As Gold/Silver Ratio Move To the Average

We’ve attempted to graph the ranges of the expected move in Silver into segments based on the Gold/Silver ratio to assist traders in understanding just how powerful this setup really is.  Imagine what it would take for Gold to move up to levels above $1750 (which is our expected target for the next leg higher) and for Silver to rally into the 55 to 65 ratio level.  If that happens, the expected target price for Silver would be somewhere between $30 and $40 – more than 100% higher than the current price of Silver.

If you think $50 is unimaginable or unrealistic, we’ve just shown you why it is possible these levels could be reached before the end of 2019 or in 2020.  If you have not grasped the reality of what is likely to unfold over the next 6 to 12+ months in the global markets and that precious metals are the setup of the decade, then pay attention to the fact that gold and silver are poised for moves ranging from 40% to 240% over the next 12+ months depending on the scale and scope of this move.

Our current objectives for the ratio levels are still 55 to 65 within this next move higher where Gold will target $1750.  Beyond that level, we’ll have to update you as the price continues to explore new highs.

CONCLUDING THOUGHTS:

In short, don’t miss the trade of the decade. These opportunities for skilled technical traders over the next 16+ months is incredible.  Huge price swings, incredible trends, big rotations and we could see nearly 300%+ profits to be had if you know what to trade and when.  These types of opportunities are perfect for skilled technical traders like us and we want to help you prepare for and trade these opportunities.

This bear market for stocks and the new bull market for metals has been a long time coming, but finally, almost all the signs are showing that it’s about to start. As a technical analyst since 1997 having lost a fortune and making a fortune from bull and bear markets I have a good understanding of how to best attack the market during its various stages.

Be prepared for these incredible price swings before they happen and learn how you can identify and trade these fantastic trading opportunities in 2019, 2020, and beyond with our  Wealth Building & Global Financial Reset Newsletter.  You won’t want to miss this big move, folks.  As you can see from our research, everything has been setting up for this move for many months – most traders/investors have simply not been looking for it.

Join me with a 1 or 2-year subscription to lock in the lowest rate possible and ride my coattails as I navigate these financial market and build wealth while others lose nearly everything they own during the next financial crisis. Join Now and Get a 1oz Silver Round or Gold Bar Shipped To You Free.

I can tell you that huge moves are about to start unfolding not only in currencies, metals, or stocks but globally and some of these supercycles are going to last years. A gentleman by the name of Brad Matheny goes into great detail with his simple to understand charts and guide about this. His financial market research is one of a kind and a real eye-opener. 2020 Cycles – The Greatest Opportunity Of Your Lifetime

As a technical analysis and trader since 1997, I have been through a few bull/bear market cycles. I believe I have a good pulse on the market and timing key turning points for both short-term swing trading and long-term investment capital. The opportunities are massive/life-changing if handled properly.

FREE GOLD & SILVER WITH MEMBERSHIPS

Kill two birds with one stone and subscribe for two years to get your FREE PRECIOUS METAL and get enough trades to profit through the next metals bull market and financial crisis!

Chris Vermeulen – TheTechnicalTraders.com


Japanese Candlesticks Analysis 25.07.2019 (EURUSD, USDJPY)

Article By RoboForex.com

EURUSD

On H4 the pair is testing the horizontal support level, forming reversal patterns, including an Inverted Hammer. In the current trading situation it may be supposed that if the signal for the reversal patterns is realized, the price may bonce and head for 1.1200, forming a descending channel. AT the same time, a breakaway of the support level and a decline to 1.1120 are not to be excluded.

EURUSD
Risk Warning: the result of previous trading operations do not guarantee the same results in the future

USDJPY

On H4, inside the downtrend, the pair has formed a group of reversal patterns, including a Doji. At the current stage of the reversal pattern realization we can see a small flat. Comparing with the previous movements, we may suppose that upon testing the upper border of the channel the price may start declining to 107.20. AT the same time a reverse scenario should not be excluded: the price may break through the resistance, renew the maximums and grow towards 108.96.

USDJPY

Article By RoboForex.com

Attention!
Forecasts presented in this section only reflect the author’s private opinion and should not be considered as guidance for trading. RoboForex LP bears no responsibility for trading results based on trading recommendations described in these analytical reviews.

Ichimoku Cloud Analysis 25.07.2019 (AUDUSD, NZDUSD, USDCAD)

Article By RoboForex.com

AUDUSD

The instrument is trading at 0.6963 below the Cloud, which suggests a descending trend. Testing of the signal lines of the Cloud near 0.6975 is expected, followed by a decline to 0.6915. Yet another signal of decline may be a bounce off the upper border of the descending channel. The scenario may no longer be valid in case the upper border of the Cloud is broken and trading closes above 0.7015, which may be followed by further growth above 0.7085.

AUDUSD
Risk Warning: the result of previous trading operations do not guarantee the same results in the future

NZDUSD

The instrument is trading at 0.6692 below the Ichimoku Cloud which suggests a descending trend. A test of the lower border of the Cloud near 0.6705 is expected, followed by a decline to 0.6645. Yet another signal of decline may be a bounce off the upper border of the descending channel. The scenario may no longer be valid in case the upper border of the Cloud is broken and trading closes above 0.6750, which may be followed by further growth to 0.6835.

NZDUSD
Risk Warning: the result of previous trading operations do not guarantee the same results in the future

USDCAD

The instrument is trading at 1.3132 above the Ichimoku Cloud which suggests an ascending trend. Testing of the signal lines of the indicator near 1.3105 is expected, followed by growth to 1.3210. Yet another signal of growth may be a bounce off the lower border of the ascending channel. The scenario may no longer be valid in case the lower border of the Cloud is broken and trading closes below 1.3050, which may be followed by further decline to 1.2965.

USDCAD

Article By RoboForex.com

Attention!
Forecasts presented in this section only reflect the author’s private opinion and should not be considered as guidance for trading. RoboForex LP bears no responsibility for trading results based on trading recommendations described in these analytical reviews.

The Analytical Overview of the Main Currency Pairs on 2019.07.25

by JustForex

The EUR/USD currency pair

Technical indicators of the currency pair:
  • Prev Open: 1.11515
  • Open: 1.11408
  • % chg. over the last day: -0.09
  • Day’s range: 1.11331 – 1.11432
  • 52 wk range: 1.1111 – 1.2009

The EUR/USD currency pair has stabilized after a rather long decline. At the moment, investors have are waiting for the ECB meeting. Participants in financial markets have weakened forecasts for lowering interest rates by the Central Bank at the current meeting. At the same time, most experts believe that the regulator may pave the way for softening the monetary policy in the near future, as the growth of the eurozone economy slows down. We recommend to pay attention to the comments and rhetoric of the ECB. Additional pressure on the euro is driven by the weak reports on business activity for July in Germany and the EU. At the moment, the quotes are consolidating in the range of 1.11300-1.11500. Positions must be opened from these marks.

The Economic News Feed for 25.07.2019:

  • – IFO Business Climate Index (GER) – 11:00 (GMT+3:00);
  • – ECB Interest Rate Announcement (EU) – 14:45 (GMT+3:00);
  • – Durable Goods Sales Report (US) – 15:30 (GMT+3:00);
EUR/USD

Indicators signal the strength of the sellers: the price has fixed below 50 MA and 100 MA.

The MACD histogram is in the negative zone, but above the signal line, which gives a weak signal to sell EUR/USD.

The Stochastic Oscillator is located near the oversold zone, the %K line has started to cross the %D line. There are no signals at the moment.

Trading recommendations
  • Support levels: 1.11300, 1.11000
  • Resistance levels: 1.11500, 1.11850, 1.12100

If the price fixes below 1.11300, expect a further decline toward 1.11000-1.10800.

Alternatively, the quotes can correct toward 1.12000.

The GBP/USD currency pair

Technical indicators of the currency pair:
  • Prev Open: 1.24370
  • Open: 1.24828
  • % chg. over the last day: +0.38
  • Day’s range: 1.24709 – 1.24870
  • 52 wk range: 1.2397 – 1.3385

Yesterday, bullish sentiment prevailed on the GBP/USD currency pair. The quotes grew by 80 points. This movement is largely due to technical factors. The GBP remains under pressure. Participants in financial markets are wary of the “hard” Brexit scenario, in which Britain will leave the European Union without a trade agreement. At the moment, the trading instrument is consolidating in the range of 1.24550-1.24900. We recommend to open positions from key levels.

Today, the publication of important economic releases from the UK is not planned.

GBP/USD

Indicators do not give accurate signals: the price crossed 50 MA and 100 MA.

The MACD histogram is close to the 0 mark.

Stochastic Oscillator is in the oversold zone, the %K line crossed the %D line. There are no signals at the moment.

Trading recommendations
  • Support levels: 1.24550, 1.24200, 1.23850
  • Resistance levels: 1.24900, 1.25200, 1.25550

If the price consolidates above 1.24900, expect further growth toward 1.25200-1.25400.

Alternatively, the quotes can descend toward 1.24300-1.24100.

The USD/CAD currency pair

Technical indicators of the currency pair:
  • Prev Open: 1.31307
  • Open: 1.31395
  • % chg. over the last day: +0.07
  • Day’s range: 1.31290 – 1.31446
  • 52 wk range: 1.2727 – 1.3664

The USD/CAD is in a sideways movement. There is no defined trend. CAD is testing local support and resistance levels: 1.31200 and 1.31500, respectively. USD/CAD quotes have the potential for further recovery. Today, investors will evaluate important statistics from the United States. We also recommend to pay attention to the dynamics of oil prices. Positions must be opened from key levels.

The Economic News Feed for 25.07.2019 is calm.

USD/CAD

Indicators do not give accurate signals: the price crossed 50 MA.

The MACD histogram is located near 0.

The Stochastic Oscillator is in the neutral zone, the %K line crossed the %D line. There are no signals at the moment.

Trading recommendations
  • Support levels: 1.31200, 1.30950, 1.30650
  • Resistance levels: 1.31500, 1.31650, 1.32000

If the price consolidates above the 1.31500, expect further growth 1.31800-1.32000.

Alternatively, the quotes can drop toward 1.30900-1.30750.

The USD/JPY currency pair

Technical indicators of the currency pair:
  • Prev Open: 108.217
  • Open: 108.177
  • % chg. over the last day: -0.03
  • Day’s range: 108.076 – 108.240
  • 52 wk range: 104.97 – 114.56

An ambiguous technical picture emerged on the USD/JPY currency pair. Trading instrument is in lateral movement. Local levels of support and resistance are 108.000 and 108.300. Financial market participants expect important economic reports from the United States. We recommend to keep track of current information regarding trade negotiations between the United States and China. Positions must be opened from key levels.

The Economic News Feed for 25.07.2019 is calm.

USD/JPY

Indicators do not give accurate signals: the price crossed 50 MA.

The MACD histogram is located near the 0 mark.

The Stochastic Oscillator is in the neutral zone, the %K line crossed the %D line. There are no signals at the moment.

Trading recommendations
  • Support levels: 108.000, 107.800, 107.600
  • Resistance levels: 108.300, 108.600

If the price consolidates above the 108.300 mark, expect further growth toward 108.600-108.800.

Alternatively, the quotes can descend toward 107.800-107.600.

by JustForex

The US Currency Is Consolidating. Investors Expect the ECB Meeting

by JustForex

The US dollar is changing slightly against a basket of major currencies. The US dollar index (#DX) closed with a slight increase (+0.03%). Yesterday, mixed economic data from the US were published. Thus, the manufacturing PMI counted to 50.0 in July instead of the expected value of 51.0. New home sales increased from 604K to 646K in June. At the same time, market expectations were at the level of 660K.

Investors are focused on the ECB meeting. It is expected that the European Central Bank will not change the key marks of monetary policy following the meeting results, but will give signals to cut interest rates at the next meeting in September.

The US-China trade negotiations are also in the spotlight. The White House announced that a delegation led by US Treasury Secretary Steven Mnuchin and US Trade Representative Robert Lighthizer would go to China on Tuesday, July 30 for the next round of talks. Mnuchin expects progress and believes that more meetings will be needed, which are likely to take place later in Washington.

Yesterday, new UK Prime Minister Boris Johnson delivered a keynote speech and announced his readiness to exit the country from the European Union before October 31. He noted that he intended to conclude a new and better agreement with the EU. The official believes that the deal with the union, which developed Theresa May, is dead.

The “black gold” prices have been recovering after a sharp collapse the day before. At the moment, futures for the WTI crude oil are testing the mark of $56.25 per barrel.

Market Indicators

Yesterday, there was a variety of trends in the US stock markets: #SPY (+0.47%), #DIA (-0.27%), #QQQ (+0.70%).

The 10-year US government bonds yield has fallen. Currently, the indicator is at the level of 2.03-2.04%.

The news feed for 2019.07.25:

– German IFO business climate index at 11:00 (GMT+3:00);
– ECB interest rate decision at 14:45 (GMT+3:00);
– Statistics on durable goods orders in the US at 15:30 (GMT+3:00).

by JustForex